Sylvester, GA (Georgia) Houses and Residents
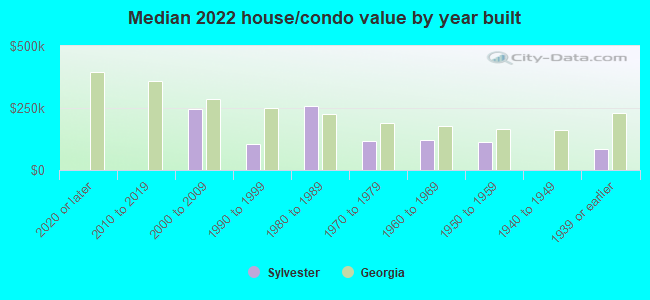
| Sylvester: | $122,758 |
| Georgia: | $297,400 |
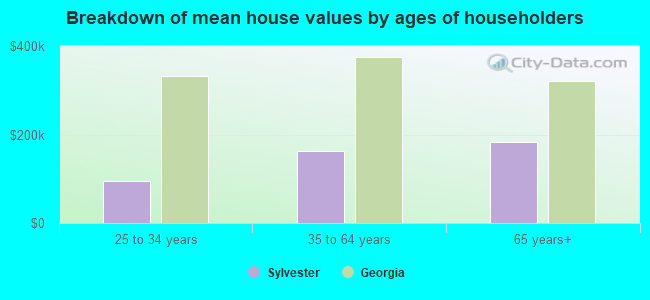
Mean price in 2022:
Detached houses: $168,358
Here: $168,358 State: $376,364 Mobile homes: $76,208
Here: $76,208 State: $102,413
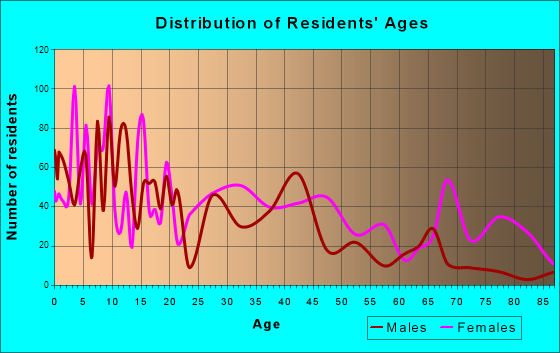
Total population: 6,097 (Urban population: 5,669 (all inside urban clusters), Rural population: 393 (all nonfarm))
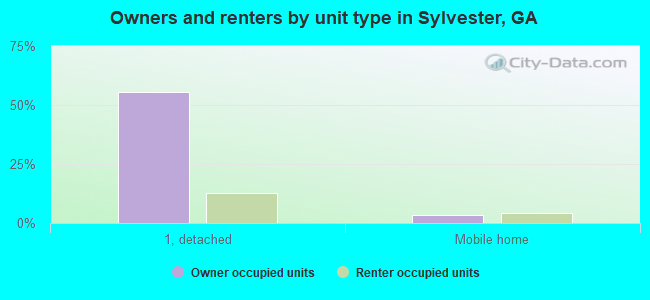
Houses: 2,536 (2,285 occupied: 1,343 owner occupied, 967 renter occupied)
| % of renters here: | 42% |
| State: | 34% |
Housing density: 444 houses/condos per square mile
Median price asked for vacant for-sale houses and condos in 2022 in this county: $71,104.
Median contract rent in 2022: $531 (lower quartile is $248, upper quartile is $660)
Median rent asked for vacant for-rent units in 2022: $937
Median gross rent in Sylvester, GA in 2022: $851
Housing units in Sylvester with a mortgage: 598 (11 second mortgage, 0 home equity loan, 12 both second mortgage and home equity loan)
Houses without a mortgage: 33
Median household income for houses/condos with a mortgage: $57,259
Median household income for apartments without a mortgage: $60,842
Median monthly housing costs: $800
Compare current foreclosures in Sylvester, GA:
| Photo | Address | Area | Beds / Baths | Price | Details |
|---|---|---|---|---|---|

|
#1
Elli Dr
Sylvester, GA 31791
|
2,100 sq. feet
|
- baths - beds |
show details | |

|
#2
Wrights Chapel Rd
Sylvester, GA 31791
|
- sq. feet
|
- baths - beds |
show details | |

|
#3
E Price St
Sylvester, GA 31791
|
1,472 sq. feet
|
- baths - beds |
show details | |

|
#4
Crapps Rd
Sylvester, GA 31791
|
1,152 sq. feet
|
- baths - beds |
show details | |

|
#5
W King St Apt 307
Sylvester, GA 31791
|
- sq. feet
|
- baths - beds |
show details | |

|
#6
Maplewood Ln
Sylvester, GA 31791
|
1,258 sq. feet
|
- baths - beds |
show details | |

|
#7
N Jefferson St
Sylvester, GA 31791
|
- sq. feet
|
- baths - beds |
show details | |

|
#8
W Pine St
Sylvester, GA 31791
|
- sq. feet
|
- baths - beds |
show details | |

|
#9
S Jefferson St
Sylvester, GA 31791
|
- sq. feet
|
- baths - beds |
show details | |

|
#10
Youngblood Rd Lot 5
Sylvester, GA 31791
|
- sq. feet
|
- baths - beds |
show details |
| Photo | Address | Area | Beds / Baths | Price | Details |
|---|---|---|---|---|---|

|
#11
Green Ln
Sylvester, GA 31791
|
- sq. feet
|
- baths - beds |
show details | |

|
#12
Moore St
Sylvester, GA 31791
|
1,653 sq. feet
|
- baths - beds |
show details | |

|
#13
Moore St
Sylvester, GA 31791
|
1,350 sq. feet
|
- baths - beds |
show details | |

|
#14
Christina Dr
Sylvester, GA 31791
|
- sq. feet
|
- baths - beds |
show details | |

|
#15
W Young St
Sylvester, GA 31791
|
- sq. feet
|
- baths - beds |
show details | |

|
#16
Old Mail Rd
Sylvester, GA 31791
|
1,304 sq. feet
|
- baths - beds |
show details | |

|
#17
N Washington St
Sylvester, GA 31791
|
1,066 sq. feet
|
- baths - beds |
show details | |

|
#18
Massey Airport Rd
Sylvester, GA 31791
|
- sq. feet
|
- baths - beds |
show details | |

|
#19
Ga Highway 33 S
Sylvester, GA 31791
|
- sq. feet
|
- baths - beds |
show details | |

|
#20
Sumner St
Sylvester, GA 31791
|
- sq. feet
|
- baths - beds |
show details |
| Photo | Address | Area | Beds / Baths | Price | Details |
|---|---|---|---|---|---|

|
#21
Jackson Cir
Sylvester, GA 31791
|
- sq. feet
|
- baths - beds |
show details | |

|
#22
Sherman Oaks Dr
Sylvester, GA 31791
|
- sq. feet
|
- baths - beds |
show details | |

|
#23
Massey Airport Rd
Sylvester, GA 31791
|
1,066 sq. feet
|
- baths - beds |
show details | |

|
#24
N Washington St
Sylvester, GA 31791
|
- sq. feet
|
- baths - beds |
show details | |

|
#25
Marginal St
Sylvester, GA 31791
|
1,560 sq. feet
|
- baths - beds |
show details | |

|
#26
Red Rock Rd
Sylvester, GA 31791
|
1,704 sq. feet
|
- baths - beds |
show details | |

|
#27
E Wallace St
Sylvester, GA 31791
|
1,008 sq. feet
|
- baths - beds |
show details | |

|
#28
E Pine St
Sylvester, GA 31791
|
1,150 sq. feet
|
- baths - beds |
show details | |

|
#29
N Westberry St
Sylvester, GA 31791
|
1,272 sq. feet
|
- baths - beds |
show details | |

|
#30
Red Rock Rd
Sylvester, GA 31791
|
- sq. feet
|
- baths - beds |
show details |
| Photo | Address | Area | Beds / Baths | Price | Details |
|---|---|---|---|---|---|

|
#31
N Monroe St
Sylvester, GA 31791
|
2,002 sq. feet
|
- baths - beds |
show details | |

|
#32
E Longleaf Dr
Sylvester, GA 31791
|
1,787 sq. feet
|
- baths - beds |
show details | |

|
#33
Darlington Rd
Sylvester, GA 31791
|
- sq. feet
|
- baths - beds |
show details | |

|
#34
Ga Highway 313
Sylvester, GA 31791
|
- sq. feet
|
- baths - beds |
show details | |

|
#35
Bridgeboro Anderson City Rd
Sylvester, GA 31791
|
- sq. feet
|
- baths - beds |
show details | |

|
#36
N Jefferson St
Sylvester, GA 31791
|
880 sq. feet
|
- baths - beds |
show details | |

|
#37
Ga Highway 313
Sylvester, GA 31791
|
- sq. feet
|
- baths - beds |
show details | |

|
#38
N Washington St
Sylvester, GA 31791
|
- sq. feet
|
- baths - beds |
show details | |

|
#39
Us Highway 82 W Lot 33
Sylvester, GA 31791
|
- sq. feet
|
- baths - beds |
show details | |

|
#40
Covey St
Sylvester, GA 31791
|
- sq. feet
|
- baths - beds |
show details |
| Photo | Address | Area | Beds / Baths | Price | Details |
|---|---|---|---|---|---|

|
#41
Ga Highway 313
Sylvester, GA 31791
|
- sq. feet
|
- baths - beds |
show details | |

|
#42
Bridges St Lot 1
Sylvester, GA 31791
|
- sq. feet
|
- baths - beds |
show details | |

|
#43
Johnny Aultman Rd
Sylvester, GA 31791
|
- sq. feet
|
- baths - beds |
show details | |

|
#44
Hillside Dr
Sylvester, GA 31791
|
- sq. feet
|
- baths - beds |
show details | |

|
#45
Oakland Heights Rd
Sylvester, GA 31791
|
- sq. feet
|
- baths - beds |
show details | |

|
#46
Douthit Rd
Sylvester, GA 31791
|
- sq. feet
|
- baths - beds |
show details | |

|
#47
Peafowl Rd
Sylvester, GA 31791
|
- sq. feet
|
- baths - beds |
show details | |

|
#48
Pebble Hill Cir
Sylvester, GA 31791
|
- sq. feet
|
- baths - beds |
show details | |

|
#49
Pebble Hill Cir
Sylvester, GA 31791
|
- sq. feet
|
- baths - beds |
show details | |

|
Check over 1 million property listings on Foreclosure.com!
|
browse all offers | |||

Latest news about housing in Sylvester, GA collected exclusively by city-data.com from local newspapers, TV, and radio stations

 | Sylvester, Georgia insights? (22 replies) |
| New Job in Albany, GA (20 replies) |
| Inaugural Bob Wright Symposium on Business Empowerment will be Aug. 20 (0 replies) |
| Looking for conservative, small-town, southern Georgia (48 replies) |
| Looking to return to my homeland...need advice, esp from NW Georgians! (11 replies) |
| Just curious...Any celebrity sightings?? (187 replies) |
Median year apartment built: 1974
Household type by relationship:
Households: 5,721- Male householders: 946 (149 living alone), Female householders: 1,322 (533 living alone)
714 spouses (694 opposite-sex spouses), 115 unmarried partners, (81 opposite-sex unmarried partners), 1,773 children (1,752 natural, 0 adopted, 21 stepchildren), 195 grandchildren, 70 brothers or sisters, 212 parents, 0 foster children, 97 other relatives, 88 non-relatives
- In group quarters: 185
Size of family households: 666 2-persons, 558 3-persons, 212 4-persons, 106 5-persons, 8 6-persons, 6 7-or-more-persons.
Size of nonfamily households: 685 1-person, 35 2-persons, 29 3-persons.
225 married couples with children.
942 single-parent households (70 men, 872 women).
98.7% of residents of Sylvester speak English at home.
0.4% of residents speak Spanish at home (100% speak English very well).
0.5% of residents speak other Indo-European language at home (33% speak English very well, 67% speak English well).
0.3% of residents speak Asian or Pacific Island language at home (100% speak English very well).
Foreign born population: 28 (0.5%)
(75.0% of them are naturalized citizens)
| Here: | 6.2 |
| State: | 6.8 |
| Here: | 4.3 |
| State: | 4.6 |
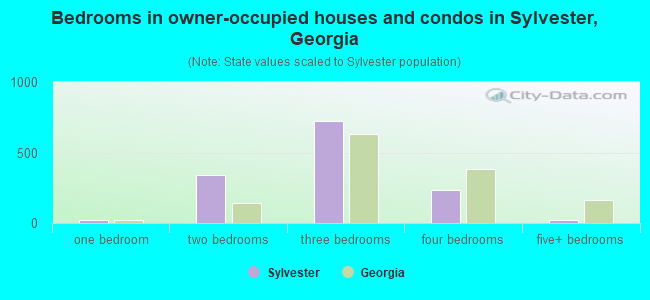
- Bedrooms in owner-occupied houses and condos in Sylvester, Georgia
- 0no bedroom
- 211 bedroom
- 3432 bedrooms
- 7243 bedrooms
- 2334 bedrooms
- 235+ bedrooms
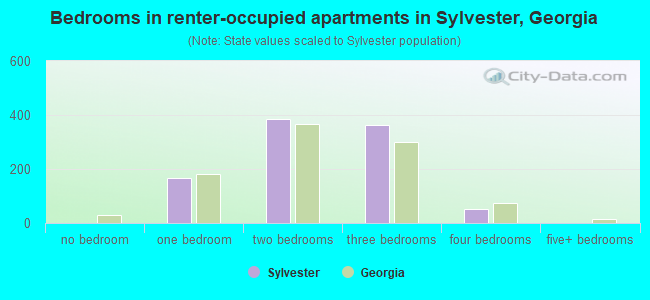
- Bedrooms in renter-occupied apartments in Sylvester, Georgia
- 0no bedroom
- 1681 bedroom
- 3862 bedrooms
- 3623 bedrooms
- 524 bedrooms
- 05+ bedrooms
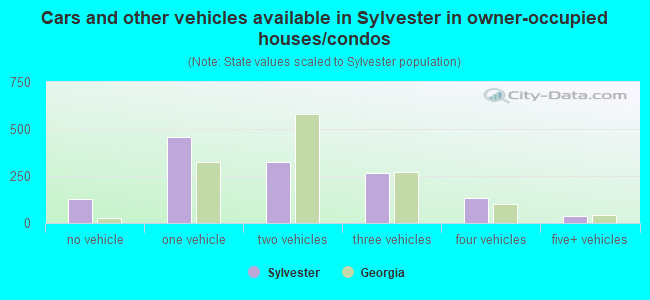
- Cars and other vehicles available in Sylvester in owner-occupied houses/condos
- 129no vehicle
- 4581 vehicle
- 3252 vehicles
- 2673 vehicles
- 1314 vehicles
- 355+ vehicles
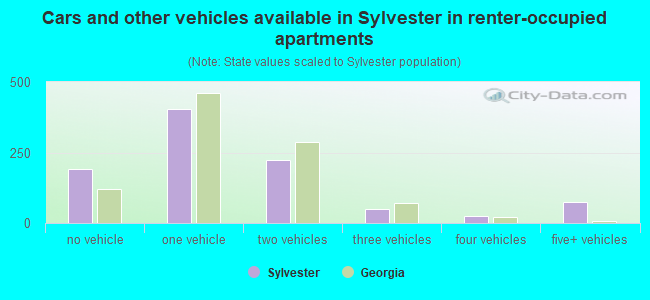
- Cars and other vehicles available in Sylvester in renter-occupied apartments
- 192no vehicle
- 4031 vehicle
- 2232 vehicles
- 503 vehicles
- 264 vehicles
- 745+ vehicles
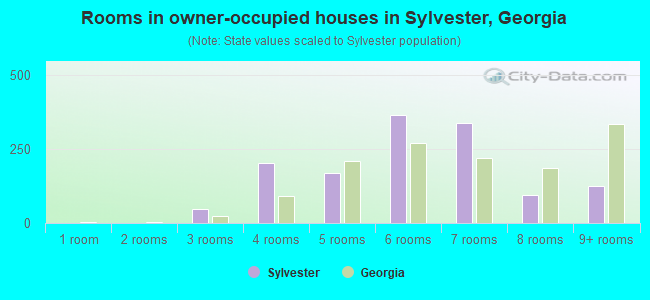
- Rooms in owner-occupied houses in Sylvester, Georgia
- 01 room
- 02 rooms
- 483 rooms
- 2024 rooms
- 1695 rooms
- 3666 rooms
- 3387 rooms
- 958 rooms
- 1259+ rooms
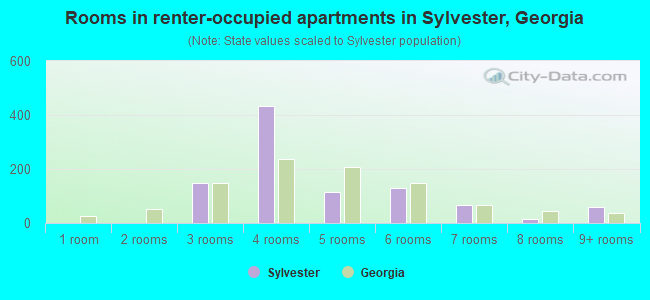
- Rooms in renter-occupied apartments in Sylvester, Georgia
- 01 room
- 02 rooms
- 1473 rooms
- 4344 rooms
- 1155 rooms
- 1316 rooms
- 667 rooms
- 138 rooms
- 609+ rooms
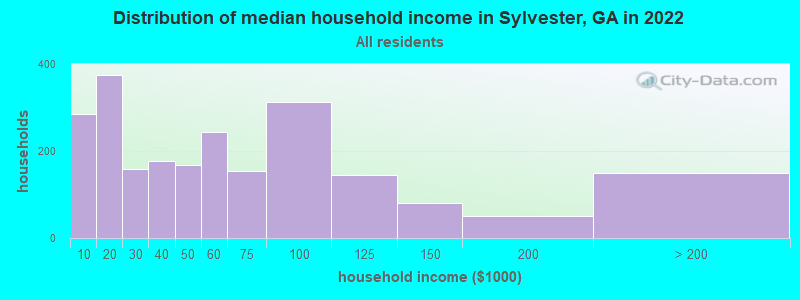
Sylvester, GA household income distribution

- 284Less than $10,000
- 375$10,000 to $19,999
- 159$20,000 to $29,999
- 178$30,000 to $39,999
- 167$40,000 to $49,999
- 243$50,000 to $59,999
- 155$60,000 to $74,999
- 312$75,000 to $99,999
- 145$100,000 to $124,999
- 80$125,000 to $149,999
- 51$150,000 to $199,999
- 149$200,000 or more
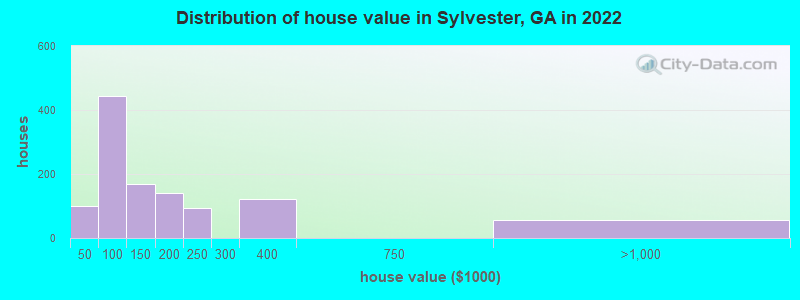
Home value of owner - occupied houses in 2022 in Sylvester, GA
-
- 9$15,000 to $19,999
- 9$25,000 to $29,999
- 6$30,000 to $34,999
- 72$35,000 to $39,999
- 1$40,000 to $49,999
- 96$50,000 to $59,999
- 12$60,000 to $69,999
- 100$70,000 to $79,999
- 144$80,000 to $89,999
- 87$90,000 to $99,999
- 97$100,000 to $124,999
- 73$125,000 to $149,999
- 140$150,000 to $174,999
- 95$200,000 to $249,999
- 120$300,000 to $399,999
- 54$750,000 to $999,999
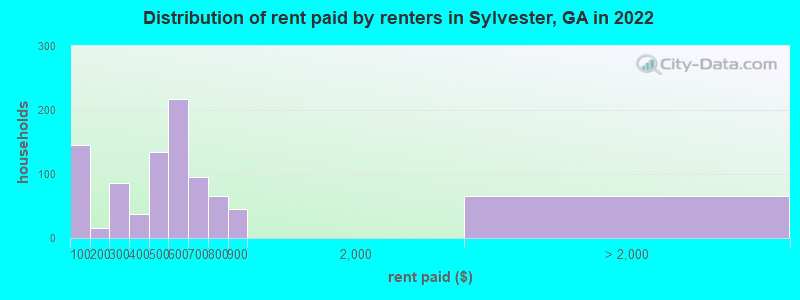
Rent paid by renters in 2022 in Sylvester, GA
-
- 145Less than $100
- 14$100 to $149
- 52$200 to $249
- 33$250 to $299
- 37$350 to $399
- 90$400 to $449
- 42$450 to $499
- 169$500 to $549
- 47$550 to $599
- 60$600 to $649
- 35$650 to $699
- 36$700 to $749
- 28$750 to $799
- 46$800 to $899
- 37$2,000 to $2,499
- 27No cash rent
Percentage of workers working in this county: 57.1%
Number of people working at home: 180 (7.4% of all workers)
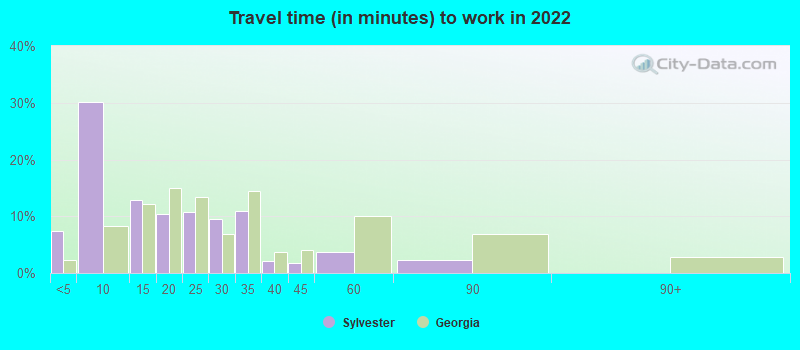
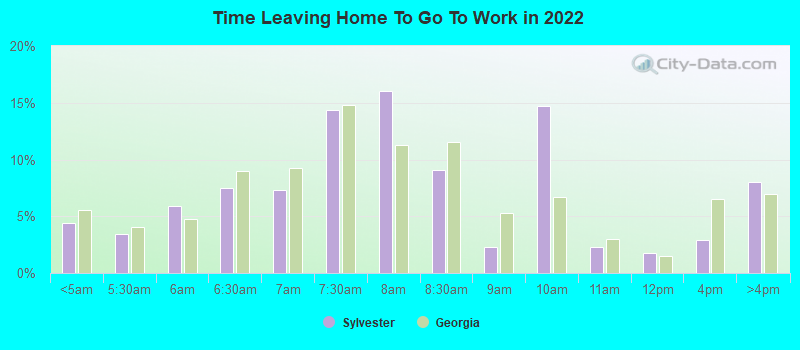
Travel time to work (commute)
- Less than 5 minutes: 168
- 5 to 9 minutes: 704
- 10 to 14 minutes: 115
- 15 to 19 minutes: 112
- 20 to 24 minutes: 245
- 25 to 29 minutes: 89
- 30 to 34 minutes: 412
- 35 to 39 minutes: 75
- 40 to 44 minutes: 164
- 45 to 59 minutes: 101
- 60 to 89 minutes: 26
- 90 or more minutes: 19
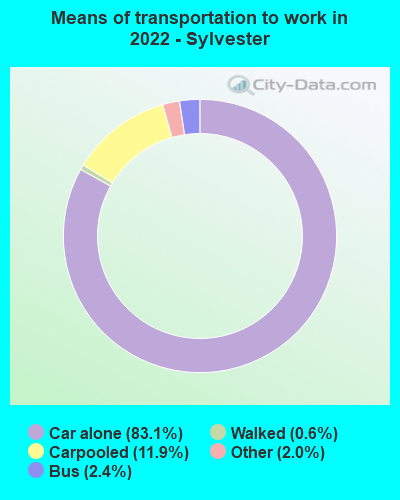
Means of transportation to work:
- Drove a car alone: 1,830 (74.7%)
- Carpooled: 273 (11.1%)
- Bus: 41 (1.7%)
- Taxi: 46 (1.9%)
- Walked: 14 (0.6%)
- Worked at home: 180 (7.3%)
- Unemployment by race in 2022
- Unemployment rate for White non-Hispanic residents
- 5.1%Males
- Unemployment rate for Black residents
- 4.7%Males
- 9.6%Females
- Unemployment rate for Asian residents
- 100.0%Females
- Unemployment rate for two or more race residents
- 100.0%Females
- Unemployment rate for Hispanic or Latino residents
- 100.0%Females
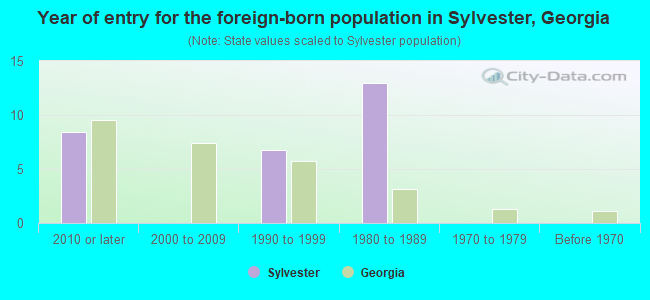
- Year of entry for the foreign-born population in Sylvester, Georgia
- 82010 or later
- 02000 to 2009
- 71990 to 1999
- 131980 to 1989
- 01970 to 1979
- 0Before 1970
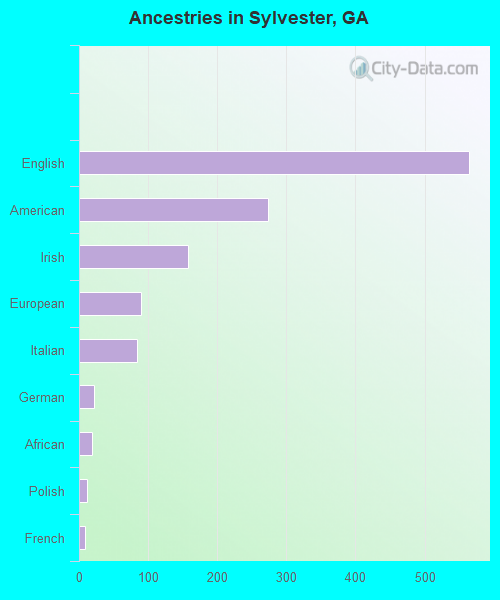
First ancestries reported:
- English: 565 (19.4%)
- American: 274 (9.4%)
- Irish: 158 (5.4%)
- European: 89 (3.1%)
- Italian: 84 (2.9%)
- German: 22 (0.8%)
- African: 19 (0.7%)
- Polish: 11 (0.4%)
- French: 9 (0.3%)
Most common places of birth for foreign-born residents (%):
| Sylvester: | 75.0% (21) |
| Georgia: | 3.9% (43,756) |
| Sylvester: | 21.4% (6) |
| Georgia: | 0.6% (6,160) |
Place of birth for U.S.-born residents:
- This state: 4,848
- Other state: 773
- Northeast: 104
- Midwest: 88
- South: 482
- West: 99
93.7% of Sylvester residents lived in the same house 1 years ago.
Out of people who lived in different houses, 31.7% lived in this county.
Out of people who lived in different counties, 73.5% lived in Georgia.
| Sylvester: | 93.7% |
| State average: | 86.6% |
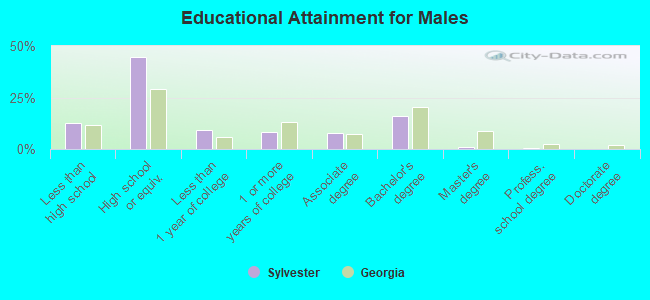
Education attainment for males 25 years and older:
- No schooling: 19
- Nursery to 4th grade: 0
- 5th and 6th grade: 0
- 7th and 8th grade: 2
- 9th grade: 116
- 10th grade: 44
- 11th grade: 17
- 12th grade, no diploma: 3
- High school graduate (or equivalency): 710
- Less than 1 year of college: 148
- Some college more than 1 year, no degree: 132
- Associate degree: 125
- Bachelor's degree: 251
- Master's degree: 14
- Professional school degree: 10
- Doctorate degree: 0
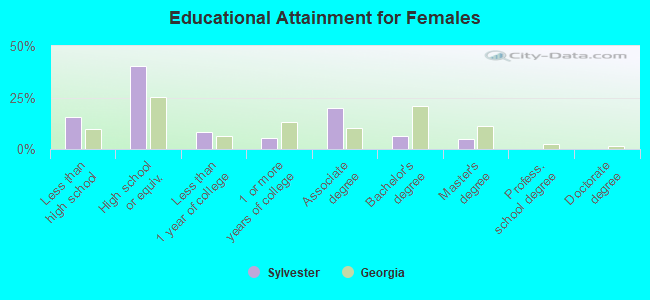
Education attainment for females 25 years and older:
- No schooling: 28
- Nursery to 4th grade: 0
- 5th and 6th grade: 51
- 7th and 8th grade: 3
- 9th grade: 14
- 10th grade: 31
- 11th grade: 148
- 12th grade, no diploma: 45
- High school graduate (or equivalency): 839
- Less than 1 year of college: 170
- Some college more than 1 year, no degree: 112
- Associate degree: 416
- Bachelor's degree: 130
- Master's degree: 100
- Professional school degree: 4
- Doctorate degree: 0
Housing units in structures:
- One, detached: 1,678
- One, attached: 49
- Two: 258
- 3 or 4: 77
- 5 to 9: 203
- 10 to 19: 39
- 20 to 49: 4
- 50 or more: 28
- Mobile homes: 196
Median worth of mobile homes: $64,376
Housing units lacking complete kitchen facilities in 2022: 3.7%
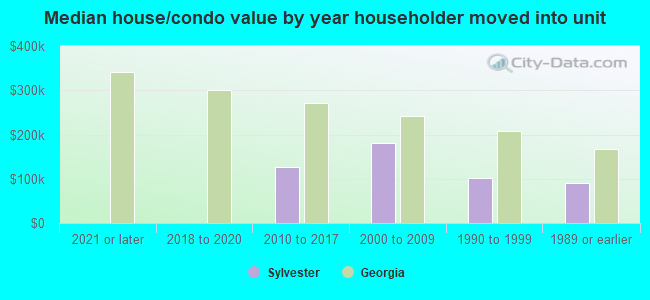
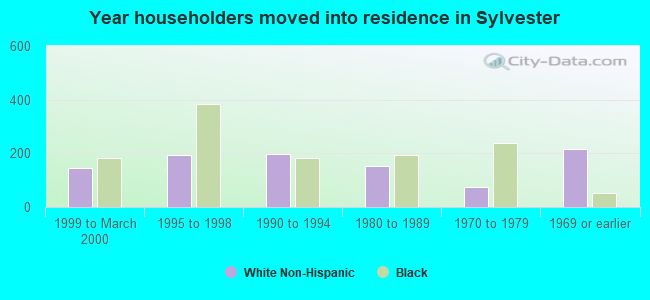
House/condo owner moved in on average 20 years ago
Renter moved in on average 6 years ago
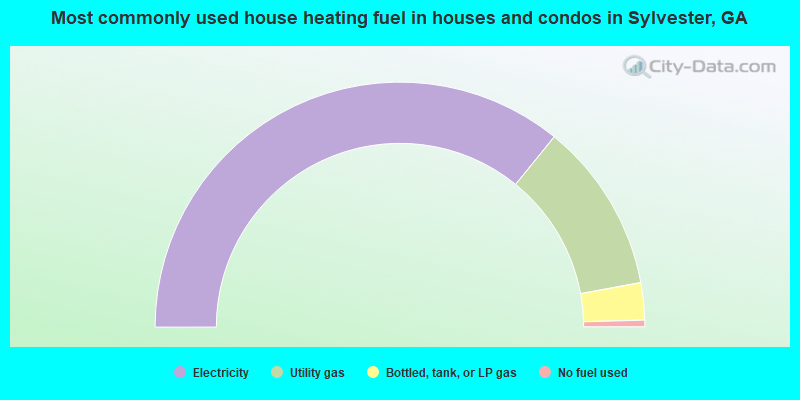
- 71.7%Electricity
- 22.5%Utility gas
- 4.9%Bottled, tank, or LP gas
- 0.9%No fuel used
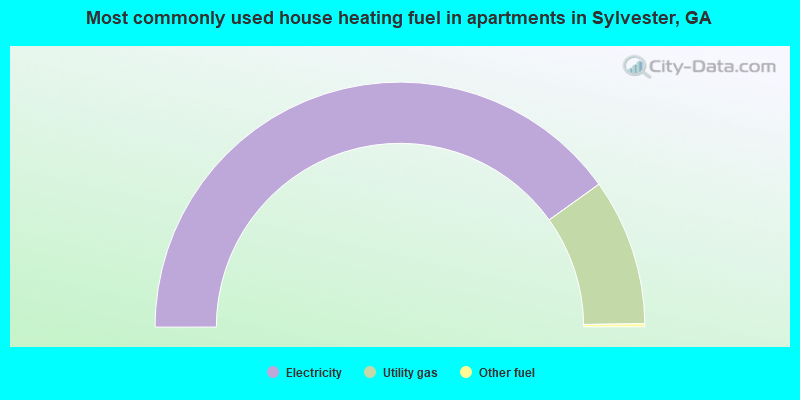
- 80.2%Electricity
- 19.4%Utility gas
- 0.4%Other fuel
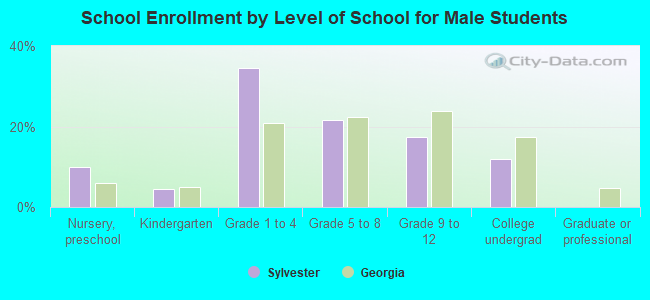
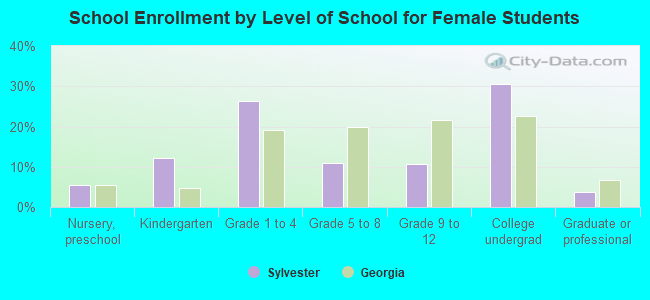
Private vs. public school enrollment:
| Here: | 0.0% |
| Georgia: | 12.1% |
| Here: | 4.4% |
| Georgia: | 10.8% |
| Here: | 17.6% |
| Georgia: | 17.1% |