Sylvan Shores, FL (Florida) Houses and Residents
| Sylvan Shores: | $160,637 |
| Florida: | $354,100 |
Total population: 2,731 (Urban population: 2,155 (all inside urban clusters), Rural population: 281 (all nonfarm))
Houses: 1,484 (1,153 occupied: 1,069 owner occupied, 84 renter occupied)
| % of renters here: | 7% |
| State: | 33% |
Housing density: 665 houses/condos per square mile
Median price asked for vacant for-sale houses and condos in 2022 in this county: $176,293.
Median contract rent in 2022: $1,007 (lower quartile is $545, upper quartile is $1,086)
Median gross rent in Sylvan Shores, FL in 2022: $972
Housing units in Sylvan Shores with a mortgage: 364 (29 second mortgage, 63 home equity loan, 0 both second mortgage and home equity loan)
Houses without a mortgage: 294
Compare current foreclosures near Sylvan Shores, FL:
| Photo | Address | Area | Beds / Baths | Price | Details |
|---|---|---|---|---|---|

|
#1
Expedition Ave
Sebring, FL 33875
|
1,144 sq. feet
|
2 baths 3 beds |
show details | |

|
#2
W Josephine Rd
Sebring, FL 33875
|
- sq. feet
|
2 baths 4 beds |
show details | |

|
#3
Citadel St
Lake Placid, FL 33852
|
1,200 sq. feet
|
2 baths 3 beds |
show details | |

|
#4
Voss Ct
Sebring, FL 33876
|
1,044 sq. feet
|
2 baths 2 beds |
show details | |

|
#5
Lark Ave
Sebring, FL 33870
|
1,256 sq. feet
|
1 baths 2 beds |
show details | |

|
#6
Richwood Dr
Sebring, FL 33875
|
1,839 sq. feet
|
2 baths 3 beds |
show details | |

|
#7
Oak Bend Ave
Sebring, FL 33876
|
744 sq. feet
|
2 baths 3 beds |
show details | |

|
#8
Lakeview Dr
Sebring, FL 33870
|
1,812 sq. feet
|
2 baths 3 beds |
show details | |

|
#9
Indian Dr
Sebring, FL 33875
|
2,258 sq. feet
|
2 baths 3 beds |
show details | |

|
#10
Kite Ave
Sebring, FL 33870
|
1,406 sq. feet
|
2 baths 2 beds |
show details |
| Photo | Address | Area | Beds / Baths | Price | Details |
|---|---|---|---|---|---|

|
#11
Thrush Ave
Sebring, FL 33870
|
1,690 sq. feet
|
2 baths 3 beds |
show details | |

|
#12
Belaire Ct
Sebring, FL 33870
|
840 sq. feet
|
2 baths 3 beds |
show details | |

|
#13
Kite Ave
Sebring, FL 33870
|
1,411 sq. feet
|
2 baths 2 beds |
show details | |

|
#14
Lagrange Ave
Sebring, FL 33870
|
1,148 sq. feet
|
2 baths 2 beds |
show details | |

|
#15
Stream Ave
Sebring, FL 33875
|
1,308 sq. feet
|
2 baths 2 beds |
show details | |

|
#16
Bay Blossom Dr
Sebring, FL 33876
|
3,115 sq. feet
|
4 baths 4 beds |
show details | |

|
#17
Orange Blossom Ave
Sebring, FL 33870
|
1,056 sq. feet
|
1 baths 3 beds |
show details | |

|
#18
Tanager Ave
Sebring, FL 33870
|
1,341 sq. feet
|
3 baths 4 beds |
show details | |

|
#19
Fernvale Ave
Sebring, FL 33870
|
839 sq. feet
|
1 baths 2 beds |
show details | |

|
#20
Scott Ave
Sebring, FL 33870
|
1,152 sq. feet
|
1 baths 3 beds |
show details |
| Photo | Address | Area | Beds / Baths | Price | Details |
|---|---|---|---|---|---|

|
#21
Orange Blossom Ave
Sebring, FL 33870
|
925 sq. feet
|
1 baths 3 beds |
show details | |

|
#22
Sportsman Ave
Sebring, FL 33875
|
1,700 sq. feet
|
2 baths 3 beds |
show details | |

|
#23
Leaf Rd
Sebring, FL 33875
|
1,112 sq. feet
|
2 baths 2 beds |
show details | |

|
#24
Loquat Rd
Sebring, FL 33875
|
1,116 sq. feet
|
2 baths 2 beds |
show details | |

|
#25
Creekside Dr
Sebring, FL 33875
|
3,824 sq. feet
|
5 baths 4 beds |
show details | |

|
#26
Persimmon Ave
Sebring, FL 33870
|
1,162 sq. feet
|
1 baths 2 beds |
show details | |

|
#27
Caribbean Rd
Sebring, FL 33870
|
1,144 sq. feet
|
2 baths 2 beds |
show details | |

|
#28
Lakeview Dr Apt 208
Sebring, FL 33870
|
882 sq. feet
|
1 baths 1 beds |
show details | |

|
#29
Golfside Ln
Sebring, FL 33870
|
1,862 sq. feet
|
2 baths 2 beds |
show details | |

|
#30
Par Rd
Sebring, FL 33872
|
3,097 sq. feet
|
3 baths 4 beds |
show details |
| Photo | Address | Area | Beds / Baths | Price | Details |
|---|---|---|---|---|---|

|
#31
Thunder Rd
Sebring, FL 33876
|
1,783 sq. feet
|
2 baths 3 beds |
show details | |

|
#32
Bear Rd
Lake Placid, FL 33852
|
2,628 sq. feet
|
2 baths 3 beds |
show details | |

|
#33
Melody Ct
Lake Placid, FL 33852
|
2,221 sq. feet
|
2 baths 3 beds |
show details | |

|
#34
Tayloe Ln
Lake Placid, FL 33852
|
1,625 sq. feet
|
2 baths 3 beds |
show details | |

|
#35
Cedarbrook St
Lake Placid, FL 33852
|
1,279 sq. feet
|
2 baths 3 beds |
show details | |

|
#36
Washington Blvd
Lake Placid, FL 33852
|
1,138 sq. feet
|
2 baths 2 beds |
show details | |

|
#37
S Canal Blvd
Sebring, FL 33870
|
2,433 sq. feet
|
3 baths 3 beds |
show details | |

|
#38
Cloverleaf Rd
Lake Placid, FL 33852
|
1,032 sq. feet
|
1 baths 2 beds |
show details | |

|
#39
Holmes Ave
Lake Placid, FL 33852
|
1,104 sq. feet
|
1 baths 3 beds |
show details | |

|
#40
Fern Ct
Lake Placid, FL 33852
|
1,625 sq. feet
|
2 baths 3 beds |
show details |
| Photo | Address | Area | Beds / Baths | Price | Details |
|---|---|---|---|---|---|

|
#41
Camellia Ln
Lake Placid, FL 33852
|
1,030 sq. feet
|
2 baths 3 beds |
show details | |

|
#42
Parkview Dr
Lake Placid, FL 33852
|
992 sq. feet
|
1 baths 2 beds |
show details | |

|
#43
Memorial Dr
Sebring, FL 33870
|
2,099 sq. feet
|
3 baths 3 beds |
show details | |

|
#44
Blue Skies Dr
Lake Placid, FL 33852
|
1,517 sq. feet
|
2 baths 3 beds |
show details | |

|
#45
Sprite Ave
Sebring, FL 33872
|
1,405 sq. feet
|
2 baths 3 beds |
show details | |

|
#46
Cumquat Rd NW
Lake Placid, FL 33852
|
1,420 sq. feet
|
2 baths 2 beds |
show details | |

|
#47
Enos Ave
Lake Placid, FL 33852
|
1,396 sq. feet
|
2 baths 3 beds |
show details | |

|
#48
Grand Concourse
Sebring, FL 33875
|
1,466 sq. feet
|
2 baths 3 beds |
show details | |

|
#49
Pinehill Ln
Sebring, FL 33876
|
1,144 sq. feet
|
2 baths 3 beds |
show details | |

|
Check over 1 million property listings on Foreclosure.com!
|
browse all offers | |||

 | help with possible relocation to Venice, Fl (30 replies) |
| Looking for a good school district and a safe neighborhood (32 replies) |
| Tampa vs Palm Harbor vs Sarasota (7 replies) |
| Sarasota area by the airport (6 replies) |
| Best neighborhoods for 40 yr olds w/elementary school kids (3 replies) |
| Canal front but safe community? (75 replies) |

Household type by relationship:
Households: 97,053- In family households: 79,195 (20,706 male householders, 7,321 female householders)
22,127 spouses, 20,867 children (18,926 natural, 607 adopted, 1,334 stepchildren), 2,285 grandchildren, 805 brothers or sisters, 834 parents, foster children, 1,236 other relatives, 2,403 non-relatives
- In nonfamily households: 17,858 (6,382 male householders (4,963 living alone)), 8,195 female householders (7,187 living alone)), 3,281 nonrelatives
- In group quarters: 1,733 (1,127 institutionalized population)
9,801 married couples with children.
4,499 single-parent households (1,040 men, 3,459 women).
87.8% of residents of Sylvan Shores speak English at home.
9.9% of residents speak Spanish at home (49% speak English very well, 35% speak English well, 10% speak English not well, 6% don't speak English at all).
2.2% of residents speak other Indo-European language at home (79% speak English very well, 21% speak English not well).
Foreign born population: 194 (6.6%)
(154.6% of them are naturalized citizens)
| Here: | 5.3 |
| State: | 5.9 |
| Here: | 4.3 |
| State: | 4.2 |

- Bedrooms in owner-occupied houses and condos in Sylvan Shores, Florida
- 0no bedroom
- 351 bedroom
- 7012 bedrooms
- 2713 bedrooms
- 544 bedrooms
- 85+ bedrooms

- Bedrooms in renter-occupied apartments in Sylvan Shores, Florida
- 0no bedroom
- 81 bedroom
- 402 bedrooms
- 363 bedrooms
- 04 bedrooms
- 05+ bedrooms

- Cars and other vehicles available in Sylvan Shores in owner-occupied houses/condos
- 32no vehicle
- 5761 vehicle
- 3542 vehicles
- 953 vehicles
- 84 vehicles
- 45+ vehicles

- Cars and other vehicles available in Sylvan Shores in renter-occupied apartments
- 0no vehicle
- 411 vehicle
- 322 vehicles
- 113 vehicles
- 04 vehicles
- 05+ vehicles

- Rooms in owner-occupied houses in Sylvan Shores, Florida
- 01 room
- 82 rooms
- 553 rooms
- 2274 rooms
- 4945 rooms
- 1156 rooms
- 987 rooms
- 448 rooms
- 289+ rooms

- Rooms in renter-occupied apartments in Sylvan Shores, Florida
- 01 room
- 02 rooms
- 83 rooms
- 194 rooms
- 525 rooms
- 56 rooms
- 07 rooms
- 08 rooms
- 09+ rooms


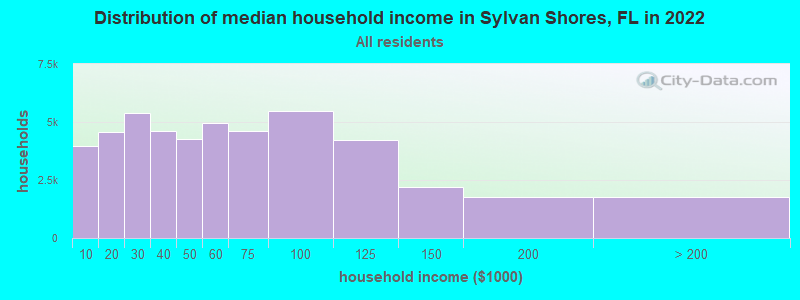
Sylvan Shores, FL household income distribution

- 3,984Less than $10,000
- 4,554$10,000 to $19,999
- 5,408$20,000 to $29,999
- 4,628$30,000 to $39,999
- 4,284$40,000 to $49,999
- 4,965$50,000 to $59,999
- 4,613$60,000 to $74,999
- 5,455$75,000 to $99,999
- 4,220$100,000 to $124,999
- 2,205$125,000 to $149,999
- 1,779$150,000 to $199,999
- 1,766$200,000 or more
Percentage of workers working in this county: 87.8%
Number of people working at home: 61 (7.0% of all workers)
Travel time to work (commute)
- Less than 5 minutes: 8
- 5 to 9 minutes: 144
- 10 to 14 minutes: 173
- 15 to 19 minutes: 41
- 20 to 24 minutes: 65
- 25 to 29 minutes: 76
- 30 to 34 minutes: 65
- 35 to 39 minutes: 0
- 40 to 44 minutes: 5
- 45 to 59 minutes: 4
- 60 to 89 minutes: 23
- 90 or more minutes: 32
Means of transportation to work:
- Drove a car alone: 589 (84.1%)
- Carpooled: 27 (3.9%)
- Walked: 20 (2.9%)
- Worked at home: 64 (9.1%)


- Year of entry for the foreign-born population in Sylvan Shores, Florida
- 01995 to March 2000
- 01990 to 1994
- 341985 to 1989
- 01980 to 1984
- 211975 to 1979
- 191970 to 1974
- 01965 to 1969
- 64Before 1965

First ancestries reported:
- Other: 423 (16.8%)
- United States: 406 (16.2%)
- German: 388 (15.4%)
- Irish: 371 (14.8%)
- English: 331 (13.2%)
- Italian: 139 (5.5%)
- Polish: 100 (4.0%)
- Scotch-Irish: 60 (2.4%)
- French: 57 (2.3%)
- Scottish: 52 (2.1%)
- Dutch: 46 (1.8%)
- Danish: 29 (1.2%)
- Welsh: 24 (1.0%)
- Slovak: 23 (0.9%)
- Swedish: 19 (0.8%)
- Greek: 17 (0.7%)
- Ukrainian: 11 (0.4%)
- Czech: 9 (0.4%)
- Russian: 8 (0.3%)
Most common places of birth for foreign-born residents (%):
| Sylvan Shores: | 37.7% (52) |
| Florida: | 3.7% (99,139) |
| Sylvan Shores: | 31.9% (44) |
| Florida: | 7.1% (189,119) |
| Sylvan Shores: | 26.1% (36) |
| Florida: | 0.7% (18,153) |
| Sylvan Shores: | 4.3% (6) |
| Florida: | 1.2% (31,508) |
Place of birth for U.S.-born residents:
- This state: 692
- Other state: 1,544
- Northeast: 416
- Midwest: 753
- South: 337
- West: 38
59% of Sylvan Shores residents lived in the same house 5 years ago.
Out of people who lived in different houses, 49% lived in this county.
Out of people who lived in different counties, 56% lived in Florida.
Education attainment for males 25 years and older:
- No schooling: 0
- Nursery to 4th grade: 9
- 5th and 6th grade: 21
- 7th and 8th grade: 59
- 9th grade: 48
- 10th grade: 24
- 11th grade: 26
- 12th grade, no diploma: 2
- High school graduate (or equivalency): 316
- Less than 1 year of college: 99
- Some college more than 1 year, no degree: 166
- Associate degree: 40
- Bachelor's degree: 72
- Master's degree: 11
- Professional school degree: 12
- Doctorate degree: 11

Education attainment for females 25 years and older:
- No schooling: 0
- Nursery to 4th grade: 14
- 5th and 6th grade: 11
- 7th and 8th grade: 37
- 9th grade: 43
- 10th grade: 20
- 11th grade: 75
- 12th grade, no diploma: 55
- High school graduate (or equivalency): 437
- Less than 1 year of college: 102
- Some college more than 1 year, no degree: 153
- Associate degree: 80
- Bachelor's degree: 65
- Master's degree: 19
- Professional school degree: 0
- Doctorate degree: 0


Housing units in structures:
- One, detached: 845
- 10 to 19: 22
- 20 to 49: 5
- Mobile homes: 612
Median worth of mobile homes: $52,524

Private vs. public school enrollment:
| Here: | 0.0% |
| Florida: | 11.7% |
| Here: | 0.0% |
| Florida: | 9.7% |
| Here: | 0.0% |
| Florida: | 21.0% |


