Swansea, MA (Massachusetts) Houses and Residents
| Swansea: | $412,617 |
| Massachusetts: | $534,700 |
Total population: 15,865 (Urban population: 13,398, Rural population: 2,503 (all nonfarm))
Houses: 6,070 (5,888 occupied: 4,994 owner occupied, 894 renter occupied)
| % of renters here: | 15% |
| State: | 38% |
Housing density: 263 houses/condos per square mile
Median price asked for vacant for-sale houses and condos in 2022 in this county: $509,684.
Median contract rent in 2022: $1,157 (lower quartile is $869, upper quartile is $1,462)
Median rent asked for vacant for-rent units in 2022: $1,396
Median gross rent in Swansea, MA in 2022: $1,235
Housing units in Swansea with a mortgage: 3,227 (229 second mortgage, 498 home equity loan, 9 both second mortgage and home equity loan)
Houses without a mortgage: 1,418


Latest news about housing in Swansea, MA collected exclusively by city-data.com from local newspapers, TV, and radio stations

 | How Much Massachusetts Households Make Per Year: Census Data (37 replies) |
| Cars in MA (789 replies) |
| Swansea Mall (the whole thing - not just a store) Closing March 31, 2019 (44 replies) |
| Taunton: Silver City Galleria will be losing JC Penney in April (94 replies) |
| Town in Massachusetts You’d Least Like To Live In? (179 replies) |
| How is Swansea for young family- schools/culture? (20 replies) |

Household type by relationship:
Households: 532,417- In family households: 444,740 (93,440 male householders, 47,898 female householders)
101,208 spouses, 160,791 children (151,812 natural, 3,293 adopted, 5,686 stepchildren), 9,612 grandchildren, 4,550 brothers or sisters, 5,590 parents, foster children, 4,929 other relatives, 12,847 non-relatives
- In nonfamily households: 87,677 (32,955 male householders (25,495 living alone)), 38,717 female householders (32,941 living alone)), 16,005 nonrelatives
- In group quarters: 15,868 (6,219 institutionalized population)
88,038 married couples with children.
33,142 single-parent households (5,908 men, 27,234 women).
84.9% of residents of Swansea speak English at home.
0.8% of residents speak Spanish at home (54% speak English very well, 40% speak English well, 6% speak English not well).
13.4% of residents speak other Indo-European language at home (67% speak English very well, 17% speak English well, 13% speak English not well, 3% don't speak English at all).
0.7% of residents speak Asian or Pacific Island language at home (49% speak English very well, 36% speak English well, 8% speak English not well, 7% don't speak English at all).
0.2% of residents speak other language at home (59% speak English very well, 41% speak English well).
Foreign born population: 1,642 (9.5%)
(71.2% of them are naturalized citizens)
| Here: | 6.4 |
| State: | 6.5 |
| Here: | 3.3 |
| State: | 4.0 |

- Bedrooms in owner-occupied houses and condos in Swansea, Massachusetts
- 13no bedroom
- 1541 bedroom
- 1,0452 bedrooms
- 2,8943 bedrooms
- 8054 bedrooms
- 835+ bedrooms

- Bedrooms in renter-occupied apartments in Swansea, Massachusetts
- 14no bedroom
- 3841 bedroom
- 3332 bedrooms
- 1233 bedrooms
- 404 bedrooms
- 05+ bedrooms

- Cars and other vehicles available in Swansea in owner-occupied houses/condos
- 167no vehicle
- 1,2311 vehicle
- 2,3192 vehicles
- 9473 vehicles
- 2314 vehicles
- 995+ vehicles

- Cars and other vehicles available in Swansea in renter-occupied apartments
- 96no vehicle
- 4621 vehicle
- 2632 vehicles
- 563 vehicles
- 174 vehicles
- 05+ vehicles

- Rooms in owner-occupied houses in Swansea, Massachusetts
- 01 room
- 192 rooms
- 773 rooms
- 4334 rooms
- 1,1305 rooms
- 1,3896 rooms
- 9577 rooms
- 5298 rooms
- 4609+ rooms

- Rooms in renter-occupied apartments in Swansea, Massachusetts
- 01 room
- 1812 rooms
- 2253 rooms
- 1924 rooms
- 1365 rooms
- 866 rooms
- 437 rooms
- 168 rooms
- 159+ rooms


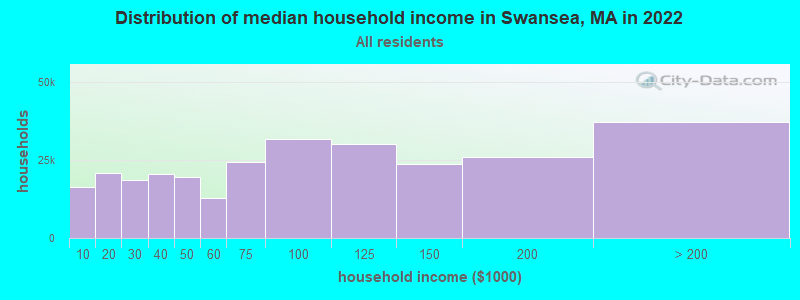
Swansea, MA household income distribution

- 16,426Less than $10,000
- 20,643$10,000 to $19,999
- 18,576$20,000 to $29,999
- 20,618$30,000 to $39,999
- 19,393$40,000 to $49,999
- 12,867$50,000 to $59,999
- 24,249$60,000 to $74,999
- 31,729$75,000 to $99,999
- 30,112$100,000 to $124,999
- 23,818$125,000 to $149,999
- 26,046$150,000 to $199,999
- 37,119$200,000 or more
Percentage of workers working in this county: 67.0%
Number of people working at home: 1,102 (11.5% of all workers)
Travel time to work (commute)
- Less than 5 minutes: 178
- 5 to 9 minutes: 894
- 10 to 14 minutes: 1,581
- 15 to 19 minutes: 1,538
- 20 to 24 minutes: 1,121
- 25 to 29 minutes: 490
- 30 to 34 minutes: 818
- 35 to 39 minutes: 261
- 40 to 44 minutes: 193
- 45 to 59 minutes: 461
- 60 to 89 minutes: 337
- 90 or more minutes: 211
Means of transportation to work:
- Drove a car alone: 7,179 (87.4%)
- Carpooled: 823 (10.0%)
- Bus or trolley bus: 11 (0.1%)
- Streetcar or trolley car: 8 (0.1%)
- Motorcycle: 10 (0.1%)
- Walked: 24 (0.3%)
- Other means: 28 (0.3%)
- Worked at home: 130 (1.6%)


- Year of entry for the foreign-born population in Swansea, Massachusetts
- 391995 to March 2000
- 211990 to 1994
- 711985 to 1989
- 831980 to 1984
- 2701975 to 1979
- 2471970 to 1974
- 2651965 to 1969
- 298Before 1965
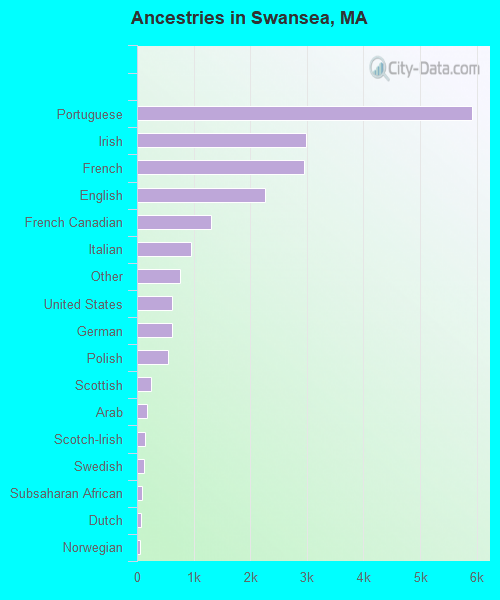
First ancestries reported:
- Portuguese: 5,922 (29.7%)
- Irish: 2,980 (14.9%)
- French: 2,956 (14.8%)
- English: 2,259 (11.3%)
- French Canadian: 1,299 (6.5%)
- Italian: 956 (4.8%)
- Other: 762 (3.8%)
- United States: 620 (3.1%)
- German: 618 (3.1%)
- Polish: 540 (2.7%)
- Scottish: 240 (1.2%)
- Arab: 183 (0.9%)
- Scotch-Irish: 144 (0.7%)
- Swedish: 127 (0.6%)
- Subsaharan African: 89 (0.4%)
- Dutch: 66 (0.3%)
- Norwegian: 59 (0.3%)
- Ukrainian: 35 (0.2%)
- Welsh: 31 (0.2%)
- Danish: 30 (0.2%)
- Russian: 23 (0.1%)
- West Indian: 12 (0.06%)
- Swiss: 8 (0.04%)
- Czech: 7 (0.04%)
Most common places of birth for foreign-born residents (%):
| Swansea: | 72.9% (943) |
| Massachusetts: | 8.6% (66,627) |
| Swansea: | 4.1% (53) |
| Massachusetts: | 3.3% (25,403) |
| Swansea: | 3.6% (46) |
| Massachusetts: | 1.8% (13,801) |
| Swansea: | 3.3% (43) |
| Massachusetts: | 5.2% (40,247) |
| Swansea: | 2.2% (29) |
| Massachusetts: | 2.6% (20,299) |
| Swansea: | 2.2% (28) |
| Massachusetts: | 1.9% (14,883) |
| Swansea: | 1.8% (23) |
| Massachusetts: | 5.1% (39,255) |
Place of birth for U.S.-born residents:
- This state: 11,221
- Other state: 3,287
- Northeast: 2,801
- Midwest: 190
- South: 199
- West: 97
71% of Swansea residents lived in the same house 5 years ago.
Out of people who lived in different houses, 77% lived in this county.
Out of people who lived in different counties, 27% lived in Massachusetts.
Education attainment for males 25 years and older:
- No schooling: 98
- Nursery to 4th grade: 93
- 5th and 6th grade: 71
- 7th and 8th grade: 221
- 9th grade: 196
- 10th grade: 227
- 11th grade: 117
- 12th grade, no diploma: 230
- High school graduate (or equivalency): 1,883
- Less than 1 year of college: 294
- Some college more than 1 year, no degree: 539
- Associate degree: 387
- Bachelor's degree: 732
- Master's degree: 227
- Professional school degree: 49
- Doctorate degree: 0

Education attainment for females 25 years and older:
- No schooling: 79
- Nursery to 4th grade: 77
- 5th and 6th grade: 76
- 7th and 8th grade: 246
- 9th grade: 230
- 10th grade: 313
- 11th grade: 119
- 12th grade, no diploma: 276
- High school graduate (or equivalency): 2,012
- Less than 1 year of college: 399
- Some college more than 1 year, no degree: 627
- Associate degree: 510
- Bachelor's degree: 633
- Master's degree: 293
- Professional school degree: 52
- Doctorate degree: 0


Housing units in structures:
- One, detached: 5,365
- One, attached: 62
- Two: 292
- 3 or 4: 83
- 5 to 9: 94
- 10 to 19: 11
- 20 to 49: 125
- 50 or more: 30
- Mobile homes: 8
Median worth of mobile homes: $481,366
Housing units lacking complete kitchen facilities: 0.6%

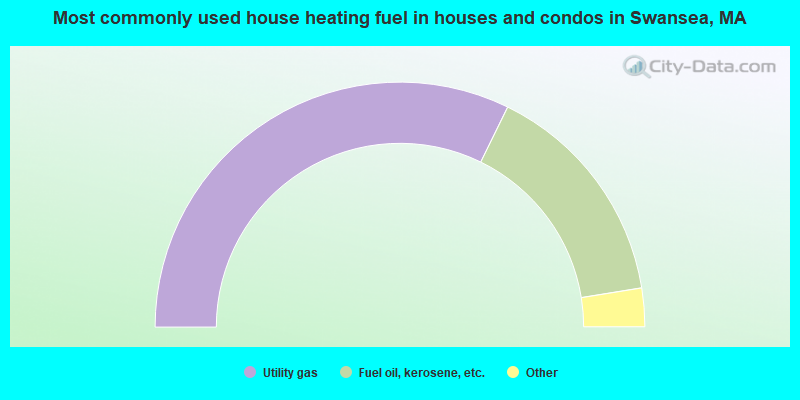
- 64.5%Utility gas
- 30.4%Fuel oil, kerosene, etc.
- 2.6%Electricity
- 1.4%Bottled, tank, or LP gas
- 0.9%Wood
- 0.2%No fuel used
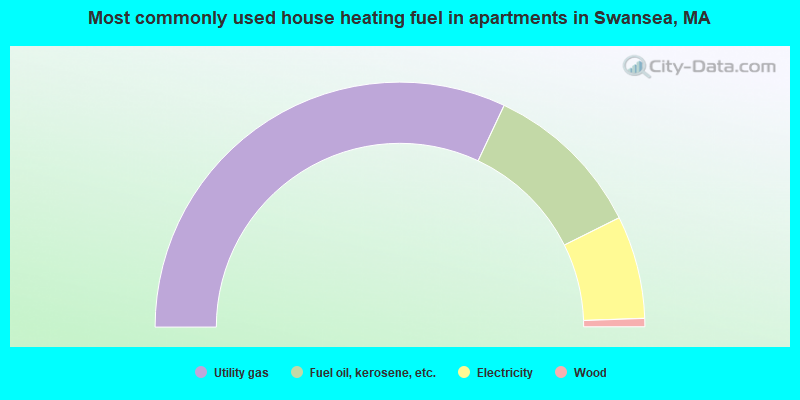
- 64.0%Utility gas
- 21.3%Fuel oil, kerosene, etc.
- 13.6%Electricity
- 1.1%Wood
Private vs. public school enrollment:
| Here: | 7.7% |
| Massachusetts: | 10.8% |
| Here: | 13.5% |
| Massachusetts: | 12.2% |
| Here: | 21.1% |
| Massachusetts: | 48.2% |


