Susanville, CA (California) Houses and Residents
| Susanville: | $220,536 |
| California: | $715,900 |
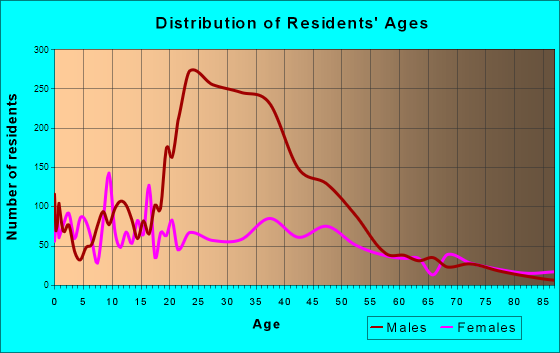
Total population: 15,543 (Urban population: 13,509 (all inside urban clusters), Rural population: 65 (all nonfarm))
Houses: 4,241 (3,495 occupied: 1,899 owner occupied, 1,607 renter occupied)
| % of renters here: | 46% |
| State: | 44% |
Housing density: 719 houses/condos per square mile
Median price asked for vacant for-sale houses and condos in 2022: $211,779.
Median contract rent in 2022: $768 (lower quartile is $559, upper quartile is $1,140)
Median rent asked for vacant for-rent units in 2022: $4,563
Median gross rent in Susanville, CA in 2022: $924
Housing units in Susanville with a mortgage: 1,100 (75 second mortgage, 2 home equity loan, 56 both second mortgage and home equity loan)
Houses without a mortgage: 10
Median household income for houses/condos with a mortgage: $101,726
Median household income for apartments without a mortgage: $38,706
Median monthly housing costs: $957
Compare current foreclosures near Susanville, CA:
| Photo | Address | Area | Beds / Baths | Price | Details |
|---|---|---|---|---|---|

|
#1
Johnstonville Rd
Susanville, CA 96130
|
- sq. feet
|
1 baths 2 beds |
show details | |

|
#2
-285 Lassen Way
Susanville, CA 96130
|
1,528 sq. feet
|
2 baths 3 beds |
show details | |

|
#3
Bunyan Rd
Susanville, CA 96130
|
1,774 sq. feet
|
2 baths 3 beds |
show details | |

|
#4
Way
Susanville, CA 96130
|
- sq. feet
|
- baths - beds |
$6,310
|
show details |

|
#5
Monrovia St
Susanville, CA 96130
|
1,700 sq. feet
|
1 baths 4 beds |
show details | |

|
#6
Pearl Cir
Susanville, CA 96130
|
1,965 sq. feet
|
2 baths 4 beds |
show details | |

|
#7
Bangham Ln
Susanville, CA 96130
|
1,544 sq. feet
|
- baths - beds |
show details | |

|
#8
Spruce St
Susanville, CA 96130
|
- sq. feet
|
- baths - beds |
show details | |

|
#9
Tulip Way
Susanville, CA 96130
|
- sq. feet
|
- baths - beds |
show details | |

|
#10
Hill Creek Rd
Susanville, CA 96130
|
- sq. feet
|
- baths - beds |
show details |
| Photo | Address | Area | Beds / Baths | Price | Details |
|---|---|---|---|---|---|

|
#11
Chestnut St
Susanville, CA 96130
|
- sq. feet
|
- baths - beds |
show details | |

|
#12
Hobo Camp Rd
Susanville, CA 96130
|
- sq. feet
|
- baths - beds |
show details | |

|
#13
545 Bangham Lane
Susanville, CA 96130
|
- sq. feet
|
- baths - beds |
show details | |

|
#14
Coyote Ln
Susanville, CA 96130
|
- sq. feet
|
- baths - beds |
show details | |

|
#15
550 Juniper Ridge Rd
Litchfield, CA 96117
|
1,352 sq. feet
|
2 baths 3 beds |
$193,000
|
show details |

|
#16
Lassen Way
Susanville, CA 96130
|
- sq. feet
|
- baths - beds |
show details | |

|
#17
-038 Rio Dosa Dr
Janesville, CA 96114
|
- sq. feet
|
2 baths 4 beds |
show details | |

|
#18
Hyatt Ln
Janesville, CA 96114
|
- sq. feet
|
- baths - beds |
show details | |

|
#19
Hyatt Ln
Janesville, CA 96114
|
- sq. feet
|
- baths - beds |
show details | |

|
Check over 1 million property listings on Foreclosure.com!
|
browse all offers | |||

Latest news about housing in Susanville, CA collected exclusively by city-data.com from local newspapers, TV, and radio stations

 | I Need To Rent A Small House in CA for $600.00/Month! (44 replies) |
| Susanville, Herlong Army depot (9 replies) |
| Possibly Moving to the Susanville, CA Area...Advice? (28 replies) |
| Prop 13 (megatopic) (1358 replies) |
| But, but... what happened to the people leaving "in droves?" (689 replies) |
| Is Northern California receiving a big influx of remote workers? (29 replies) |
Median year apartment built: 1976
Household type by relationship:
Households: 15,606- Male householders: 1,877 (450 living alone), Female householders: 1,541 (694 living alone)
1,591 spouses (1,567 opposite-sex spouses), 234 unmarried partners, (227 opposite-sex unmarried partners), 2,747 children (2,571 natural, 19 adopted, 155 stepchildren), 149 grandchildren, 81 brothers or sisters, 56 parents, 96 foster children, 112 other relatives, 459 non-relatives
- In group quarters: 6,660
Size of family households: 982 2-persons, 537 3-persons, 235 4-persons, 208 5-persons, 66 6-persons, 58 7-or-more-persons.
Size of nonfamily households: 1,197 1-person, 226 2-persons, 17 3-persons.
1,481 married couples with children.
592 single-parent households (155 men, 437 women).
74.9% of residents of Susanville speak English at home.
20.3% of residents speak Spanish at home (60% speak English very well, 33% speak English well, 5% speak English not well, 2% don't speak English at all).
0.7% of residents speak other Indo-European language at home (79% speak English very well, 6% speak English well, 16% speak English not well).
2.9% of residents speak Asian or Pacific Island language at home (65% speak English very well, 32% speak English well, 2% speak English not well).
0.4% of residents speak other language at home (97% speak English very well, 3% speak English not well).
Foreign born population: 864 (5.5%)
(25.9% of them are naturalized citizens)
| Here: | 5.5 |
| State: | 6.0 |
| Here: | 4.0 |
| State: | 3.9 |

- Bedrooms in owner-occupied houses and condos in Susanville, California
- 5no bedroom
- 131 bedroom
- 4922 bedrooms
- 1,0563 bedrooms
- 2654 bedrooms
- 695+ bedrooms

- Bedrooms in renter-occupied apartments in Susanville, California
- 82no bedroom
- 4001 bedroom
- 6832 bedrooms
- 3533 bedrooms
- 904 bedrooms
- 05+ bedrooms

- Cars and other vehicles available in Susanville in owner-occupied houses/condos
- 68no vehicle
- 5111 vehicle
- 7212 vehicles
- 4073 vehicles
- 884 vehicles
- 1055+ vehicles

- Cars and other vehicles available in Susanville in renter-occupied apartments
- 248no vehicle
- 6961 vehicle
- 5502 vehicles
- 803 vehicles
- 344 vehicles
- 05+ vehicles

- Rooms in owner-occupied houses in Susanville, California
- 01 room
- 02 rooms
- 513 rooms
- 3394 rooms
- 5405 rooms
- 5116 rooms
- 1327 rooms
- 1178 rooms
- 2109+ rooms

- Rooms in renter-occupied apartments in Susanville, California
- 821 room
- 1112 rooms
- 3273 rooms
- 5674 rooms
- 2305 rooms
- 1086 rooms
- 527 rooms
- 788 rooms
- 539+ rooms


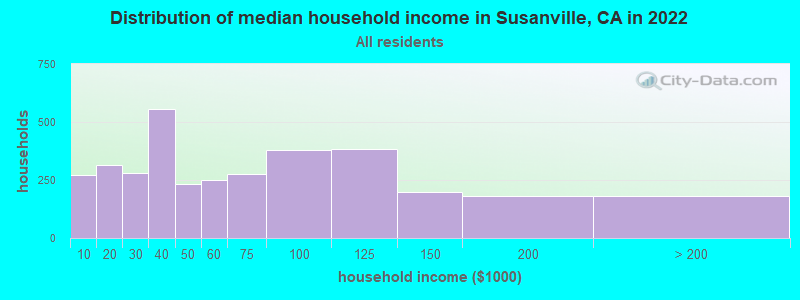
Susanville, CA household income distribution

- 270Less than $10,000
- 314$10,000 to $19,999
- 282$20,000 to $29,999
- 557$30,000 to $39,999
- 233$40,000 to $49,999
- 249$50,000 to $59,999
- 276$60,000 to $74,999
- 381$75,000 to $99,999
- 383$100,000 to $124,999
- 197$125,000 to $149,999
- 180$150,000 to $199,999
- 179$200,000 or more
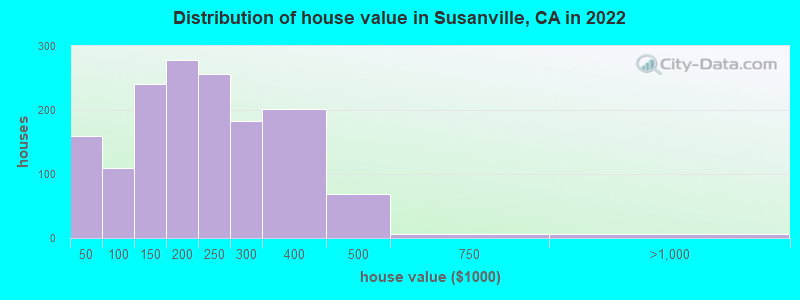
Home value of owner - occupied houses in 2022 in Susanville, CA
-
- 87Less than $10,000
- 4$10,000 to $14,999
- 53$15,000 to $19,999
- 1$30,000 to $34,999
- 12$35,000 to $39,999
- 63$50,000 to $59,999
- 3$60,000 to $69,999
- 1$70,000 to $79,999
- 20$80,000 to $89,999
- 20$90,000 to $99,999
- 121$100,000 to $124,999
- 119$125,000 to $149,999
- 174$150,000 to $174,999
- 103$175,000 to $199,999
- 256$200,000 to $249,999
- 182$250,000 to $299,999
- 201$300,000 to $399,999
- 67$400,000 to $499,999
- 7$500,000 to $749,999
- 5$750,000 to $999,999
Rent paid by renters in 2022 in Susanville, CA
-
- 2Less than $100
- 9$100 to $149
- 121$150 to $199
- 43$200 to $249
- 45$250 to $299
- 77$300 to $349
- 2$350 to $399
- 22$400 to $449
- 13$450 to $499
- 73$500 to $549
- 43$550 to $599
- 72$600 to $649
- 28$650 to $699
- 204$700 to $749
- 122$750 to $799
- 56$800 to $899
- 111$900 to $999
- 175$1,000 to $1,249
- 83$1,250 to $1,499
- 150$1,500 to $1,999
- 28$2,000 to $2,499
- 29$3,500 or more
- 89No cash rent


Percentage of workers working in this county: 100.3%
Number of people working at home: 113 (2.9% of all workers)
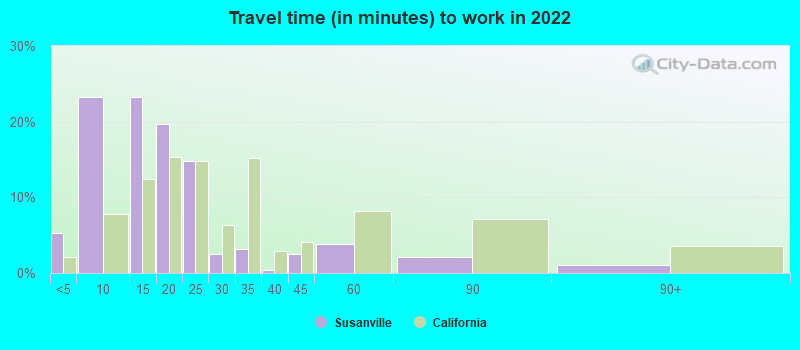
Travel time to work (commute)
- Less than 5 minutes: 244
- 5 to 9 minutes: 919
- 10 to 14 minutes: 840
- 15 to 19 minutes: 724
- 20 to 24 minutes: 461
- 25 to 29 minutes: 31
- 30 to 34 minutes: 160
- 35 to 39 minutes: 0
- 40 to 44 minutes: 41
- 45 to 59 minutes: 142
- 60 to 89 minutes: 134
- 90 or more minutes: 67
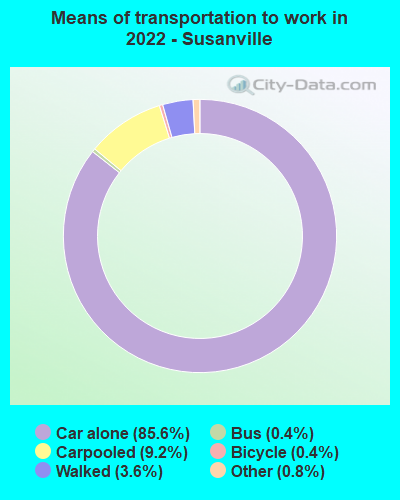
Means of transportation to work:
- Drove a car alone: 4,148 (80.5%)
- Carpooled: 477 (9.3%)
- Bus: 16 (0.3%)
- Taxi: 41 (0.8%)
- Bicycle: 21 (0.4%)
- Walked: 183 (3.6%)
- Worked at home: 113 (2.2%)

- Unemployment by race in 2022
- Unemployment rate for White non-Hispanic residents
- 6.0%Males
- 4.5%Females
- Unemployment rate for American Indian and Alaska Native residents
- 6.6%Males
- 28.5%Females
- Unemployment rate for Asian residents
- 7.5%Males
- Unemployment rate for other race residents
- 16.2%Females
- Unemployment rate for two or more race residents
- 1.6%Females
- Unemployment rate for Hispanic or Latino residents
- 13.9%Females

- Year of entry for the foreign-born population in Susanville, California
- 1772010 or later
- 2642000 to 2009
- 1611990 to 1999
- 411980 to 1989
- 111970 to 1979
- 112Before 1970

First ancestries reported:
- German: 382 (3.7%)
- American: 362 (3.5%)
- English: 223 (2.2%)
- Irish: 194 (1.9%)
- Italian: 189 (1.8%)
- European: 91 (0.9%)
- French: 80 (0.8%)
- Scottish: 77 (0.8%)
- Polish: 76 (0.7%)
- Basque: 64 (0.6%)
- Portuguese: 59 (0.6%)
- Dutch: 52 (0.5%)
- Danish: 46 (0.4%)
- Austrian: 37 (0.4%)
- Swedish: 29 (0.3%)
- British: 25 (0.2%)
- Icelander: 24 (0.2%)
- African: 24 (0.2%)
- Russian: 23 (0.2%)
- Finnish: 20 (0.2%)
- Swiss: 12 (0.1%)
- Australian: 11 (0.1%)
- Canadian: 11 (0.1%)
- Serbian: 11 (0.1%)
- Syrian: 10 (0.10%)
- Norwegian: 10 (0.10%)
- Armenian: 9 (0.09%)
- Scotch-Irish: 8 (0.08%)
- Lebanese: 4 (0.04%)
- Scandinavian: 4 (0.04%)
- Romanian: 2 (0.02%)
Most common places of birth for foreign-born residents (%):
| Susanville: | 50.6% (437) |
| California: | 37.2% (3,881,193) |
| Susanville: | 11.1% (96) |
| California: | 4.2% (440,287) |
| Susanville: | 10.5% (91) |
| California: | 0.0% (1,444) |
| Susanville: | 5.9% (51) |
| California: | 7.8% (818,297) |
| Susanville: | 3.4% (29) |
| California: | 0.3% (35,557) |
| Susanville: | 3.2% (28) |
| California: | 0.2% (20,614) |
| Susanville: | 2.7% (23) |
| California: | 4.9% (512,335) |
| Susanville: | 1.9% (16) |
| California: | 0.3% (31,439) |
Place of birth for U.S.-born residents:
- This state: 11,939
- Other state: 2,613
- Northeast: 268
- Midwest: 435
- South: 474
- West: 1,423
74.3% of Susanville residents lived in the same house 1 years ago.
Out of people who lived in different houses, 20.0% lived in this county.
Out of people who lived in different counties, 90.1% lived in California.
| Susanville: | 74.3% |
| State average: | 88.9% |
Education attainment for males 25 years and older:
- No schooling: 151
- Nursery to 4th grade: 186
- 5th and 6th grade: 129
- 7th and 8th grade: 229
- 9th grade: 348
- 10th grade: 307
- 11th grade: 967
- 12th grade, no diploma: 535
- High school graduate (or equivalency): 3,184
- Less than 1 year of college: 685
- Some college more than 1 year, no degree: 874
- Associate degree: 412
- Bachelor's degree: 284
- Master's degree: 75
- Professional school degree: 36
- Doctorate degree: 7

Education attainment for females 25 years and older:
- No schooling: 44
- Nursery to 4th grade: 0
- 5th and 6th grade: 19
- 7th and 8th grade: 23
- 9th grade: 17
- 10th grade: 62
- 11th grade: 10
- 12th grade, no diploma: 34
- High school graduate (or equivalency): 830
- Less than 1 year of college: 559
- Some college more than 1 year, no degree: 500
- Associate degree: 374
- Bachelor's degree: 469
- Master's degree: 96
- Professional school degree: 7
- Doctorate degree: 11


Housing units in structures:
- One, detached: 2,996
- One, attached: 58
- Two: 149
- 3 or 4: 266
- 5 to 9: 154
- 10 to 19: 155
- 20 to 49: 57
- 50 or more: 207
- Mobile homes: 195
Housing units lacking complete kitchen facilities in 2022: 4.2%
House/condo owner moved in on average 11 years ago
Renter moved in on average 5 years ago

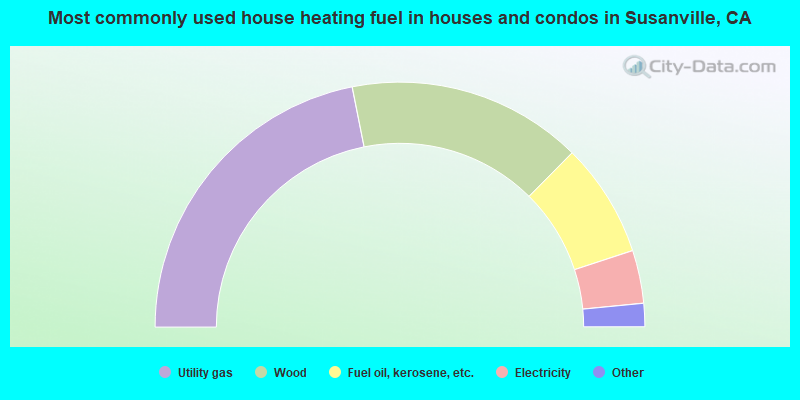
- 43.8%Utility gas
- 31.1%Wood
- 15.1%Fuel oil, kerosene, etc.
- 7.0%Electricity
- 1.9%Other fuel
- 1.0%Bottled, tank, or LP gas
- 0.2%No fuel used
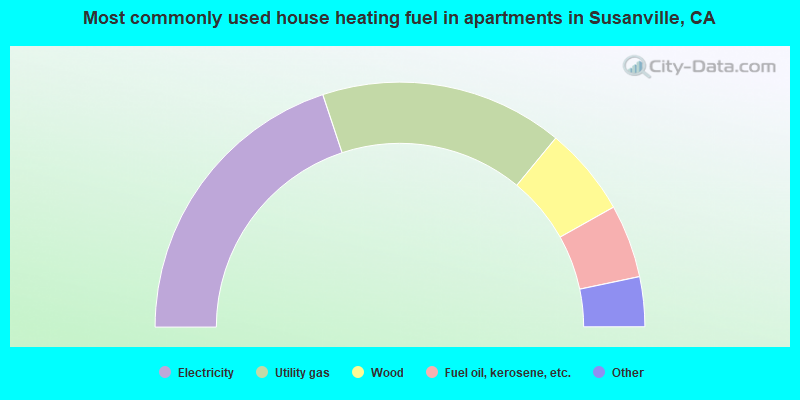
- 39.9%Electricity
- 32.2%Utility gas
- 11.8%Wood
- 9.7%Fuel oil, kerosene, etc.
- 2.5%Bottled, tank, or LP gas
- 2.3%Other fuel
- 1.5%No fuel used
- 0.2%Solar energy
Private vs. public school enrollment:
| Here: | 9.3% |
| California: | 10.5% |
| Here: | 18.3% |
| California: | 8.5% |
| Here: | 24.0% |
| California: | 15.9% |


