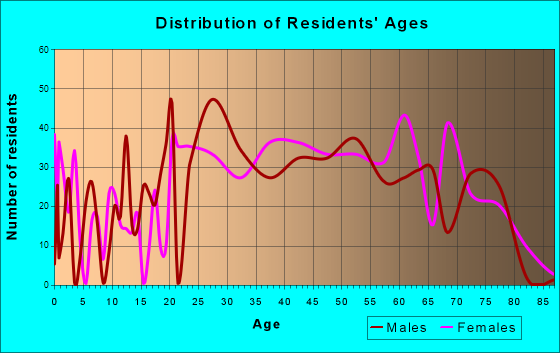
Surfside Beach, SC (South Carolina) Houses and Residents
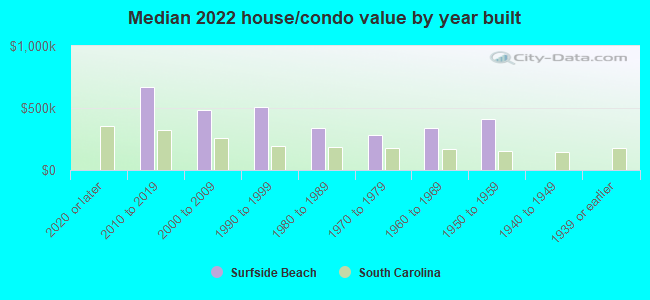
| Surfside Beach: | $443,456 |
| South Carolina: | $254,600 |
Mean price in 2022:
Detached houses: $398,336
Here: $398,336 State: $368,255 Townhouses or other attached units: $232,689
Here: $232,689 State: $292,023 In 2-unit structures: $378,404
Here: $378,404 State: $358,283 In 3-to-4-unit structures: $228,502
Here: $228,502 State: $230,702 In 5-or-more-unit structures: $238,982
Here: $238,982 State: $326,361 Mobile homes: $272,479
Here: $272,479 State: $102,531
Total population: 4,187 (All urban)
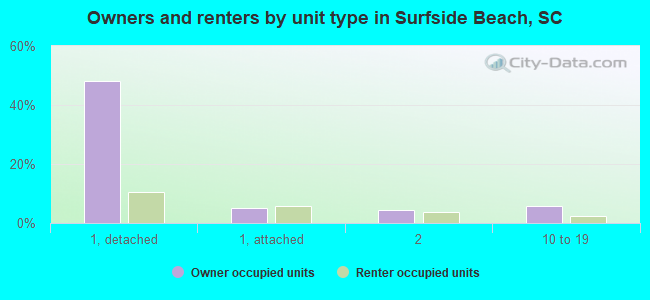
Houses: 4,484 (2,020 occupied: 1,338 owner occupied, 850 renter occupied)
| % of renters here: | 39% |
| State: | 28% |
Housing density: 2,318 houses/condos per square mile
Median price asked for vacant for-sale houses and condos in 2022: $1,398,822.
Median contract rent in 2022: $1,149 (lower quartile is $946, upper quartile is $1,449)
Median rent asked for vacant for-rent units in 2022: $2,168
Median gross rent in Surfside Beach, SC in 2022: $1,296
Housing units in Surfside Beach with a mortgage: 625 (35 second mortgage, 0 home equity loan, 39 both second mortgage and home equity loan)
Houses without a mortgage: 30
Median household income for houses/condos with a mortgage: $96,807
Median household income for apartments without a mortgage: $67,651
Median monthly housing costs: $1,096
Compare current foreclosures near Surfside Beach, SC:
| Photo | Address | Area | Beds / Baths | Price | Details |
|---|---|---|---|---|---|

|
#1
Hitchcock Way Apt 836
Myrtle Beach, SC 29577
|
1,211 sq. feet
|
2 baths 3 beds |
show details | |

|
#2
River Oaks Dr Unit 3a
Myrtle Beach, SC 29579
|
606 sq. feet
|
1 baths 1 beds |
show details | |

|
#3
Highway 65
Conway, SC 29526
|
- sq. feet
|
2 baths 4 beds |
show details | |

|
#4
Weldon Ln
Conway, SC 29526
|
1,421 sq. feet
|
2 baths 3 beds |
show details | |

|
#5
13th Ave S
Myrtle Beach, SC 29577
|
1,811 sq. feet
|
2 baths 3 beds |
show details | |

|
#6
Hunters Trl
Myrtle Beach, SC 29588
|
1,602 sq. feet
|
2 baths 3 beds |
show details | |

|
#7
Gulfstream Ct
Myrtle Beach, SC 29575
|
1,394 sq. feet
|
3 baths 3 beds |
show details | |

|
#8
Antler Ridge Cv
Myrtle Beach, SC 29588
|
1,554 sq. feet
|
2 baths 3 beds |
show details | |

|
#9
Overcrest St
Myrtle Beach, SC 29579
|
1,856 sq. feet
|
2 baths 4 beds |
show details | |

|
#10
Waterway Village Blvd Apt 15a
Myrtle Beach, SC 29579
|
894 sq. feet
|
2 baths 2 beds |
show details |
| Photo | Address | Area | Beds / Baths | Price | Details |
|---|---|---|---|---|---|

|
#11
Waterway Village Blvd Apt 18b
Myrtle Beach, SC 29579
|
894 sq. feet
|
2 baths 2 beds |
show details | |

|
#12
Hunting Bow Trl
Myrtle Beach, SC 29579
|
1,416 sq. feet
|
2 baths 3 beds |
show details | |

|
#13
Hunters Trl
Myrtle Beach, SC 29588
|
2,350 sq. feet
|
2 baths 3 beds |
show details | |

|
#14
Ambrosia Loop
Myrtle Beach, SC 29579
|
1,464 sq. feet
|
2 baths 3 beds |
show details | |

|
#15
Ambrosia Loop
Myrtle Beach, SC 29579
|
1,452 sq. feet
|
2 baths 3 beds |
show details | |

|
#16
Corn Pile Rd
Myrtle Beach, SC 29588
|
1,482 sq. feet
|
2 baths 3 beds |
show details | |

|
#17
Oak St
Conway, SC 29526
|
1,386 sq. feet
|
2 baths 3 beds |
show details | |

|
#18
Eagle Terrace Ct
Myrtle Beach, SC 29579
|
1,066 sq. feet
|
2 baths 3 beds |
show details | |

|
#19
Arundel Rd
Myrtle Beach, SC 29577
|
2,472 sq. feet
|
2 baths 3 beds |
show details | |

|
#20
Sea Turtle Dr
Myrtle Beach, SC 29588
|
1,747 sq. feet
|
2 baths 3 beds |
show details |
| Photo | Address | Area | Beds / Baths | Price | Details |
|---|---|---|---|---|---|

|
#21
Sea Turtle Dr
Myrtle Beach, SC 29588
|
2,096 sq. feet
|
3 baths 3 beds |
show details | |

|
#22
Timmerman Rd
Myrtle Beach, SC 29588
|
2,747 sq. feet
|
2 baths 5 beds |
show details | |

|
#23
Delta Cir
Myrtle Beach, SC 29577
|
1,662 sq. feet
|
2 baths 3 beds |
show details | |

|
#24
Willowbend Dr
Murrells Inlet, SC 29576
|
1,634 sq. feet
|
2 baths 3 beds |
show details | |

|
#25
Viking Dr
Myrtle Beach, SC 29577
|
2,198 sq. feet
|
2 baths 3 beds |
show details | |

|
#26
Whaler Harbour
Myrtle Beach, SC 29577
|
1,305 sq. feet
|
2 baths 3 beds |
show details | |

|
#27
Fairwood Ter
Myrtle Beach, SC 29588
|
1,264 sq. feet
|
2 baths 3 beds |
show details | |

|
#28
Stonebrook Dr
Myrtle Beach, SC 29588
|
1,128 sq. feet
|
2 baths 3 beds |
show details | |

|
#29
Highland Ridge Dr
Myrtle Beach, SC 29588
|
1,776 sq. feet
|
2 baths 3 beds |
show details | |

|
#30
3rd Ave S
Myrtle Beach, SC 29577
|
1,368 sq. feet
|
1 baths 3 beds |
show details |
| Photo | Address | Area | Beds / Baths | Price | Details |
|---|---|---|---|---|---|

|
#31
Abingdon Dr
Myrtle Beach, SC 29579
|
2,414 sq. feet
|
2 baths 3 beds |
show details | |

|
#32
Isabel Ct
Myrtle Beach, SC 29579
|
1,478 sq. feet
|
2 baths 3 beds |
show details | |

|
#33
Barn Owl Ct
Myrtle Beach, SC 29579
|
1,582 sq. feet
|
3 baths 3 beds |
show details | |

|
#34
Old Augusta Dr
Pawleys Island, SC 29585
|
2,320 sq. feet
|
3 baths 3 beds |
show details | |

|
#35
Maple Ave
Conway, SC 29527
|
1,075 sq. feet
|
1 baths 3 beds |
show details | |

|
#36
Cameron Ct
Pawleys Island, SC 29585
|
4,178 sq. feet
|
4 baths 4 beds |
show details | |

|
#37
Wildhorse Dr
Conway, SC 29526
|
2,676 sq. feet
|
4 baths 4 beds |
show details | |

|
#38
Woodlawn Dr
Conway, SC 29526
|
1,724 sq. feet
|
2 baths 3 beds |
show details | |

|
#39
Waccamaw Dr
Conway, SC 29526
|
1,296 sq. feet
|
1 baths 3 beds |
show details | |

|
#40
Old Highway 90
Conway, SC 29526
|
1,020 sq. feet
|
1 baths 3 beds |
show details |
| Photo | Address | Area | Beds / Baths | Price | Details |
|---|---|---|---|---|---|

|
#41
Weldon Ln
Conway, SC 29526
|
1,421 sq. feet
|
2 baths 3 beds |
show details | |

|
#42
Kimba Ln
Pawleys Island, SC 29585
|
2,280 sq. feet
|
4 baths 5 beds |
show details | |

|
#43
Coteswood Dr
Myrtle Beach, SC 29572
|
1,620 sq. feet
|
1 baths 3 beds |
show details | |

|
#44
Southern Trl
Myrtle Beach, SC 29579
|
1,956 sq. feet
|
2 baths 3 beds |
show details | |

|
#45
Bellegrove Dr
Myrtle Beach, SC 29579
|
1,410 sq. feet
|
2 baths 3 beds |
show details | |

|
#46
Olde Towne Way Unit 2
Myrtle Beach, SC 29588
|
1,520 sq. feet
|
3 baths 3 beds |
show details | |

|
#47
Weeping Willow Dr
Myrtle Beach, SC 29579
|
2,239 sq. feet
|
2 baths 3 beds |
show details | |

|
#48
Blackwolf Dr
Myrtle Beach, SC 29579
|
1,582 sq. feet
|
2 baths 3 beds |
show details | |

|
#49
Cheticamp Ct
Conway, SC 29527
|
1,322 sq. feet
|
2 baths 3 beds |
show details | |

|
Check over 1 million property listings on Foreclosure.com!
|
browse all offers | |||


Median year apartment built: 1985
Household type by relationship:
Households: 4,489- Male householders: 1,050 (333 living alone), Female householders: 1,014 (312 living alone)
1,013 spouses (1,013 opposite-sex spouses), 161 unmarried partners, (161 opposite-sex unmarried partners), 879 children (776 natural, 59 adopted, 44 stepchildren), 122 grandchildren, 26 brothers or sisters, 39 parents, 0 foster children, 94 other relatives, 87 non-relatives
Size of family households: 1,009 2-persons, 258 3-persons, 58 4-persons, 78 5-persons, 19 6-persons.
Size of nonfamily households: 650 1-person, 157 2-persons.
294 married couples with children.
168 single-parent households (0 men, 168 women).
98.5% of residents of Surfside Beach speak English at home.
0.7% of residents speak Spanish at home (100% speak English very well).
0.7% of residents speak other Indo-European language at home (100% speak English very well).
0.5% of residents speak Asian or Pacific Island language at home (100% speak English very well).
Foreign born population: 108 (2.4%)
(71.3% of them are naturalized citizens)
| Here: | 6.0 |
| State: | 6.4 |
| Here: | 4.6 |
| State: | 4.5 |
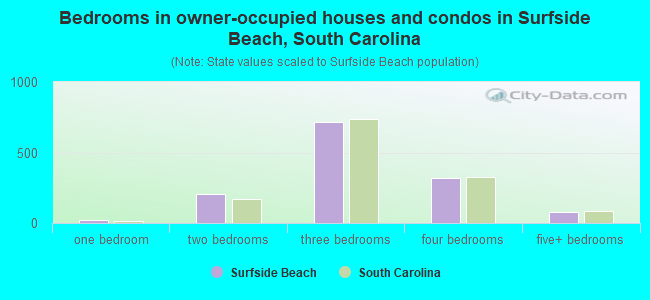
- Bedrooms in owner-occupied houses and condos in Surfside Beach, South Carolina
- 0no bedroom
- 221 bedroom
- 2052 bedrooms
- 7193 bedrooms
- 3184 bedrooms
- 755+ bedrooms
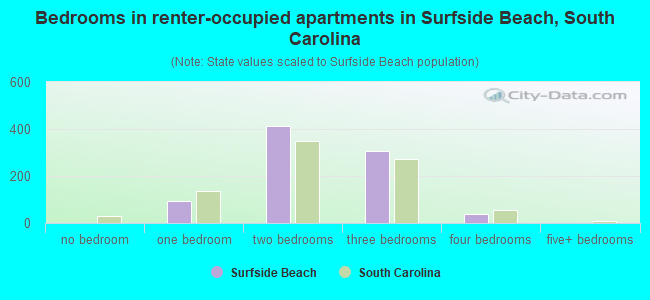
- Bedrooms in renter-occupied apartments in Surfside Beach, South Carolina
- 0no bedroom
- 951 bedroom
- 4112 bedrooms
- 3053 bedrooms
- 404 bedrooms
- 05+ bedrooms
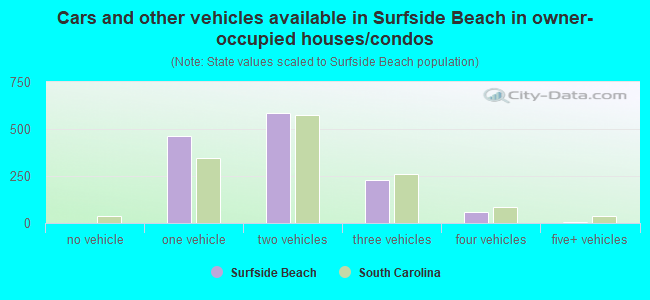
- Cars and other vehicles available in Surfside Beach in owner-occupied houses/condos
- 0no vehicle
- 4631 vehicle
- 5852 vehicles
- 2303 vehicles
- 564 vehicles
- 35+ vehicles
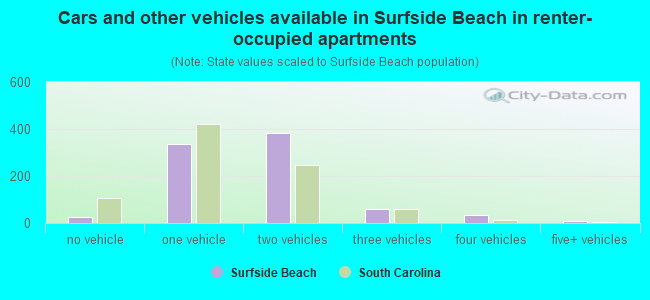
- Cars and other vehicles available in Surfside Beach in renter-occupied apartments
- 26no vehicle
- 3351 vehicle
- 3812 vehicles
- 613 vehicles
- 364 vehicles
- 105+ vehicles
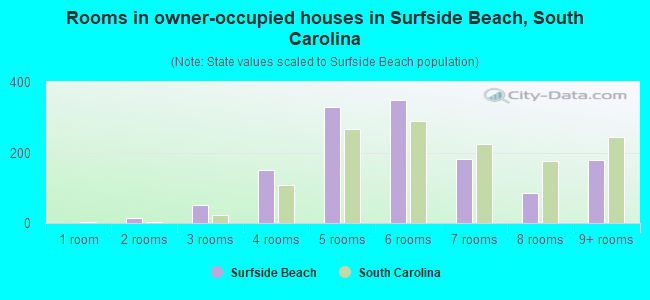
- Rooms in owner-occupied houses in Surfside Beach, South Carolina
- 01 room
- 142 rooms
- 523 rooms
- 1494 rooms
- 3295 rooms
- 3506 rooms
- 1817 rooms
- 858 rooms
- 1789+ rooms
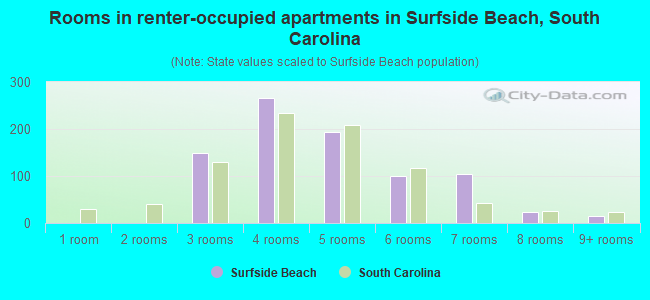
- Rooms in renter-occupied apartments in Surfside Beach, South Carolina
- 01 room
- 02 rooms
- 1483 rooms
- 2664 rooms
- 1945 rooms
- 1006 rooms
- 1057 rooms
- 238 rooms
- 159+ rooms
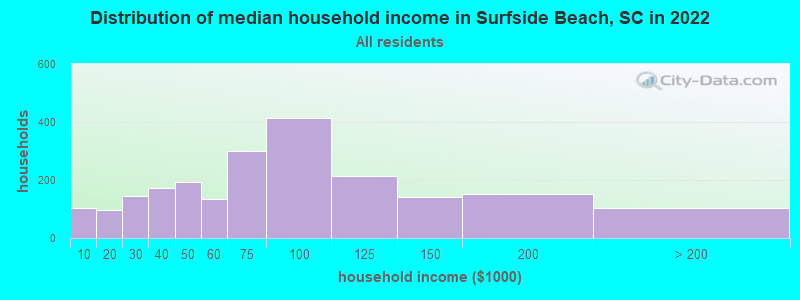
Surfside Beach, SC household income distribution

- 104Less than $10,000
- 95$10,000 to $19,999
- 146$20,000 to $29,999
- 173$30,000 to $39,999
- 194$40,000 to $49,999
- 136$50,000 to $59,999
- 301$60,000 to $74,999
- 415$75,000 to $99,999
- 215$100,000 to $124,999
- 143$125,000 to $149,999
- 151$150,000 to $199,999
- 104$200,000 or more
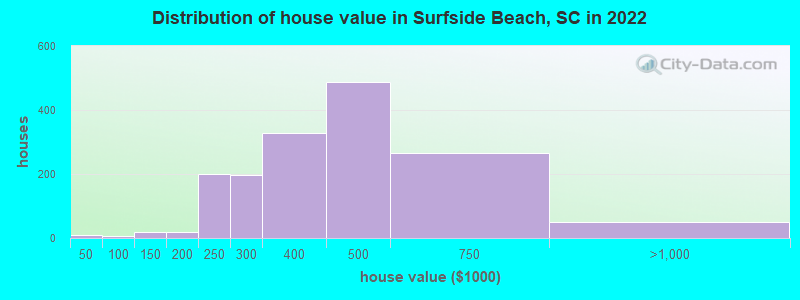
Home value of owner - occupied houses in 2022 in Surfside Beach, SC
-
- 8Less than $10,000
- 1$35,000 to $39,999
- 4$80,000 to $89,999
- 9$100,000 to $124,999
- 11$125,000 to $149,999
- 11$150,000 to $174,999
- 7$175,000 to $199,999
- 198$200,000 to $249,999
- 195$250,000 to $299,999
- 328$300,000 to $399,999
- 487$400,000 to $499,999
- 265$500,000 to $749,999
- 45$750,000 to $999,999
- 6$1,000,000 to $1,499,999
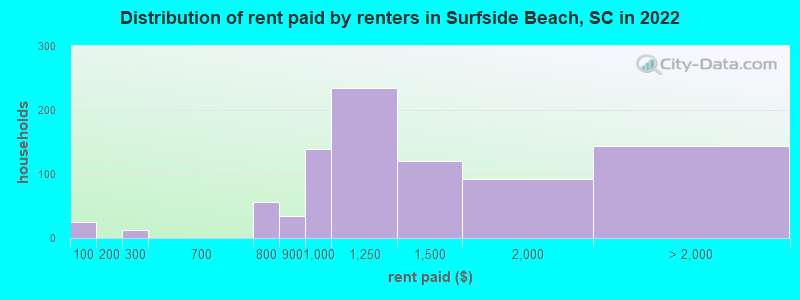
Rent paid by renters in 2022 in Surfside Beach, SC
-
- 25Less than $100
- 12$200 to $249
- 38$700 to $749
- 19$750 to $799
- 34$800 to $899
- 138$900 to $999
- 233$1,000 to $1,249
- 119$1,250 to $1,499
- 92$1,500 to $1,999
- 57$2,000 to $2,499
- 86No cash rent
Percentage of workers working in this county: 82.9%
Number of people working at home: 305 (16.1% of all workers)
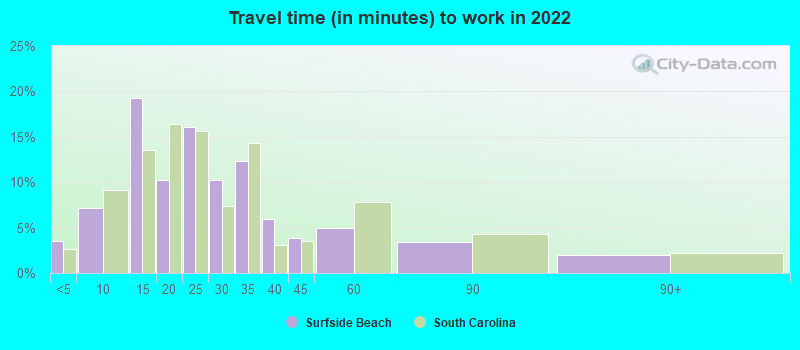
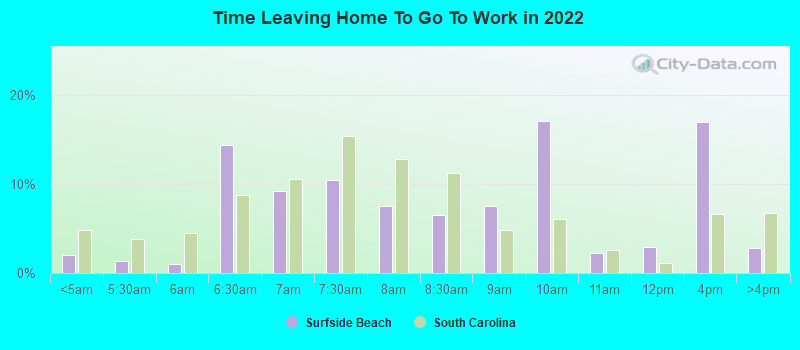
Travel time to work (commute)
- Less than 5 minutes: 44
- 5 to 9 minutes: 200
- 10 to 14 minutes: 251
- 15 to 19 minutes: 250
- 20 to 24 minutes: 412
- 25 to 29 minutes: 174
- 30 to 34 minutes: 137
- 35 to 39 minutes: 5
- 40 to 44 minutes: 23
- 45 to 59 minutes: 87
- 60 to 89 minutes: 0
- 90 or more minutes: 19
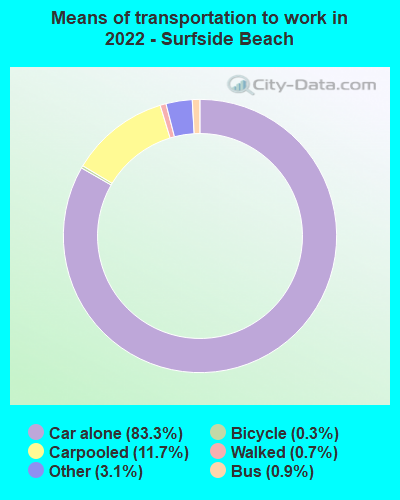
Means of transportation to work:
- Drove a car alone: 2,582 (72.6%)
- Carpooled: 445 (12.5%)
- Bus: 18 (0.5%)
- Taxi: 163 (4.6%)
- Bicycle: 11 (0.3%)
- Walked: 20 (0.6%)
- Worked at home: 305 (8.6%)

- Unemployment by race in 2022
- Unemployment rate for White non-Hispanic residents
- 8.5%Males
- 3.4%Females
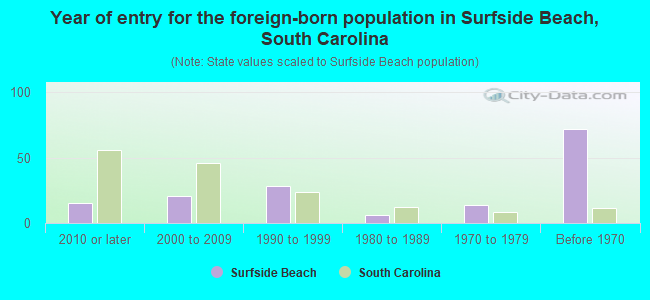
- Year of entry for the foreign-born population in Surfside Beach, South Carolina
- 162010 or later
- 212000 to 2009
- 281990 to 1999
- 61980 to 1989
- 141970 to 1979
- 72Before 1970
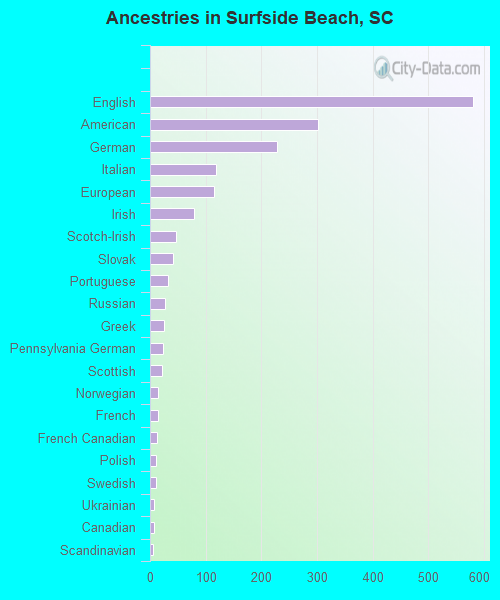
First ancestries reported:
- English: 580 (27.8%)
- American: 302 (14.5%)
- German: 229 (11.0%)
- Italian: 119 (5.7%)
- European: 115 (5.5%)
- Irish: 79 (3.8%)
- Scotch-Irish: 46 (2.2%)
- Slovak: 41 (2.0%)
- Portuguese: 32 (1.5%)
- Russian: 27 (1.3%)
- Greek: 25 (1.2%)
- Pennsylvania German: 24 (1.1%)
- Scottish: 22 (1.1%)
- Norwegian: 15 (0.7%)
- French: 14 (0.7%)
- French Canadian: 12 (0.6%)
- Polish: 10 (0.5%)
- Swedish: 10 (0.5%)
- Ukrainian: 8 (0.4%)
- Canadian: 7 (0.3%)
- Scandinavian: 6 (0.3%)
- Dutch: 5 (0.2%)
- Danish: 3 (0.1%)
- British: 2 (0.10%)
Most common places of birth for foreign-born residents (%):
| Surfside Beach: | 26.0% (25) |
| South Carolina: | 1.1% (2,998) |
| Surfside Beach: | 21.9% (21) |
| South Carolina: | 3.7% (9,982) |
| Surfside Beach: | 16.7% (16) |
| South Carolina: | 1.7% (4,513) |
| Surfside Beach: | 15.6% (15) |
| South Carolina: | 0.4% (1,091) |
| Surfside Beach: | 13.5% (13) |
| South Carolina: | 1.3% (3,522) |
| Surfside Beach: | 8.3% (8) |
| South Carolina: | 0.8% (2,055) |
| Surfside Beach: | 8.3% (8) |
| South Carolina: | 3.0% (8,193) |
Place of birth for U.S.-born residents:
- This state: 1,123
- Other state: 3,214
- Northeast: 935
- Midwest: 319
- South: 1,739
- West: 160
83.2% of Surfside Beach residents lived in the same house 1 years ago.
Out of people who lived in different houses, 29.8% lived in this county.
Out of people who lived in different counties, 9.2% lived in South Carolina.
| Surfside Beach: | 83.2% |
| State average: | 86.5% |
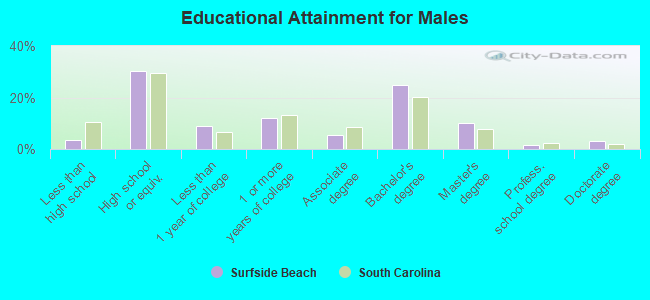
Education attainment for males 25 years and older:
- No schooling: 12
- Nursery to 4th grade: 0
- 5th and 6th grade: 0
- 7th and 8th grade: 0
- 9th grade: 0
- 10th grade: 9
- 11th grade: 7
- 12th grade, no diploma: 36
- High school graduate (or equivalency): 565
- Less than 1 year of college: 169
- Some college more than 1 year, no degree: 223
- Associate degree: 100
- Bachelor's degree: 464
- Master's degree: 188
- Professional school degree: 27
- Doctorate degree: 56
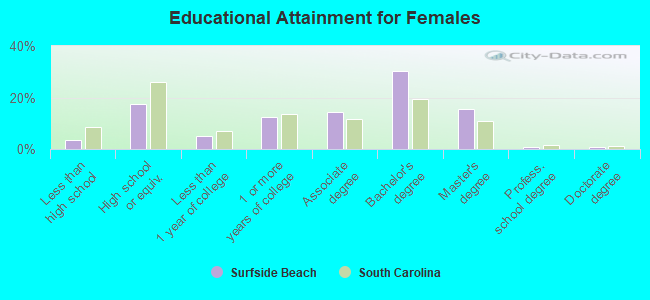
Education attainment for females 25 years and older:
- No schooling: 0
- Nursery to 4th grade: 1
- 5th and 6th grade: 0
- 7th and 8th grade: 0
- 9th grade: 0
- 10th grade: 0
- 11th grade: 6
- 12th grade, no diploma: 58
- High school graduate (or equivalency): 336
- Less than 1 year of college: 100
- Some college more than 1 year, no degree: 234
- Associate degree: 276
- Bachelor's degree: 580
- Master's degree: 293
- Professional school degree: 12
- Doctorate degree: 13
Housing units in structures:
- One, detached: 2,411
- One, attached: 292
- Two: 240
- 3 or 4: 509
- 5 to 9: 278
- 10 to 19: 541
- 20 to 49: 171
- 50 or more: 14
- Mobile homes: 25
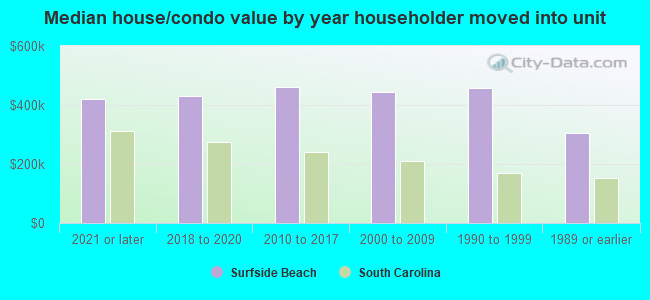
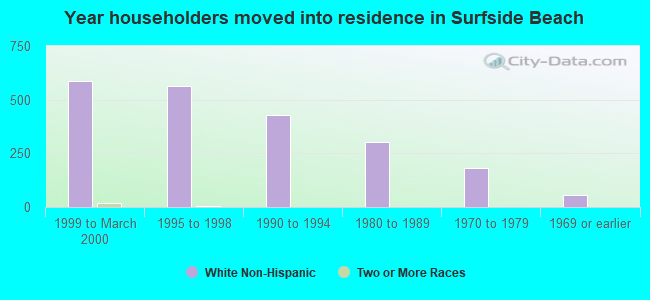
House/condo owner moved in on average 8 years ago
Renter moved in on average 2 years ago
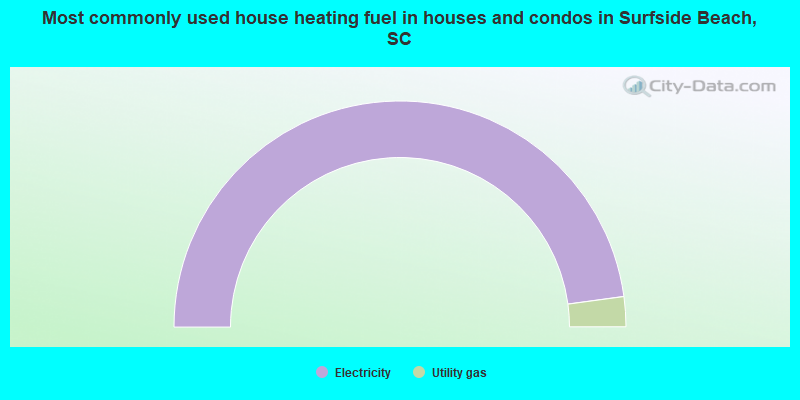
- 95.7%Electricity
- 4.3%Utility gas
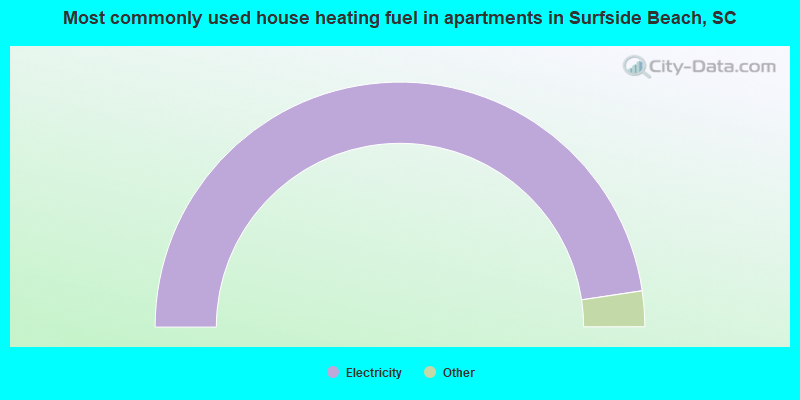
- 95.3%Electricity
- 3.3%Utility gas
- 1.3%No fuel used
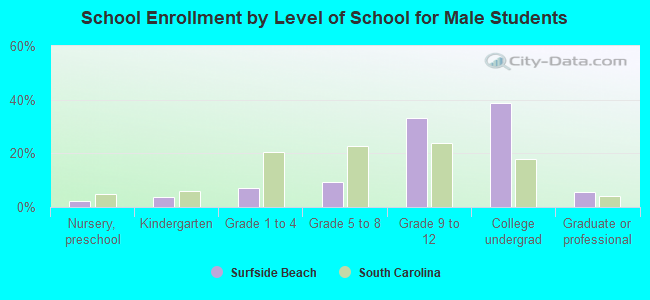
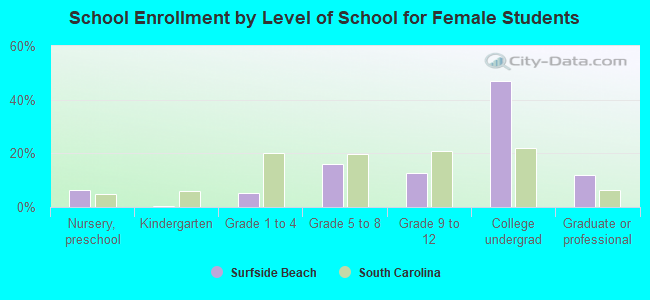
Private vs. public school enrollment:
| Here: | 49.3% |
| South Carolina: | 14.4% |
| Here: | 56.0% |
| South Carolina: | 11.1% |
| Here: | 26.9% |
| South Carolina: | 21.9% |