Superior, WI (Wisconsin) Houses and Residents
| Superior: | $169,771 |
| Wisconsin: | $252,800 |
Mean price in 2022:
Detached houses: $204,515
Here: $204,515 State: $308,468 Townhouses or other attached units: $271,208
Here: $271,208 State: $265,873 In 2-unit structures: $165,325
Here: $165,325 State: $203,667 Mobile homes: $65,135
Here: $65,135 State: $79,042
Total population: 26,705 (Urban population: 25,921, Rural population: 1,461 (42 farm, 1,419 nonfarm))
Houses: 12,595 (11,813 occupied: 7,027 owner occupied, 4,949 renter occupied)
| % of renters here: | 41% |
| State: | 32% |
Housing density: 341 houses/condos per square mile
Median price asked for vacant for-sale houses and condos in 2022: $485,073.
Median contract rent in 2022: $723 (lower quartile is $495, upper quartile is $938)
Median rent asked for vacant for-rent units in 2022: $851
Median gross rent in Superior, WI in 2022: $816
Housing units in Superior with a mortgage: 4,247 (318 second mortgage, 0 home equity loan, 239 both second mortgage and home equity loan)
Houses without a mortgage: 84
Median household income for houses/condos with a mortgage: $96,859
Median household income for apartments without a mortgage: $51,834
Median monthly housing costs: $895
Compare current foreclosures in Superior, WI:
| Photo | Address | Area | Beds / Baths | Price | Details |
|---|---|---|---|---|---|

|
#1
Maryland Ave
Superior, WI 54880
|
1,440 sq. feet
|
1 baths 3 beds |
show details | |

|
#2
N 20th St
Superior, WI 54880
|
1,440 sq. feet
|
1 baths 3 beds |
show details | |

|
#3
E 2nd St
Superior, WI 54880
|
- sq. feet
|
1 baths 2 beds |
show details | |

|
#4
41st Ave E
Superior, WI 54880
|
- sq. feet
|
1 baths 2 beds |
show details | |

|
#5
Winter St
Superior, WI 54880
|
- sq. feet
|
1 baths 2 beds |
show details | |

|
#6
Maryland Ave
Superior, WI 54880
|
- sq. feet
|
1 baths 2 beds |
show details | |

|
#7
Ohio Ave
Superior, WI 54880
|
- sq. feet
|
1 baths 2 beds |
show details | |

|
#8
E 3rd St
Superior, WI 54880
|
- sq. feet
|
1 baths 2 beds |
show details | |

|
#9
Ogden Ave
Superior, WI 54880
|
- sq. feet
|
1 baths 2 beds |
show details | |

|
#10
New York Ave
Superior, WI 54880
|
- sq. feet
|
- baths - beds |
show details |
| Photo | Address | Area | Beds / Baths | Price | Details |
|---|---|---|---|---|---|

|
#11
John Ave Apt L
Superior, WI 54880
|
- sq. feet
|
- baths - beds |
show details | |

|
#12
Badger Dr
Superior, WI 54880
|
- sq. feet
|
2 baths - beds |
show details | |

|
#13
E 7th St
Superior, WI 54880
|
- sq. feet
|
1 baths - beds |
show details | |

|
#14
E 7th St
Superior, WI 54880
|
- sq. feet
|
2 baths - beds |
show details | |

|
#15
S Tuff Rd
Superior, WI 54880
|
- sq. feet
|
- baths - beds |
show details | |

|
#16
Michigan Dr
Superior, WI 54880
|
- sq. feet
|
- baths - beds |
show details | |

|
#17
Iowa Ave
Superior, WI 54880
|
- sq. feet
|
- baths - beds |
show details | |

|
#18
50th Ave E
Superior, WI 54880
|
- sq. feet
|
- baths - beds |
show details | |

|
#19
E 7th St
Superior, WI 54880
|
- sq. feet
|
1 baths - beds |
show details | |

|
#20
Hammond Ave
Superior, WI 54880
|
- sq. feet
|
2 baths - beds |
show details |
| Photo | Address | Area | Beds / Baths | Price | Details |
|---|---|---|---|---|---|

|
#21
Aspen Ct
Superior, WI 54880
|
- sq. feet
|
- baths - beds |
show details | |

|
#22
Weeks Ave
Superior, WI 54880
|
- sq. feet
|
- baths - beds |
show details | |

|
#23
Homecroft Ct
Superior, WI 54880
|
- sq. feet
|
- baths - beds |
show details | |

|
#24
Tower Ave Apt 311
Superior, WI 54880
|
- sq. feet
|
- baths - beds |
show details | |

|
#25
Lamborn Ave
Superior, WI 54880
|
- sq. feet
|
- baths - beds |
show details | |

|
#26
Harrison St Apt 201
Superior, WI 54880
|
- sq. feet
|
- baths - beds |
show details | |

|
#27
Cumming Ave
Superior, WI 54880
|
- sq. feet
|
2 baths - beds |
show details | |

|
#28
Birch Ave
Superior, WI 54880
|
- sq. feet
|
1 baths - beds |
show details | |

|
#29
Belknap St # 410
Superior, WI 54880
|
- sq. feet
|
- baths - beds |
show details | |

|
#30
Butler Ave
Superior, WI 54880
|
- sq. feet
|
- baths - beds |
show details |
| Photo | Address | Area | Beds / Baths | Price | Details |
|---|---|---|---|---|---|

|
#31
Pennsylvania Ave
Superior, WI 54880
|
- sq. feet
|
1 baths - beds |
show details | |

|
#32
Weeks Ave
Superior, WI 54880
|
- sq. feet
|
1 baths - beds |
show details | |

|
#33
Banks Ave
Superior, WI 54880
|
- sq. feet
|
1 baths - beds |
show details | |

|
#34
Wyoming Ave
Superior, WI 54880
|
- sq. feet
|
2 baths - beds |
show details | |

|
#35
N 18th St
Superior, WI 54880
|
- sq. feet
|
2 baths - beds |
show details | |

|
#36
Maple Ave
Superior, WI 54880
|
- sq. feet
|
1 baths - beds |
show details | |

|
#37
N 28th St
Superior, WI 54880
|
- sq. feet
|
- baths - beds |
show details | |

|
#38
John Ave
Superior, WI 54880
|
- sq. feet
|
- baths - beds |
show details | |

|
#39
Clough Ave
Superior, WI 54880
|
- sq. feet
|
- baths - beds |
show details | |

|
#40
E 11th St
Superior, WI 54880
|
- sq. feet
|
- baths - beds |
show details |
| Photo | Address | Area | Beds / Baths | Price | Details |
|---|---|---|---|---|---|

|
#41
4th Ave E
Superior, WI 54880
|
- sq. feet
|
- baths - beds |
show details | |

|
#42
E 1st St
Superior, WI 54880
|
- sq. feet
|
- baths - beds |
show details | |

|
#43
N 21st St
Superior, WI 54880
|
- sq. feet
|
- baths - beds |
show details | |

|
#44
Ogden Ave
Superior, WI 54880
|
- sq. feet
|
- baths - beds |
show details | |

|
#45
E 4th St
Superior, WI 54880
|
- sq. feet
|
- baths - beds |
show details | |

|
#46
Hammond Ave
Superior, WI 54880
|
- sq. feet
|
- baths - beds |
show details | |

|
#47
John Ave
Superior, WI 54880
|
- sq. feet
|
- baths - beds |
show details | |

|
#48
S State Road 35
Superior, WI 54880
|
- sq. feet
|
- baths - beds |
show details | |

|
#49
N 20th St
Superior, WI 54880
|
- sq. feet
|
- baths - beds |
show details | |

|
Check over 1 million property listings on Foreclosure.com!
|
browse all offers | |||

Latest news about housing in Superior, WI collected exclusively by city-data.com from local newspapers, TV, and radio stations

 | Superior, WI : what is open? things to do? (0 replies) |
| Relocating to Eau Claire this summer (61 replies) |
| Moving to Madison Wisconsin. Need advice. (9 replies) |
| Owning Property In Chicago Vs Milwaukee (18 replies) |
| Green Bay or Janesville (53 replies) |
| Upstate Wisconsin—What a Beautiful Place to Live (49 replies) |

Median year apartment built: 1969
Household type by relationship:
Households: 26,609- Male householders: 5,435 (2,034 living alone), Female householders: 6,246 (2,577 living alone)
4,130 spouses (4,112 opposite-sex spouses), 1,006 unmarried partners, (931 opposite-sex unmarried partners), 6,918 children (6,402 natural, 173 adopted, 342 stepchildren), 294 grandchildren, 314 brothers or sisters, 114 parents, 8 foster children, 198 other relatives, 954 non-relatives
- In group quarters: 987
Size of family households: 2,863 2-persons, 1,474 3-persons, 1,284 4-persons, 379 5-persons, 113 6-persons, 11 7-or-more-persons.
Size of nonfamily households: 4,761 1-person, 952 2-persons, 118 3-persons, 31 4-persons, 12 5-persons.
2,985 married couples with children.
1,733 single-parent households (528 men, 1,205 women).
96.1% of residents of Superior speak English at home.
1.0% of residents speak Spanish at home (67% speak English very well, 25% speak English well, 8% speak English not well).
0.8% of residents speak other Indo-European language at home (56% speak English very well, 18% speak English well, 26% speak English not well).
1.7% of residents speak Asian or Pacific Island language at home (35% speak English very well, 16% speak English well, 46% speak English not well, 2% don't speak English at all).
0.4% of residents speak other language at home (92% speak English very well, 2% speak English well, 5% speak English not well).
Foreign born population: 771 (2.9%)
(50.8% of them are naturalized citizens)
| Here: | 6.3 |
| State: | 6.5 |
| Here: | 3.9 |
| State: | 4.1 |

- Bedrooms in owner-occupied houses and condos in Superior, Wisconsin
- 0no bedroom
- 1251 bedroom
- 1,9922 bedrooms
- 3,6153 bedrooms
- 1,1184 bedrooms
- 1765+ bedrooms

- Bedrooms in renter-occupied apartments in Superior, Wisconsin
- 408no bedroom
- 1,7051 bedroom
- 1,8902 bedrooms
- 7183 bedrooms
- 1834 bedrooms
- 465+ bedrooms

- Cars and other vehicles available in Superior in owner-occupied houses/condos
- 130no vehicle
- 2,2461 vehicle
- 2,9932 vehicles
- 1,1573 vehicles
- 3244 vehicles
- 1775+ vehicles

- Cars and other vehicles available in Superior in renter-occupied apartments
- 1,267no vehicle
- 2,3431 vehicle
- 9882 vehicles
- 2603 vehicles
- 674 vehicles
- 255+ vehicles

- Rooms in owner-occupied houses in Superior, Wisconsin
- 01 room
- 02 rooms
- 1373 rooms
- 6304 rooms
- 1,3665 rooms
- 1,7146 rooms
- 1,2527 rooms
- 9958 rooms
- 9349+ rooms

- Rooms in renter-occupied apartments in Superior, Wisconsin
- 3281 room
- 4832 rooms
- 1,0863 rooms
- 1,1904 rooms
- 9075 rooms
- 4966 rooms
- 2517 rooms
- 918 rooms
- 1189+ rooms


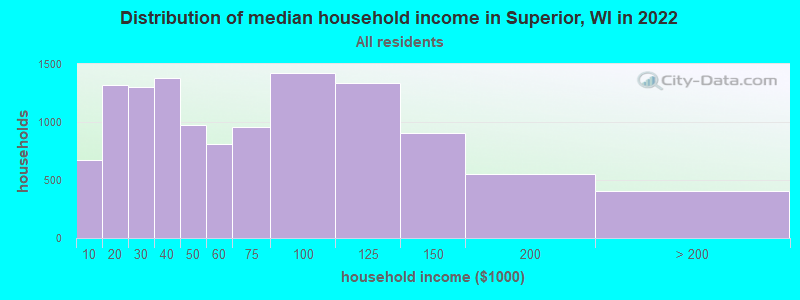
Superior, WI household income distribution

- 669Less than $10,000
- 1,316$10,000 to $19,999
- 1,303$20,000 to $29,999
- 1,378$30,000 to $39,999
- 973$40,000 to $49,999
- 814$50,000 to $59,999
- 955$60,000 to $74,999
- 1,421$75,000 to $99,999
- 1,335$100,000 to $124,999
- 902$125,000 to $149,999
- 550$150,000 to $199,999
- 409$200,000 or more
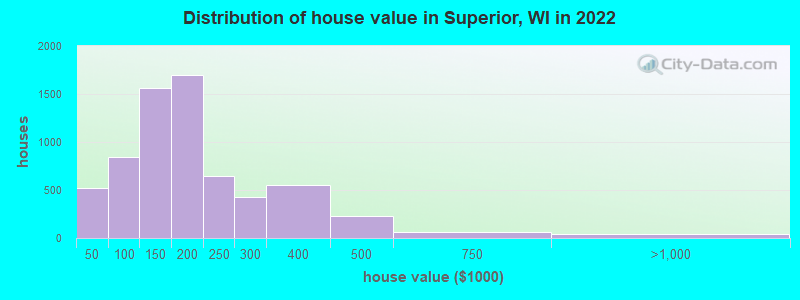
Home value of owner - occupied houses in 2022 in Superior, WI
-
- 164Less than $10,000
- 66$10,000 to $14,999
- 142$15,000 to $19,999
- 13$20,000 to $24,999
- 64$25,000 to $29,999
- 7$30,000 to $34,999
- 22$35,000 to $39,999
- 45$40,000 to $49,999
- 94$50,000 to $59,999
- 159$60,000 to $69,999
- 136$70,000 to $79,999
- 153$80,000 to $89,999
- 249$90,000 to $99,999
- 981$100,000 to $124,999
- 583$125,000 to $149,999
- 1,039$150,000 to $174,999
- 663$175,000 to $199,999
- 646$200,000 to $249,999
- 423$250,000 to $299,999
- 551$300,000 to $399,999
- 234$400,000 to $499,999
- 66$500,000 to $749,999
- 21$750,000 to $999,999
- 14$1,000,000 to $1,499,999
- 8$2,000,000 or more
Rent paid by renters in 2022 in Superior, WI
-
- 49Less than $100
- 48$100 to $149
- 83$150 to $199
- 214$200 to $249
- 204$250 to $299
- 116$300 to $349
- 175$350 to $399
- 108$400 to $449
- 145$450 to $499
- 121$500 to $549
- 260$550 to $599
- 253$600 to $649
- 339$650 to $699
- 385$700 to $749
- 251$750 to $799
- 620$800 to $899
- 330$900 to $999
- 455$1,000 to $1,249
- 260$1,250 to $1,499
- 149$1,500 to $1,999
- 29$2,000 to $2,499
- 14$3,000 to $3,499
- 216No cash rent


Percentage of workers working in this county: 64.3%
Number of people working at home: 1,143 (8.2% of all workers)
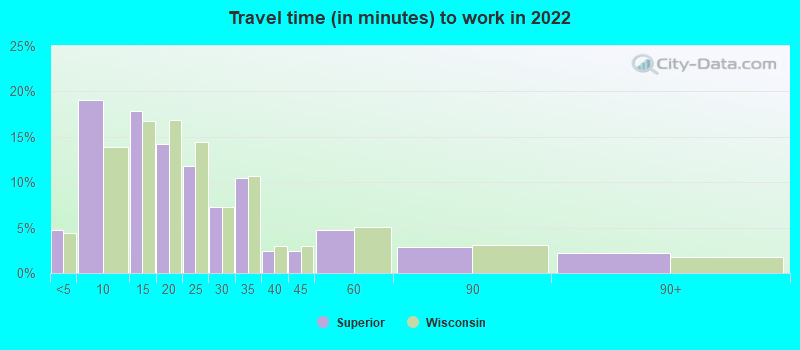
Travel time to work (commute)
- Less than 5 minutes: 727
- 5 to 9 minutes: 2,923
- 10 to 14 minutes: 3,096
- 15 to 19 minutes: 2,399
- 20 to 24 minutes: 1,433
- 25 to 29 minutes: 483
- 30 to 34 minutes: 936
- 35 to 39 minutes: 130
- 40 to 44 minutes: 62
- 45 to 59 minutes: 178
- 60 to 89 minutes: 104
- 90 or more minutes: 148
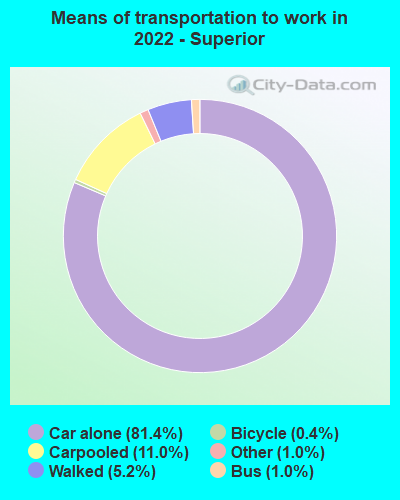
Means of transportation to work:
- Drove a car alone: 12,603 (74.0%)
- Carpooled: 1,883 (11.1%)
- Bus: 141 (0.8%)
- Taxi: 181 (1.1%)
- Bicycle: 55 (0.3%)
- Walked: 802 (4.7%)
- Worked at home: 1,143 (6.7%)

- Unemployment by race in 2022
- Unemployment rate for White non-Hispanic residents
- 2.4%Males
- 2.8%Females
- Unemployment rate for Black residents
- 59.0%Males
- Unemployment rate for two or more race residents
- 1.3%Females
- Unemployment rate for Hispanic or Latino residents
- 15.7%Females

- Year of entry for the foreign-born population in Superior, Wisconsin
- 3582010 or later
- 1312000 to 2009
- 1431990 to 1999
- 741980 to 1989
- 441970 to 1979
- 188Before 1970

First ancestries reported:
- German: 1,123 (12.7%)
- Polish: 789 (8.9%)
- Irish: 675 (7.6%)
- American: 662 (7.5%)
- Norwegian: 646 (7.3%)
- Finnish: 475 (5.4%)
- Swedish: 406 (4.6%)
- European: 401 (4.5%)
- Scandinavian: 370 (4.2%)
- English: 310 (3.5%)
- Italian: 228 (2.6%)
- French Canadian: 151 (1.7%)
- French: 143 (1.6%)
- Romanian: 67 (0.8%)
- Scotch-Irish: 57 (0.6%)
- Northern European: 37 (0.4%)
- Dutch: 33 (0.4%)
- Scottish: 27 (0.3%)
- Lithuanian: 26 (0.3%)
- Belgian: 25 (0.3%)
- Slovak: 24 (0.3%)
- Slovene: 21 (0.2%)
- Greek: 19 (0.2%)
- Croatian: 17 (0.2%)
- Jamaican: 17 (0.2%)
- Australian: 15 (0.2%)
- Ukrainian: 14 (0.2%)
- African: 10 (0.1%)
- Russian: 9 (0.1%)
- Moroccan: 8 (0.09%)
- Czech: 6 (0.07%)
- Nigerian: 6 (0.07%)
- Swiss: 6 (0.07%)
- Eastern European: 5 (0.06%)
- Hungarian: 5 (0.06%)
- Icelander: 4 (0.05%)
- Serbian: 4 (0.05%)
- Ghanaian: 2 (0.02%)
- Armenian: 1 (0.01%)
Most common places of birth for foreign-born residents (%):
| Superior: | 19.6% (151) |
| Wisconsin: | 5.1% (15,165) |
| Superior: | 17.0% (131) |
| Wisconsin: | 1.5% (4,400) |
| Superior: | 11.0% (85) |
| Wisconsin: | 0.4% (1,247) |
| Superior: | 7.5% (58) |
| Wisconsin: | 8.0% (23,594) |
| Superior: | 4.5% (35) |
| Wisconsin: | 0.1% (390) |
| Superior: | 3.6% (28) |
| Wisconsin: | 29.5% (87,182) |
| Superior: | 3.1% (24) |
| Wisconsin: | 0.2% (702) |
| Superior: | 3.1% (24) |
| Wisconsin: | 3.1% (9,280) |
| Superior: | 2.5% (19) |
| Wisconsin: | 1.5% (4,321) |
| Superior: | 2.5% (19) |
| Wisconsin: | 0.2% (506) |
| Superior: | 2.3% (18) |
| Wisconsin: | 0.7% (1,960) |
| Superior: | 2.1% (16) |
| Wisconsin: | 2.3% (6,747) |
| Superior: | 1.9% (15) |
| Wisconsin: | 4.3% (12,681) |
| Superior: | 1.8% (14) |
| Wisconsin: | 0.5% (1,623) |
| Superior: | 1.7% (13) |
| Wisconsin: | 0.8% (2,432) |
| Superior: | 1.6% (12) |
| Wisconsin: | 0.1% (209) |
Place of birth for U.S.-born residents:
- This state: 10,044
- Other state: 15,910
- Northeast: 357
- Midwest: 14,315
- South: 560
- West: 602
84.4% of Superior residents lived in the same house 1 years ago.
Out of people who lived in different houses, 37.3% lived in this county.
Out of people who lived in different counties, 28.7% lived in Wisconsin.
| Superior: | 84.4% |
| State average: | 87.7% |
Education attainment for males 25 years and older:
- No schooling: 99
- Nursery to 4th grade: 16
- 5th and 6th grade: 0
- 7th and 8th grade: 53
- 9th grade: 43
- 10th grade: 72
- 11th grade: 169
- 12th grade, no diploma: 150
- High school graduate (or equivalency): 2,910
- Less than 1 year of college: 636
- Some college more than 1 year, no degree: 1,206
- Associate degree: 1,225
- Bachelor's degree: 1,853
- Master's degree: 409
- Professional school degree: 167
- Doctorate degree: 56

Education attainment for females 25 years and older:
- No schooling: 57
- Nursery to 4th grade: 13
- 5th and 6th grade: 0
- 7th and 8th grade: 23
- 9th grade: 34
- 10th grade: 138
- 11th grade: 108
- 12th grade, no diploma: 99
- High school graduate (or equivalency): 2,242
- Less than 1 year of college: 804
- Some college more than 1 year, no degree: 1,571
- Associate degree: 1,440
- Bachelor's degree: 2,011
- Master's degree: 800
- Professional school degree: 97
- Doctorate degree: 103


Housing units in structures:
- One, detached: 7,690
- One, attached: 379
- Two: 715
- 3 or 4: 874
- 5 to 9: 799
- 10 to 19: 795
- 20 to 49: 204
- 50 or more: 782
- Mobile homes: 354
Median worth of mobile homes: $12,440
Housing units lacking complete kitchen facilities in 2022: 1.8%
House/condo owner moved in on average 12 years ago
Renter moved in on average 4 years ago

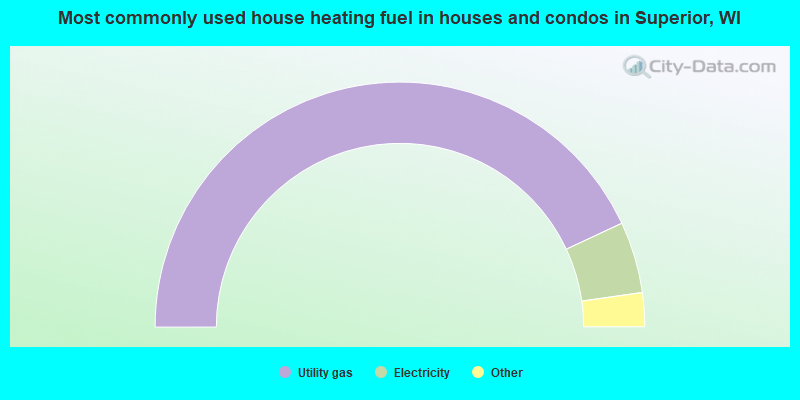
- 86.1%Utility gas
- 9.4%Electricity
- 2.0%Bottled, tank, or LP gas
- 1.9%Fuel oil, kerosene, etc.
- 0.3%Other fuel
- 0.2%Wood
- 0.1%No fuel used
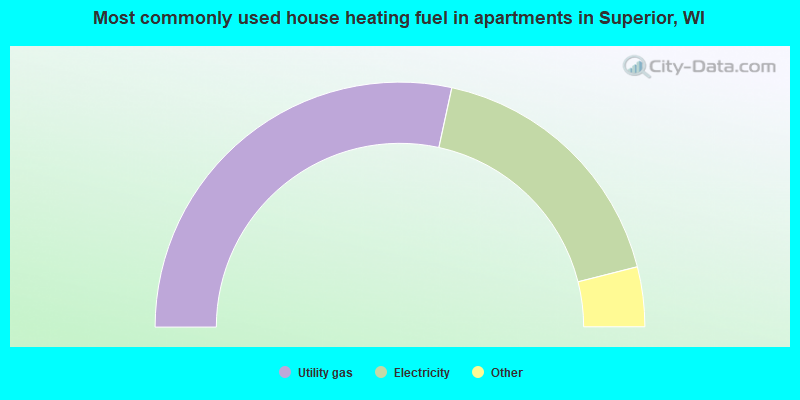
- 56.8%Utility gas
- 35.3%Electricity
- 3.7%Bottled, tank, or LP gas
- 1.9%No fuel used
- 1.5%Other fuel
- 0.9%Fuel oil, kerosene, etc.
Private vs. public school enrollment:
| Here: | 6.1% |
| Wisconsin: | 16.7% |
| Here: | 6.1% |
| Wisconsin: | 12.5% |
| Here: | 8.3% |
| Wisconsin: | 17.5% |


