Housing density: 2,794 houses/condos per square mile
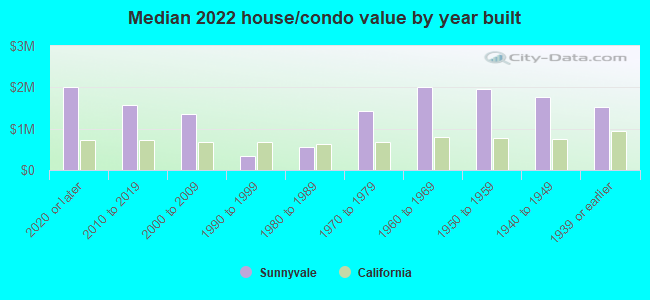
Median price asked for vacant for-sale houses and condos in 2022: $1,962,437.
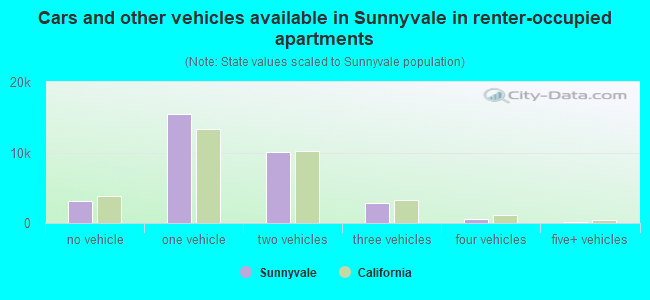
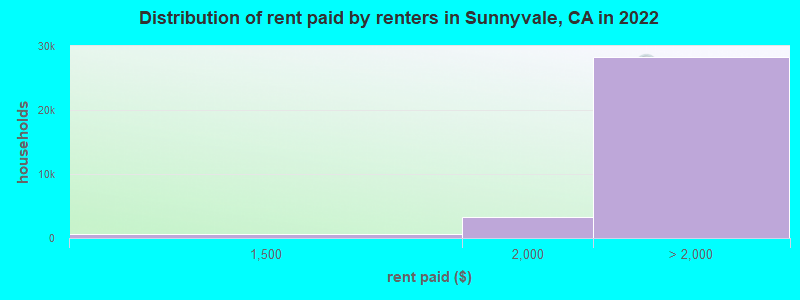
Median contract rent in 2022: over $2,000 (lower quartile is over $2,000, upper quartile is over $2,000)
Median rent asked for vacant for-rent units in 2022: $3,641
Median gross rent in Sunnyvale, CA in 2022: over $2,000
Housing units in Sunnyvale with a mortgage: 15,222 (1,936 second mortgage, 0 home equity loan, 1,750 both second mortgage and home equity loan) Houses without a mortgage: 302
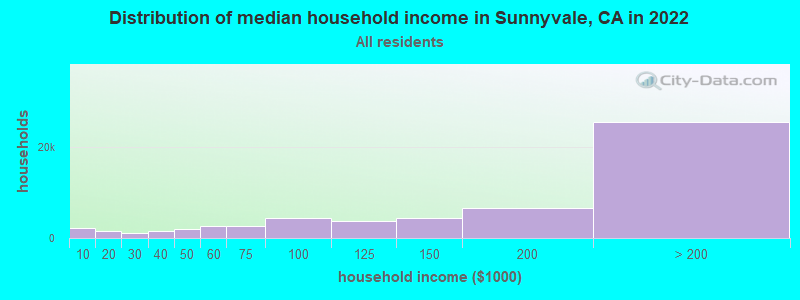
Median household income for houses/condos with a mortgage: $250,001
Median household income for apartments without a mortgage: $107,640
23,164 married couples with children.
3,464 single-parent households (519 men, 2,945 women).
41.5% of residents of Sunnyvale speak English at home.
12.1% of residents speak Spanish at home (67% speak English very well, 16% speak English well, 11% speak English not well, 6% don't speak English at all).
14.8% of residents speak other Indo-European language at home (74% speak English very well, 16% speak English well, 9% speak English not well, 1% don't speak English at all).
28.6% of residents speak Asian or Pacific Island language at home (61% speak English very well, 25% speak English well, 10% speak English not well, 4% don't speak English at all).
3.0% of residents speak other language at home (76% speak English very well, 10% speak English well, 14% speak English not well).
Foreign born population: 74,205 (48.5%)
(42.4% of them are naturalized citizens)
Percentage of workers working in this county: 87.8% Number of people working at home: 26,056 (29.7% of all workers)
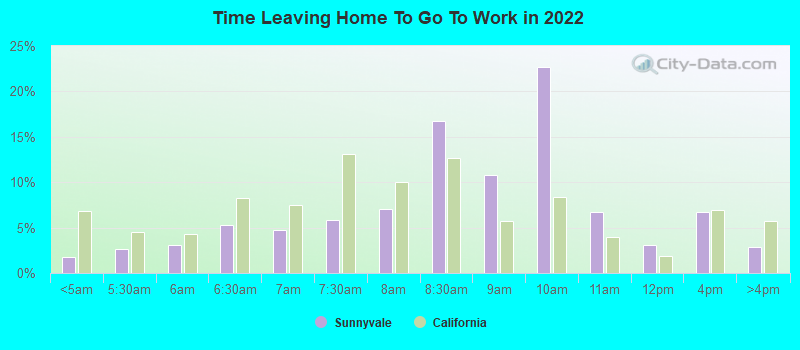
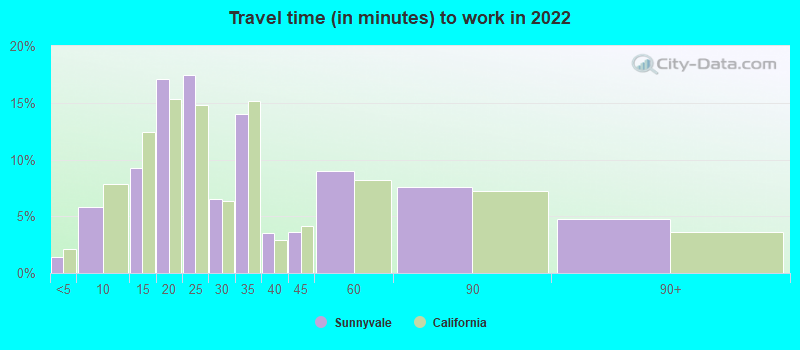
Travel time to work (commute)
Less than 5 minutes: 1,074
5 to 9 minutes: 4,582
10 to 14 minutes: 8,916
15 to 19 minutes: 13,700
20 to 24 minutes: 11,719
25 to 29 minutes: 4,971
30 to 34 minutes: 9,169
35 to 39 minutes: 1,191
40 to 44 minutes: 997
45 to 59 minutes: 2,753
60 to 89 minutes: 2,101
90 or more minutes: 569
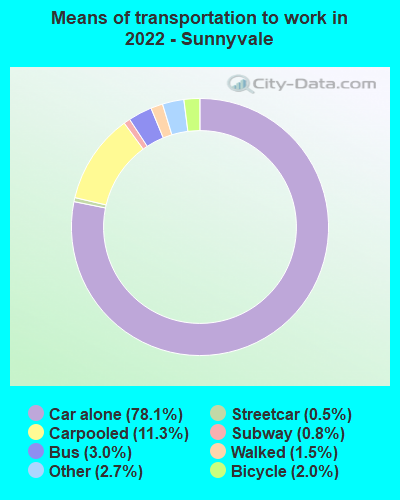
Means of transportation to work:
Drove a car alone: 61,783 (58.7%)
Carpooled: 8,959 (8.5%)
Bus: 2,368 (2.3%)
Subway or elevated rail: 391 (0.4%)
Long-distance train or commuter rail: 638 (0.6%)
Light rail, streetcar or trolley: 46 (0.0%)
Taxi: 2,148 (2.0%)
Bicycle: 1,579 (1.5%)
Walked: 1,196 (1.1%)
Worked at home: 26,056 (24.8%)
Unemployment by race in 2022
Unemployment rate for White non-Hispanic residents
4.7%Males
4.5%Females
Unemployment rate for Black residents
11.3%Males
8.3%Females
Unemployment rate for American Indian and Alaska Native residents
2.8%Females
Unemployment rate for Asian residents
2.5%Males
2.6%Females
Unemployment rate for other race residents
2.3%Males
7.8%Females
Unemployment rate for two or more race residents
13.7%Males
3.2%Females
Unemployment rate for Hispanic or Latino residents
1.7%Males
6.3%Females
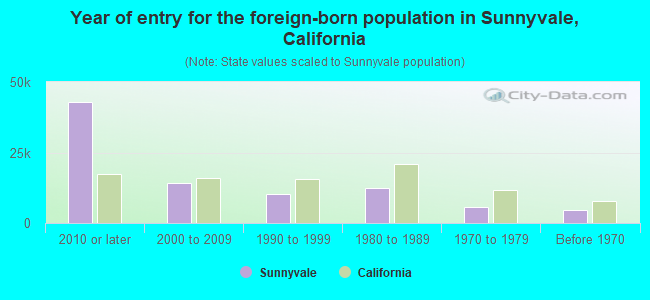
Year of entry for the foreign-born population in Sunnyvale, California
42,9222010 or later
14,1722000 to 2009
10,3941990 to 1999
12,2671980 to 1989
5,5481970 to 1979
4,493Before 1970
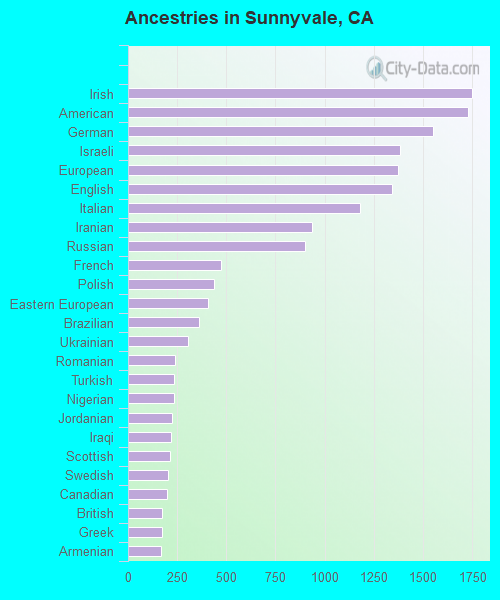
First ancestries reported:
Irish: 1,749 (1.8%)
American: 1,731 (1.7%)
German: 1,551 (1.6%)
Israeli: 1,382 (1.4%)
European: 1,376 (1.4%)
English: 1,343 (1.4%)
Italian: 1,179 (1.2%)
Iranian: 938 (0.9%)
Russian: 900 (0.9%)
French: 473 (0.5%)
Polish: 439 (0.4%)
Eastern European: 408 (0.4%)
Brazilian: 360 (0.4%)
Ukrainian: 306 (0.3%)
Romanian: 240 (0.2%)
Turkish: 235 (0.2%)
Nigerian: 233 (0.2%)
Jordanian: 224 (0.2%)
Iraqi: 219 (0.2%)
Scottish: 216 (0.2%)
Swedish: 202 (0.2%)
Canadian: 200 (0.2%)
British: 174 (0.2%)
Greek: 173 (0.2%)
Armenian: 166 (0.2%)
Portuguese: 164 (0.2%)
Austrian: 152 (0.2%)
Danish: 142 (0.1%)
Norwegian: 138 (0.1%)
French Canadian: 138 (0.1%)
Northern European: 134 (0.1%)
Swiss: 132 (0.1%)
Hungarian: 116 (0.1%)
Bulgarian: 106 (0.1%)
Scandinavian: 99 (0.1%)
Lebanese: 98 (0.10%)
Dutch: 98 (0.10%)
Croatian: 93 (0.09%)
Scotch-Irish: 63 (0.06%)
Welsh: 59 (0.06%)
Guyanese: 48 (0.05%)
Yugoslavian: 45 (0.05%)
Afghan: 42 (0.04%)
Assyrian: 40 (0.04%)
Czech: 36 (0.04%)
Egyptian: 34 (0.03%)
Finnish: 32 (0.03%)
Haitian: 31 (0.03%)
Albanian: 27 (0.03%)
Palestinian: 27 (0.03%)
Slavic: 26 (0.03%)
Somali: 25 (0.03%)
Australian: 22 (0.02%)
Cape Verdean: 22 (0.02%)
Kenyan: 21 (0.02%)
Slovene: 19 (0.02%)
African: 16 (0.02%)
Jamaican: 15 (0.02%)
Zimbabwean: 14 (0.01%)
Ethiopian: 13 (0.01%)
Sudanese: 13 (0.01%)
Celtic: 13 (0.01%)
Macedonian: 9 (0.01%)
Moroccan: 8 (0.01%)
Serbian: 7 (0.01%)
Czechoslovakian: 5 (0.01%)
Belgian: 5 (0.01%)
Most common places of birth for foreign-born residents (%):
India
Sunnyvale:
31.0% (23,736)
California:
5.2% (539,184)
China, excluding Hong Kong and Taiwan
Sunnyvale:
19.1% (14,574)
California:
6.6% (684,672)
Mexico
Sunnyvale:
8.2% (6,245)
California:
37.2% (3,881,193)
Philippines
Sunnyvale:
6.0% (4,589)
California:
7.8% (818,297)
Taiwan
Sunnyvale:
4.3% (3,258)
California:
1.7% (176,274)
Korea
Sunnyvale:
3.1% (2,363)
California:
3.0% (315,248)
Israel
Sunnyvale:
2.9% (2,238)
California:
0.3% (33,029)
Vietnam
Sunnyvale:
2.4% (1,853)
California:
4.9% (512,335)
Canada
Sunnyvale:
1.9% (1,424)
California:
1.2% (127,477)
Japan
Sunnyvale:
1.7% (1,263)
California:
1.0% (103,575)
Place of birth for U.S.-born residents:
This state: 57,866
Other state: 18,330
Northeast: 5,637
Midwest: 4,628
South: 4,281
West: 3,784
81.9% of Sunnyvale residents lived in the same house 1 years ago. Out of people who lived in different houses, 34.5% lived in this county. Out of people who lived in different counties, 52.1% lived in California.
Sunnyvale:
81.9%
State average:
88.9%
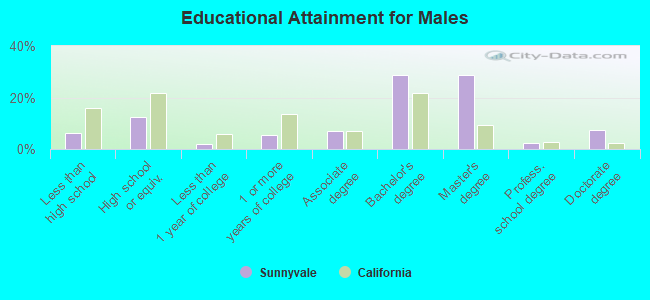
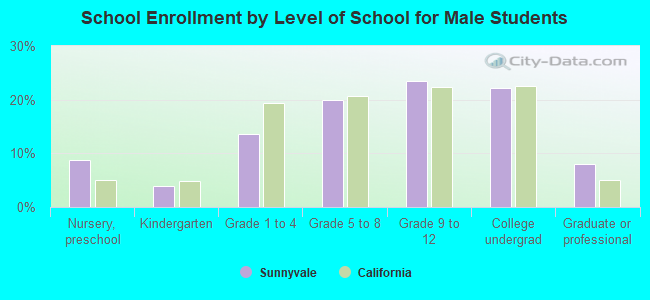
Education attainment for males 25 years and older:
No schooling: 996
Nursery to 4th grade: 284
5th and 6th grade: 847
7th and 8th grade: 125
9th grade: 135
10th grade: 448
11th grade: 71
12th grade, no diploma: 663
High school graduate (or equivalency): 7,279
Less than 1 year of college: 1,219
Some college more than 1 year, no degree: 3,307
Associate degree: 4,087
Bachelor's degree: 17,111
Master's degree: 16,947
Professional school degree: 1,459
Doctorate degree: 4,315
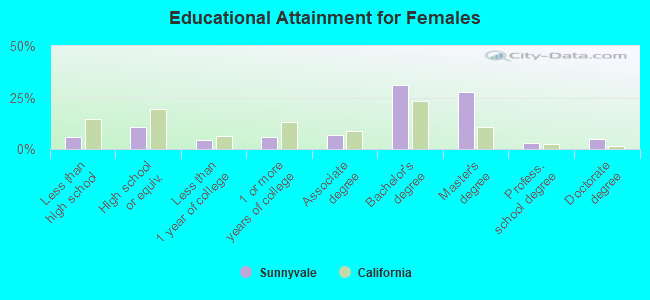
Education attainment for females 25 years and older:
No schooling: 580
Nursery to 4th grade: 173
5th and 6th grade: 476
7th and 8th grade: 191
9th grade: 350
10th grade: 344
11th grade: 341
12th grade, no diploma: 634
High school graduate (or equivalency): 5,614
Less than 1 year of college: 2,307
Some college more than 1 year, no degree: 3,095
Associate degree: 3,718
Bachelor's degree: 16,809
Master's degree: 14,874
Professional school degree: 1,616
Doctorate degree: 2,590
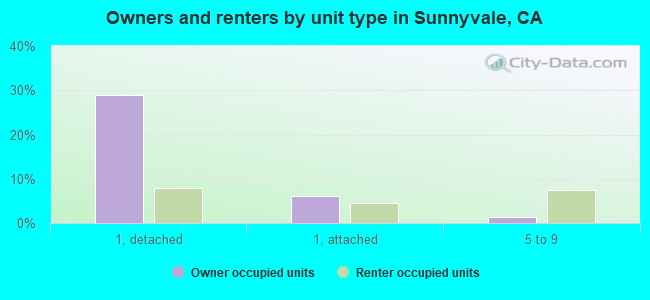
Housing units in structures:
One, detached: 21,868
One, attached: 6,223
Two: 1,344
3 or 4: 3,960
5 to 9: 5,322
10 to 19: 4,718
20 to 49: 5,714
50 or more: 8,111
Mobile homes: 4,041
Median worth of mobile homes: $277,900
Housing units lacking complete kitchen facilities in 2022: 1.7%
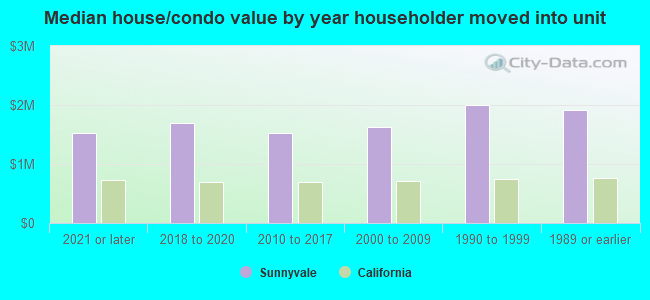
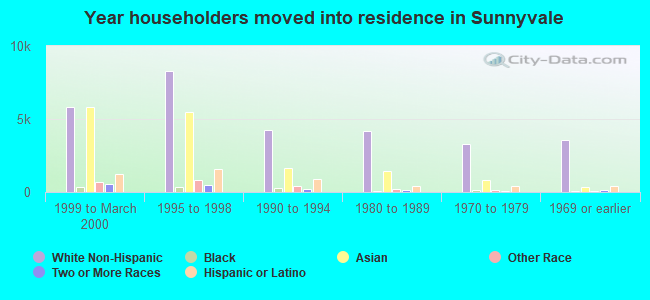
House/condo owner moved in on average 14 years ago