Sunnyslope, CA (California) Houses and Residents
| Sunnyslope: | $582,553 |
| California: | $715,900 |
Total population: 5,153 (Urban population: 4,290, Rural population: 0)
Houses: 1,395 (1,325 occupied: 943 owner occupied, 400 renter occupied)
| % of renters here: | 30% |
| State: | 44% |
Housing density: 1,011 houses/condos per square mile
Median price asked for vacant for-sale houses and condos in 2022 in this county: $550,307.
Median contract rent in 2022: $1,733 (lower quartile is $1,268, upper quartile is over $2,000)
Median rent asked for vacant for-rent units in 2022: $1,284
Median gross rent in Sunnyslope, CA in 2022: over $2,000
Housing units in Sunnyslope with a mortgage: 620 (6 second mortgage, 58 home equity loan, 6 both second mortgage and home equity loan)
Houses without a mortgage: 222
Median household income for houses/condos with a mortgage: $104,722
Median household income for apartments without a mortgage: $120,213
Median monthly housing costs: $1,792


Latest news about housing in Sunnyslope, CA collected exclusively by city-data.com from local newspapers, TV, and radio stations

 | Highgrove, CA's future and gentrification??? (56 replies) |
| Temecula vs. OC? (30 replies) |
| Rubidoux, Riverside, CA (18 replies) |
| BELLTOWN, California - Please Tell Me All About This Area (14 replies) |
| To all of you who say/think that about the IE... (168 replies) |
| California Home Sales up 65% (25 replies) |

Median year apartment built: 1983
Household type by relationship:
Households: 2,153,812- In family households: 1,916,707 (357,691 male householders, 152,550 female householders)
376,381 spouses, 728,028 children (675,451 natural, 15,499 adopted, 37,078 stepchildren), 69,455 grandchildren, 34,232 brothers or sisters, 33,896 parents, foster children, 57,727 other relatives, 76,462 non-relatives
- In nonfamily households: 237,105 (84,686 male householders (58,397 living alone)), 91,333 female householders (74,097 living alone)), 61,086 nonrelatives
- In group quarters: 35,829 (20,862 institutionalized population)
Size of family households: 347 2-persons, 217 3-persons, 236 4-persons, 241 5-persons, 65 6-persons, 91 7-or-more-persons.
Size of nonfamily households: 93 1-person, 15 2-persons.
881 married couples with children.
357 single-parent households (279 men, 78 women).
49.8% of residents of Sunnyslope speak English at home.
41.9% of residents speak Spanish at home (68% speak English very well, 22% speak English well, 6% speak English not well, 4% don't speak English at all).
2.5% of residents speak other Indo-European language at home (89% speak English very well, 11% speak English well).
4.8% of residents speak Asian or Pacific Island language at home (12% speak English very well, 30% speak English well, 33% speak English not well, 25% don't speak English at all).
0.4% of residents speak other language at home (100% speak English very well).
Foreign born population: 1,152 (22.1%)
(47.2% of them are naturalized citizens)
| Here: | 6.2 |
| State: | 6.0 |
| Here: | 5.4 |
| State: | 3.9 |

- Bedrooms in owner-occupied houses and condos in Sunnyslope, California
- 33no bedroom
- 201 bedroom
- 1452 bedrooms
- 3223 bedrooms
- 4044 bedrooms
- 215+ bedrooms

- Bedrooms in renter-occupied apartments in Sunnyslope, California
- 0no bedroom
- 01 bedroom
- 1102 bedrooms
- 1863 bedrooms
- 1044 bedrooms
- 05+ bedrooms

- Cars and other vehicles available in Sunnyslope in owner-occupied houses/condos
- 34no vehicle
- 811 vehicle
- 4882 vehicles
- 1543 vehicles
- 994 vehicles
- 885+ vehicles

- Cars and other vehicles available in Sunnyslope in renter-occupied apartments
- 0no vehicle
- 1201 vehicle
- 1062 vehicles
- 1093 vehicles
- 654 vehicles
- 05+ vehicles

- Rooms in owner-occupied houses in Sunnyslope, California
- 331 room
- 02 rooms
- 333 rooms
- 944 rooms
- 1625 rooms
- 2466 rooms
- 2217 rooms
- 378 rooms
- 1189+ rooms

- Rooms in renter-occupied apartments in Sunnyslope, California
- 01 room
- 02 rooms
- 363 rooms
- 234 rooms
- 1545 rooms
- 456 rooms
- 1097 rooms
- 208 rooms
- 149+ rooms


Sunnyslope, CA household income distribution

- 71Less than $10,000
- 51$10,000 to $19,999
- 145$20,000 to $29,999
- 62$30,000 to $39,999
- 83$40,000 to $49,999
- 63$50,000 to $59,999
- 95$60,000 to $74,999
- 224$75,000 to $99,999
- 132$100,000 to $124,999
- 86$125,000 to $149,999
- 92$150,000 to $199,999
- 131$200,000 or more

Rent paid by renters in 2011_5yr in Sunnyslope, CA
-
- 14$650 to $699
- 57$700 to $749
- 32$750 to $799
- 129$1,000 to $1,249
- 114$1,250 to $1,499
- 13$1,500 to $1,999
- 42No cash rent


Percentage of workers working in this county: 40.7%
Number of people working at home: 182 (9.3% of all workers)
Travel time to work (commute)
- Less than 5 minutes: 7
- 5 to 9 minutes: 38
- 10 to 14 minutes: 426
- 15 to 19 minutes: 200
- 20 to 24 minutes: 297
- 25 to 29 minutes: 118
- 30 to 34 minutes: 233
- 35 to 39 minutes: 13
- 40 to 44 minutes: 58
- 45 to 59 minutes: 59
- 60 to 89 minutes: 171
- 90 or more minutes: 93
Means of transportation to work:
- Drove a car alone: 1,050 (65.8%)
- Carpooled: 389 (24.4%)
- Bus or trolley bus: 23 (1.4%)
- Railroad: 6 (0.4%)
- Bicycle: 5 (0.3%)
- Walked: 55 (3.4%)
- Other means: 14 (0.9%)
- Worked at home: 54 (3.4%)

- Unemployment by race in 2022
- Unemployment rate for White non-Hispanic residents
- 19.3%Males
- 12.9%Females
- Unemployment rate for Asian residents
- 38.7%Females
- Unemployment rate for other race residents
- 19.8%Males
- 32.2%Females
- Unemployment rate for Hispanic or Latino residents
- 12.7%Males
- 21.1%Females

- Year of entry for the foreign-born population in Sunnyslope, California
- 562010 or later
- 02000 to 2009
- 01990 to 1999
- 2501980 to 1989
- 3741970 to 1979
- 188Before 1970

First ancestries reported:
- American: 49 (1.5%)
- European: 44 (1.4%)
- English: 40 (1.2%)
- Italian: 33 (1.0%)
- Armenian: 21 (0.6%)
- German: 21 (0.6%)
- Portuguese: 20 (0.6%)
- Polish: 19 (0.6%)
- Dutch: 17 (0.5%)
- Hungarian: 16 (0.5%)
- Basque: 14 (0.4%)
- Greek: 13 (0.4%)
- Norwegian: 13 (0.4%)
- Czech: 12 (0.4%)
- Irish: 12 (0.4%)
- Scottish: 2 (0.06%)
Most common places of birth for foreign-born residents (%):
| Sunnyslope: | 68.9% (784) |
| California: | 100.0% (-1) |
| Sunnyslope: | 14.7% (167) |
| California: | 100.0% (-1) |
| Sunnyslope: | 4.5% (51) |
| California: | 100.0% (-1) |
| Sunnyslope: | 3.6% (41) |
| California: | 100.0% (-1) |
| Sunnyslope: | 2.5% (28) |
| California: | 100.0% (-1) |
| Sunnyslope: | 1.8% (21) |
| California: | 100.0% (-1) |
| Sunnyslope: | 1.8% (20) |
| California: | 100.0% (-1) |
Place of birth for U.S.-born residents:
- This state: 3,599
- Other state: 506
- Northeast: 82
- Midwest: 164
- South: 171
- West: 87
99.5% of Sunnyslope residents lived in the same house 1 years ago.
Out of people who lived in different houses, 45.1% lived in this county.
Out of people who lived in different counties, 81.8% lived in California.
| Sunnyslope: | 99.5% |
| State average: | 88.9% |
Education attainment for males 25 years and older:
- No schooling: 40
- Nursery to 4th grade: 19
- 5th and 6th grade: 85
- 7th and 8th grade: 2
- 9th grade: 89
- 10th grade: 21
- 11th grade: 35
- 12th grade, no diploma: 108
- High school graduate (or equivalency): 466
- Less than 1 year of college: 211
- Some college more than 1 year, no degree: 103
- Associate degree: 66
- Bachelor's degree: 152
- Master's degree: 4
- Professional school degree: 11
- Doctorate degree: 0

Education attainment for females 25 years and older:
- No schooling: 0
- Nursery to 4th grade: 3
- 5th and 6th grade: 116
- 7th and 8th grade: 42
- 9th grade: 20
- 10th grade: 33
- 11th grade: 67
- 12th grade, no diploma: 149
- High school graduate (or equivalency): 278
- Less than 1 year of college: 192
- Some college more than 1 year, no degree: 324
- Associate degree: 169
- Bachelor's degree: 28
- Master's degree: 55
- Professional school degree: 0
- Doctorate degree: 0


Housing units in structures:
- One, detached: 1,293
- One, attached: 49
- 3 or 4: 22
- Mobile homes: 30
House/condo owner moved in on average 18 years ago
Renter moved in on average 6 years ago


- 88.0%Utility gas
- 6.0%Electricity
- 6.0%No fuel used
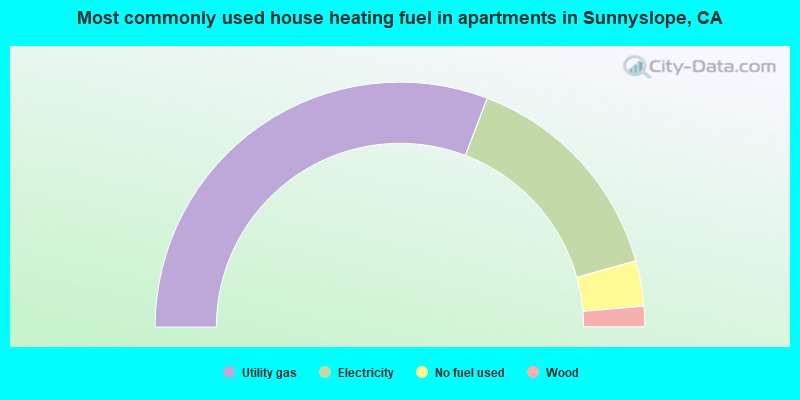
- 61.6%Utility gas
- 29.7%Electricity
- 6.0%No fuel used
- 2.7%Wood
Private vs. public school enrollment:
| Here: | 3.3% |
| California: | 10.5% |
| Here: | 0.0% |
| California: | 8.5% |
| Here: | 0.0% |
| California: | 15.9% |


