Summit, NJ (New Jersey) Houses and Residents
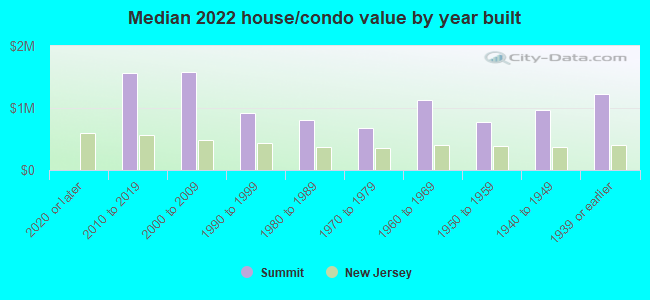
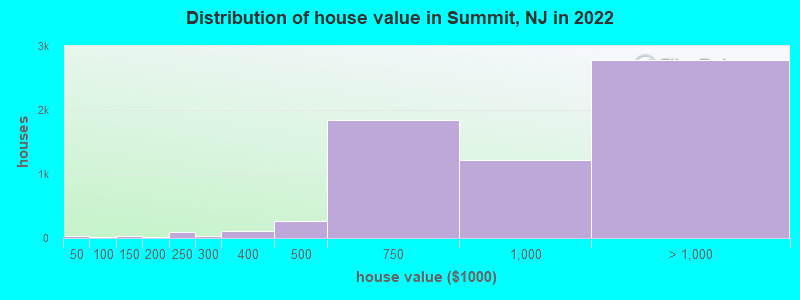
Estimated median house or condo value in 2022: $990,563 (it was $440,800 in 2000 )
Summit:
$990,563New Jersey:
$428,900
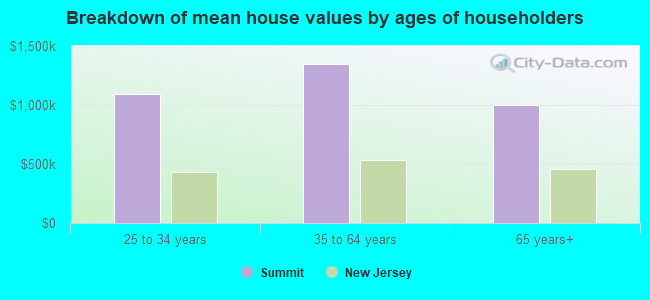
Lower value quartile - upper value quartile: $729,662 - $1,492,073Mean price in 2022: Detached houses: $1,525,377 Here:
$1,525,377State:
$537,591
Townhouses or other attached units: $1,078,763 Here:
$1,078,763State:
$381,113
In 2-unit structures: $663,958 Here:
$663,958State:
$444,476
In 3-to-4-unit structures: $626,203 Here:
$626,203State:
$457,463
In 5-or-more-unit structures: $593,295 Here:
$593,295State:
$368,745
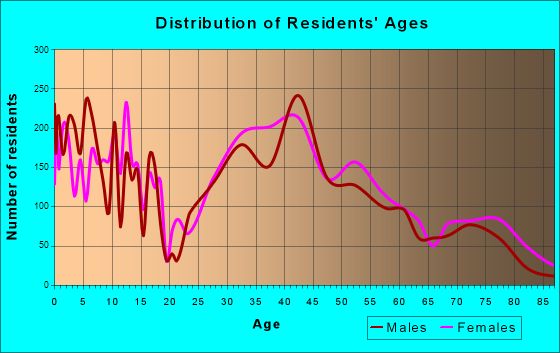
Total population: 22,071 (Urban population: 21,131, Rural population: 0)
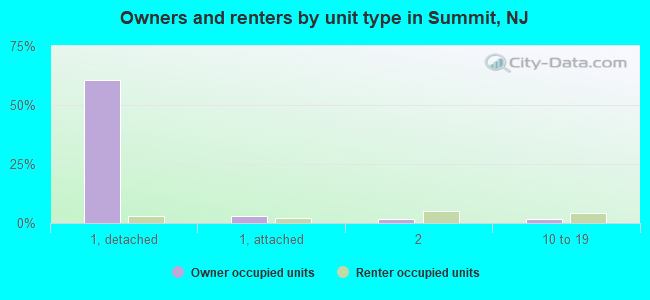
Houses: 8,547 (8,018 occupied: 5,692 owner occupied, 2,353 renter occupied )
% of renters here:
29%State:
35%
Housing density: 1,412 houses/condos per square mile
Median price asked for vacant for-sale houses and condos in 2022: $1,153,778.
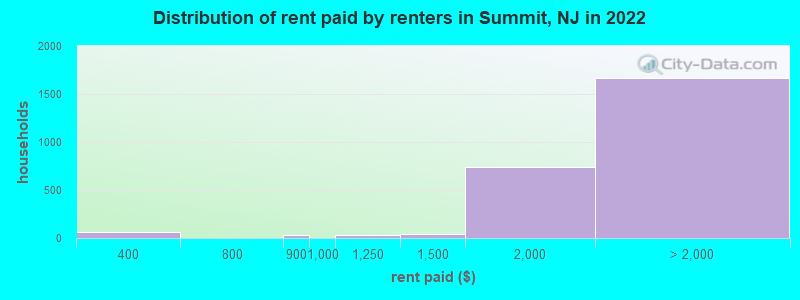
Median contract rent in 2022: over $2,000 (lower quartile is $1,716, upper quartile is over $2,000)
Median rent asked for vacant for-rent units in 2022: $3,267
Median gross rent in Summit, NJ in 2022: over $2,000
Housing units in Summit with a mortgage: 3,852 (378 second mortgage, 34 home equity loan, 347 both second mortgage and home equity loan )Houses without a mortgage: 168
Median household income for houses/condos with a mortgage: $257,605
Median household income for apartments without a mortgage: $169,360
Median monthly housing costs: $3,015
Data:
Median house or condo value ($)
Median house or condo value ($ change since 2000)
Median house or condo value ($) - White
Median house or condo value ($) - Black or African American
Median house or condo value ($) - Asian
Median house or condo value ($) - Hispanic or Latino
Median house or condo value ($) - American Indian and Alaska Native
Median house or condo value ($) - Multirace
Median house or condo value ($) - Other Race
Median price asked for mobile homes ($)
Household density (households per square mile)
Mean house or condo value by units in structure - 1, detached ($)
Mean house or condo value by units in structure - 1, attached ($)
Mean house or condo value by units in structure - 2 ($)
Mean house or condo value by units in structure by units in structure - 3 or 4 ($)
Mean house or condo value by units in structure - 5 or more ($)
Mean house or condo value by units in structure - Boat, RV, van, etc. ($)
Mean house or condo value by units in structure - Mobile home ($)
Median contract rent ($)
Median contract rent - Lower quartile ($)
Median contract rent - Upper quartile ($)
Median gross rent ($)
Urban houses (%)
Rural houses (%)
Houses occupied (%)
Houses occupied (% change since 2000)
Houses owner occupied (%)
Houses owner occupied (% change since 2000)
Houses renter occupied (%)
Houses renter occupied (% change since 2000)
Vacant housing units - For rent (%)
Vacant housing units - For rent (% change since 2000)
Vacant housing units - For sale only (%)
Vacant housing units - For sale only (% change since 2000)
Vacant housing units - Rented or sold, not occupied (%)
Vacant housing units - Rented or sold, not occupied (% change since 2000)
Vacant housing units - For seasonal, recreational, or occasional use (%)
Vacant housing units - For seasonal, recreational, or occasional use (% change since 2000)
Vacant housing units - For migrant workers (%)
Vacant housing units - For migrant workers (% change since 2000)
Vacant housing units - Other vacant (%)
Vacant housing units - Other vacant (% change since 2000)
Median monthly housing costs ($)
Median household income for houses/condos with a mortgage ($)
Median household income for houses/condos without a mortgage ($)
Median household income ($)
Median household income ($) - White
Median household income ($) - Black or African American
Median household income ($) - Asian
Median household income ($) - Hispanic or Latino
Median household income ($) - American Indian and Alaska Native
Median household income ($) - Multirace
Median household income ($) - Other Race
Mortgage status - with mortgage (%)
Mortgage status - with second mortgage (%)
Mortgage status - with home equity loan (%)
Mortgage status - with both second mortgage and home equity loan (%)
Mortgage status - without a mortgage (%)
Median year house/condo built
Median year apartment built
Household type by relationship - Male householder living alone (%)
Household type by relationship - Male householder not living alone (%)
Household type by relationship - Female householder living alone (%)
Household type by relationship - Female householder not living alone (%)
Household type by relationship - Opposite-Sex spouse (%)
Household type by relationship - Same-Sex spouse (%)
Household type by relationship - Opposite-Sex unmarried partner (%)
Household type by relationship - Same-Sex unmarried partner (%)
Household type by relationship - In group quarters (%)
Size of family households - 2-person household (%)
Size of family households - 3-person household (%)
Size of family households - 4-person household (%)
Size of family households - 5-person household (%)
Size of family households - 6-person household (%)
Size of family households - 7-or-more-person household (%)
Size of nonfamily households - 1-person household (%)
Size of nonfamily households - 2-person household (%)
Size of nonfamily households - 3-person household (%)
Size of nonfamily households - 4-person household (%)
Size of nonfamily households - 5-person household (%)
Size of nonfamily households - 6-person household (%)
Size of nonfamily households - 7-or-moreperson household (%)
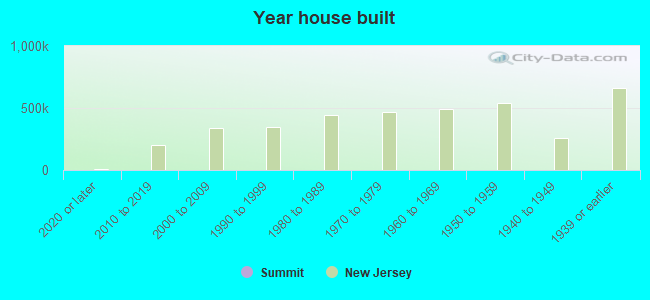
Year house built - Built 2010 or later (%)
Year house built - Built 2000 to 2009 (%)
Year house built - Built 1990 to 1999 (%)
Year house built - Built 1980 to 1989 (%)
Year house built - Built 1970 to 1979 (%)
Year house built - Built 1960 to 1969 (%)
Year house built - Built 1950 to 1959 (%)
Year house built - Built 1940 to 1949 (%)
Year house built - Built 1939 or earlier (%)
Median number of rooms in houses and condos
Median number of rooms in apartments
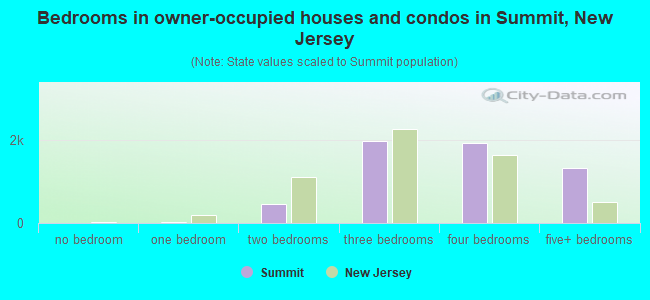
Median number of bedrooms in owner occupied houses
Mean number of bedrooms in owner occupied houses
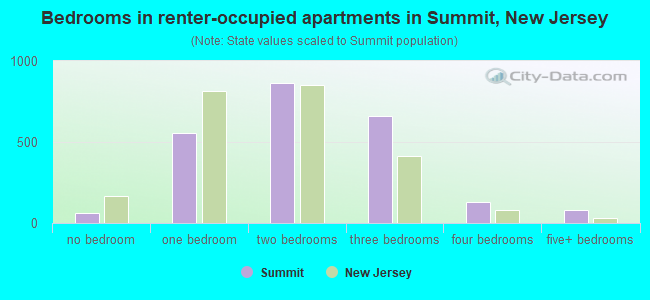
Median number of bedrooms in renter occupied houses
Mean number of bedrooms in renter occupied houses
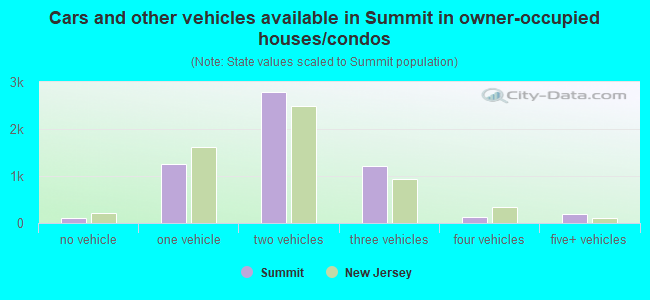
Median number of vehichles in owner occupied houses
Mean number of vehichles in owner occupied houses
Median number of vehichles in renter occupied houses
Mean number of vehichles in renter occupied houses
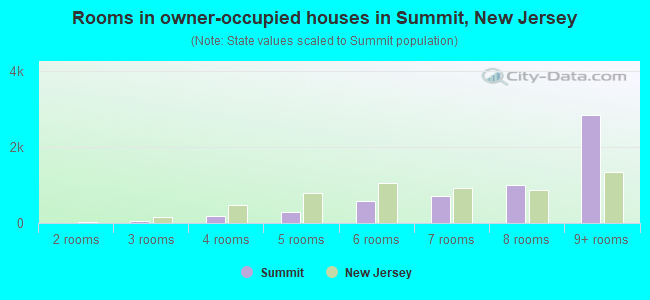
Rooms in owner-occupied houses - 1 room (%)
Rooms in owner-occupied houses - 2 rooms (%)
Rooms in owner-occupied houses - 3 rooms (%)
Rooms in owner-occupied houses - 4 rooms (%)
Rooms in owner-occupied houses - 5 rooms (%)
Rooms in owner-occupied houses - 6 rooms (%)
Rooms in owner-occupied houses - 7 rooms (%)
Rooms in owner-occupied houses - 8 rooms (%)
Rooms in owner-occupied houses - 9+ rooms (%)
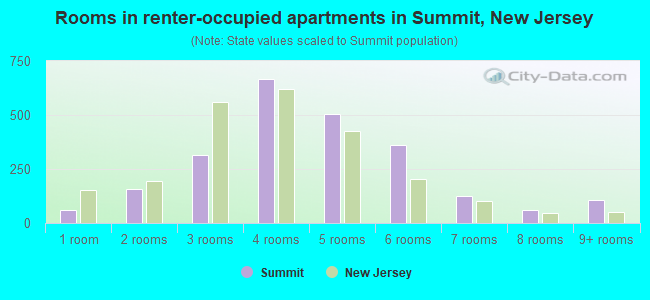
Rooms in renter-occupied houses - 1 room (%)
Rooms in renter-occupied houses - 2 rooms (%)
Rooms in renter-occupied houses - 3 rooms (%)
Rooms in renter-occupied houses - 4 rooms (%)
Rooms in renter-occupied houses - 5 rooms (%)
Rooms in renter-occupied houses - 6 rooms (%)
Rooms in renter-occupied houses - 7 rooms (%)
Rooms in renter-occupied houses - 8 rooms (%)
Rooms in renter-occupied houses - 9+ rooms (%)
Bedrooms in owner-occupied houses - no bedrooms (%)
Bedrooms in owner-occupied houses - 1 bedroom (%)
Bedrooms in owner-occupied houses - 2 bedrooms (%)
Bedrooms in owner-occupied houses - 3 bedrooms (%)
Bedrooms in owner-occupied houses - 4 bedrooms (%)
Bedrooms in owner-occupied houses - 5+ bedrooms (%)
Bedrooms in renter-occupied houses - no bedrooms (%)
Bedrooms in renter-occupied houses - 1 bedroom (%)
Bedrooms in renter-occupied houses - 2 bedrooms (%)
Bedrooms in renter-occupied houses - 3 bedrooms (%)
Bedrooms in renter-occupied houses - 4 bedrooms (%)
Bedrooms in renter-occupied houses - 5+ bedrooms (%)
Vehicles available in owner-occupied houses - no vehicle available (%)
Vehicles available in owner-occupied houses - 1 vehicle available(%)
Vehicles available in owner-occupied houses - 2 Vehicles available (%)
Vehicles available in owner-occupied houses - 3 Vehicles available (%)
Vehicles available in owner-occupied houses - 4 Vehicles available (%)
Vehicles available in owner-occupied houses - 5+ Vehicles available (%)
Vehicles available in renter-occupied houses - no vehicle available (%)
Vehicles available in renter-occupied houses - 1 vehicle available (%)
Vehicles available in renter-occupied houses - 2 Vehicles available (%)
Vehicles available in renter-occupied houses - 3 Vehicles available (%)
Vehicles available in renter-occupied houses - 4 Vehicles available (%)
Vehicles available in renter-occupied houses - 5+ Vehicles available (%)
Housing units in structures - 1, detached (%)
Housing units in structures - 1, attached (%)
Housing units in structures - 2 (%)
Housing units in structures - 3 or 4 (%)
Housing units in structures - 5 to 9 (%)
Housing units in structures - 10 to 19 (%)
Housing units in structures - 20 to 49 (%)
Housing units in structures - 50 or more (%)
Housing units in structures - Mobile home (%)
Housing units in structures - Boat, RV, van, etc. (%)
Housing units in structures - Owners - 1, detached (%)
Housing units in structures - Owners - 1, attached (%)
Housing units in structures - Owners - 2 (%)
Housing units in structures - Owners - 3 or 4 (%)
Housing units in structures - Owners - 5 to 9 (%)
Housing units in structures - Owners - 10 to 19 (%)
Housing units in structures - Owners - 20 to 49 (%)
Housing units in structures - Owners - 50 or more (%)
Housing units in structures - Owners - Mobile home (%)
Housing units in structures - Owners - Boat, RV, van, etc. (%)
Housing units in structures - Renters - 1, detached (%)
Housing units in structures - Renters - 1, attached (%)
Housing units in structures - Renters - 2 (%)
Housing units in structures - Renters - 3 or 4 (%)
Housing units in structures - Renters - 5 to 9 (%)
Housing units in structures - Renters - 10 to 19 (%)
Housing units in structures - Renters - 20 to 49 (%)
Housing units in structures - Renters - 50 or more (%)
Housing units in structures - Renters - Mobile home (%)
Housing units in structures - Renters - Boat, RV, van, etc. (%)
House/condo owner moved in on average (years ago)
Renter moved in on average (years ago)
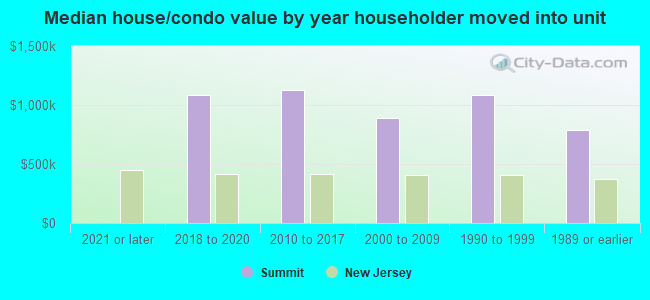
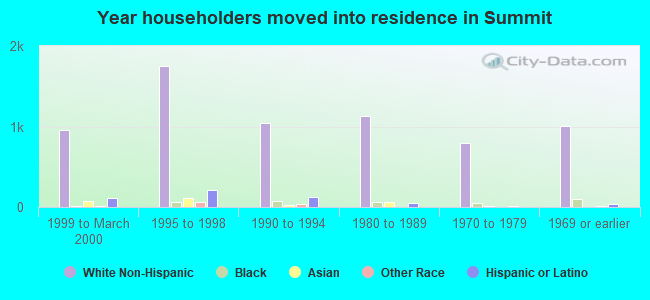
Year householder moved into unit - Moved in 1999 to March 2000 (%)
Year householder moved into unit - Moved in 1999 to March 2000 (%) - White
Year householder moved into unit - Moved in 1999 to March 2000 (%) - Black or African American
Year householder moved into unit - Moved in 1999 to March 2000 (%) - Asian
Year householder moved into unit - Moved in 1999 to March 2000 (%) - Hispanic or Latino
Year householder moved into unit - Moved in 1999 to March 2000 (%) - American Indian and Alaska Native
Year householder moved into unit - Moved in 1999 to March 2000 (%) - Multirace
Year householder moved into unit - Moved in 1999 to March 2000 (%) - Other Race
Year householder moved into unit - Moved in 1995 to 1998 (%)
Year householder moved into unit - Moved in 1995 to 1998 (%) - White
Year householder moved into unit - Moved in 1995 to 1998 (%) - Black or African American
Year householder moved into unit - Moved in 1995 to 1998 (%) - Asian
Year householder moved into unit - Moved in 1995 to 1998 (%) - Hispanic or Latino
Year householder moved into unit - Moved in 1995 to 1998 (%) - American Indian and Alaska Native
Year householder moved into unit - Moved in 1995 to 1998 (%) - Multirace
Year householder moved into unit - Moved in 1995 to 1998 (%) - Other Race
Year householder moved into unit - Moved in 1990 to 1994 (%)
Year householder moved into unit - Moved in 1990 to 1994 (%) - White
Year householder moved into unit - Moved in 1990 to 1994 (%) - Black or African American
Year householder moved into unit - Moved in 1990 to 1994 (%) - Asian
Year householder moved into unit - Moved in 1990 to 1994 (%) - Hispanic or Latino
Year householder moved into unit - Moved in 1990 to 1994 (%) - American Indian and Alaska Native
Year householder moved into unit - Moved in 1990 to 1994 (%) - Multirace
Year householder moved into unit - Moved in 1990 to 1994 (%) - Other Race
Year householder moved into unit - Moved in 1980 to 1989 (%)
Year householder moved into unit - Moved in 1980 to 1989 (%) - White
Year householder moved into unit - Moved in 1980 to 1989 (%) - Black or African American
Year householder moved into unit - Moved in 1980 to 1989 (%) - Asian
Year householder moved into unit - Moved in 1980 to 1989 (%) - Hispanic or Latino
Year householder moved into unit - Moved in 1980 to 1989 (%) - American Indian and Alaska Native
Year householder moved into unit - Moved in 1980 to 1989 (%) - Multirace
Year householder moved into unit - Moved in 1980 to 1989 (%) - Other Race
Year householder moved into unit - Moved in 1970 to 1979 (%)
Year householder moved into unit - Moved in 1970 to 1979 (%) - White
Year householder moved into unit - Moved in 1970 to 1979 (%) - Black or African American
Year householder moved into unit - Moved in 1970 to 1979 (%) - Asian
Year householder moved into unit - Moved in 1970 to 1979 (%) - Hispanic or Latino
Year householder moved into unit - Moved in 1970 to 1979 (%) - American Indian and Alaska Native
Year householder moved into unit - Moved in 1970 to 1979 (%) - Multirace
Year householder moved into unit - Moved in 1970 to 1979 (%) - Other Race
Year householder moved into unit - Moved in 1969 or earlier (%)
Year householder moved into unit - Moved in 1969 or earlier (%) - White
Year householder moved into unit - Moved in 1969 or earlier (%) - Black or African American
Year householder moved into unit - Moved in 1969 or earlier (%) - Asian
Year householder moved into unit - Moved in 1969 or earlier (%) - Hispanic or Latino
Year householder moved into unit - Moved in 1969 or earlier (%) - American Indian and Alaska Native
Year householder moved into unit - Moved in 1969 or earlier (%) - Multirace
Year householder moved into unit - Moved in 1969 or earlier (%) - Other Race
Housing units lacking complete plumbing facilities (%)
Housing units lacking complete kitchen facilities (%)
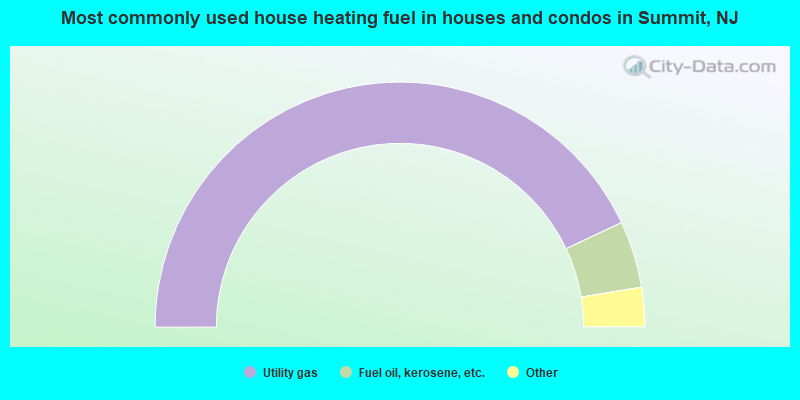
House heating fuel used in houses and condos - Utility gas (%)
House heating fuel used in houses and condos - Bottled, tank, or LP gas (%)
House heating fuel used in houses and condos - Electricity (%)
House heating fuel used in houses and condos - Fuel oil, kerosene, etc. (%)
House heating fuel used in houses and condos - Coal or coke (%)
House heating fuel used in houses and condos - Wood (%)
House heating fuel used in houses and condos - Solar energy (%)
House heating fuel used in houses and condos - Other fuel (%)
House heating fuel used in houses and condos - No fuel used (%)
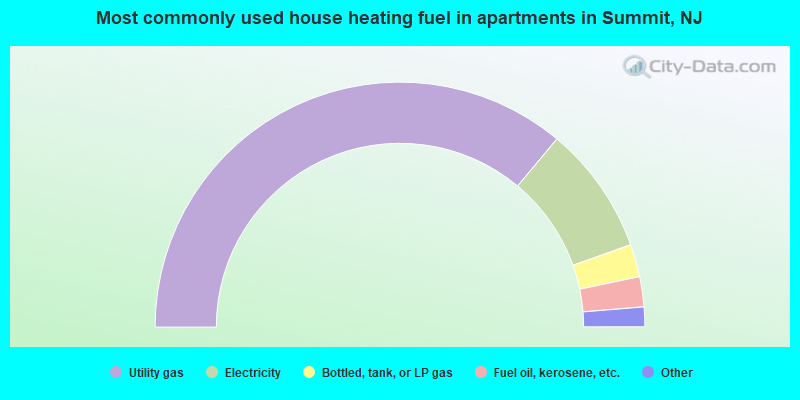
House heating fuel used in apartments - Utility gas (%)
House heating fuel used in apartments - Bottled, tank, or LP gas (%)
House heating fuel used in apartments - Electricity (%)
House heating fuel used in apartments - Fuel oil, kerosene, etc. (%)
House heating fuel used in apartments - Coal or coke (%)
House heating fuel used in apartments - Wood (%)
House heating fuel used in apartments - Solar energy (%)
House heating fuel used in apartments - Other fuel (%)
House heating fuel used in apartments - No fuel used (%)
Latest news about housing in Summit, NJ collected exclusively by city-data.com from local newspapers, TV, and radio stations
Median year house/condo built: 1952Median year apartment built: 1960Household type by relationship:
Households: 22,465
Male householders: 3,560 (478 living alone ), Female householders: 4,351 (1,127 living alone )4,726 spouses (4,691 opposite-sex spouses ), 638 unmarried partners , (638 opposite-sex unmarried partners ), 8,045 children (7,949 natural , 28 adopted , 66 stepchildren ), 35 grandchildren , 115 brothers or sisters , 394 parents , 0 foster children , 172 other relatives , 231 non-relatives In group quarters: 194
Size of family households: 1,890 2-persons , 1,382 3-persons , 1,587 4-persons , 893 5-persons , 145 6-persons .
Size of nonfamily households: 1,559 1-person , 602 2-persons .
4,675 married couples with children. single-parent households (151 men , 579 women ).
71.2% of residents of Summit speak English at home. of residents speak Spanish at home (53% speak English very well , 22% speak English well , 15% speak English not well , 10% don't speak English at all ).of residents speak other Indo-European language at home (81% speak English very well , 9% speak English well , 6% speak English not well , 4% don't speak English at all ).of residents speak Asian or Pacific Island language at home (79% speak English very well , 18% speak English well , 3% speak English not well ).of residents speak other language at home (74% speak English very well , 26% speak English well ).
Foreign born population: 4,974 (22.1%)of them are naturalized citizens )
Median number of rooms in houses and condos:
Median number of rooms in apartments
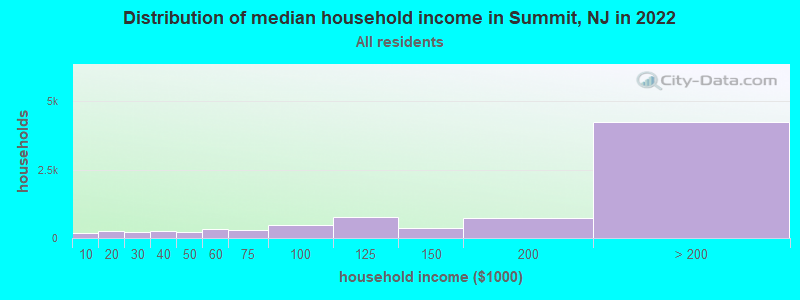
Summit, NJ household income distribution 178 Less than $10,000249 $10,000 to $19,999204 $20,000 to $29,999241 $30,000 to $39,999233 $40,000 to $49,999312 $50,000 to $59,999278 $60,000 to $74,999488 $75,000 to $99,999780 $100,000 to $124,999381 $125,000 to $149,999724 $150,000 to $199,9994,237 $200,000 or more
Home value of owner - occupied houses in 2022 in Summit, NJ 21 Less than $10,0004 $15,000 to $19,9998 $70,000 to $79,99923 $100,000 to $124,99913 $150,000 to $174,9994 $175,000 to $199,99997 $200,000 to $249,99924 $250,000 to $299,999116 $300,000 to $399,999273 $400,000 to $499,9991,851 $500,000 to $749,9991,225 $750,000 to $999,999946 $1,000,000 to $1,499,9991,003 $1,500,000 to $1,999,999829 $2,000,000 or moreRent paid by renters in 2022 in Summit, NJ 15 Less than $10015 $150 to $19912 $250 to $29958 $350 to $39932 $800 to $89935 $1,000 to $1,24945 $1,250 to $1,499736 $1,500 to $1,999570 $2,000 to $2,499359 $2,500 to $2,999169 $3,000 to $3,499240 $3,500 or more323 No cash rent
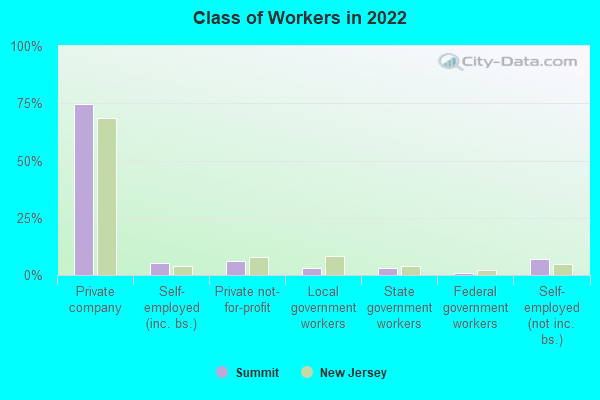
Percentage of workers working in this county: 50.8%Number of people working at home: 2,393 (21.6% of all workers )
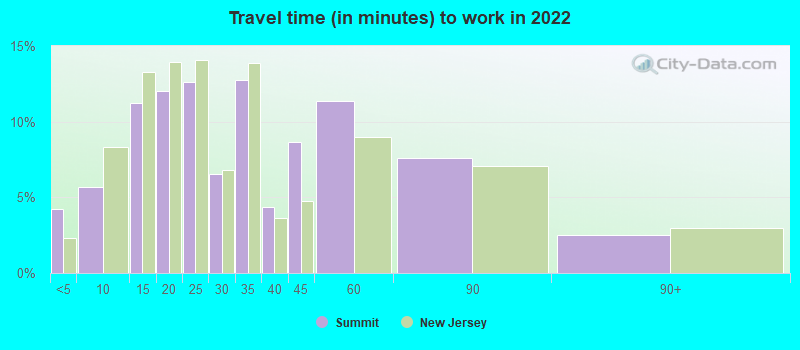
Travel time to work (commute)
Less than 5 minutes: 6185 to 9 minutes: 61310 to 14 minutes: 1,16215 to 19 minutes: 1,11020 to 24 minutes: 96325 to 29 minutes: 58130 to 34 minutes: 55735 to 39 minutes: 8640 to 44 minutes: 42745 to 59 minutes: 49160 to 89 minutes: 1,54590 or more minutes: 662
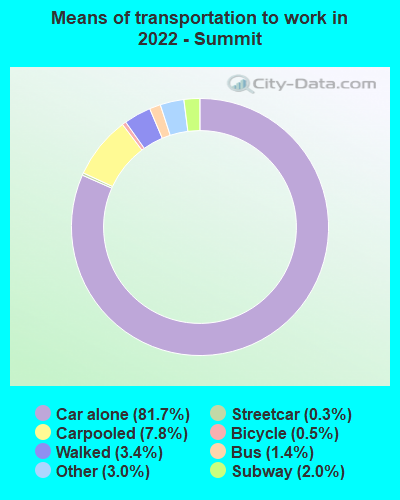
Means of transportation to work:
Drove a car alone: 13,910 (69.3%)Carpooled: 1,616 (8.1%)Bus : 262 (1.3%)Subway or elevated rail : 48 (0.2%)Long-distance train or commuter rail : 425 (2.1%)Taxi: 451 (2.2%)Bicycle: 155 (0.8%)Walked: 647 (3.2%)Worked at home: 2,393 (11.9%)
Unemployment by race in 2022
Unemployment rate for White non-Hispanic residents 3.4% Males5.4% FemalesUnemployment rate for Black residents 3.3% Males12.0% FemalesUnemployment rate for Asian residents 3.4% FemalesUnemployment rate for other race residents 9.3% Males8.2% FemalesUnemployment rate for two or more race residents 0.9% Males4.7% FemalesUnemployment rate for Hispanic or Latino residents 8.8% Males7.8% Females
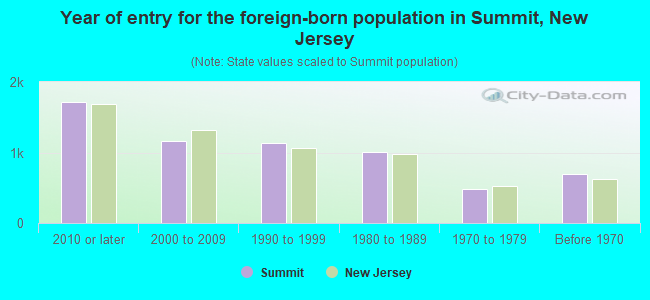
Year of entry for the foreign-born population in Summit, New Jersey
1,717 2010 or later 1,169 2000 to 2009 1,128 1990 to 1999 1,003 1980 to 1989 483 1970 to 1979 699 Before 1970
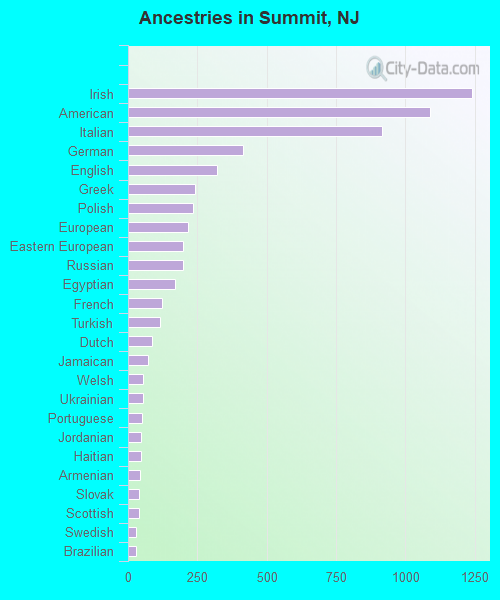
First ancestries reported:
Irish: 1,239 (11.1%)
American: 1,088 (9.8%)
Italian: 915 (8.2%)
German: 413 (3.7%)
English: 321 (2.9%)
Greek: 241 (2.2%)
Polish: 233 (2.1%)
European: 215 (1.9%)
Eastern European: 199 (1.8%)
Russian: 198 (1.8%)
Egyptian: 171 (1.5%)
French: 123 (1.1%)
Turkish: 115 (1.0%)
Dutch: 88 (0.8%)
Jamaican: 72 (0.6%)
Welsh: 55 (0.5%)
Ukrainian: 53 (0.5%)
Portuguese: 50 (0.4%)
Jordanian: 46 (0.4%)
Haitian: 46 (0.4%)
Armenian: 42 (0.4%)
Slovak: 38 (0.3%)
Scottish: 38 (0.3%)
Swedish: 28 (0.3%)
Brazilian: 28 (0.3%)
Croatian: 26 (0.2%)
Scandinavian: 25 (0.2%)
Danish: 24 (0.2%)
Albanian: 24 (0.2%)
Hungarian: 24 (0.2%)
Northern European: 23 (0.2%)
British: 23 (0.2%)
Canadian: 21 (0.2%)
French Canadian: 19 (0.2%)
Norwegian: 19 (0.2%)
Lebanese: 19 (0.2%)
Iranian: 15 (0.1%)
Estonian: 15 (0.1%)
Serbian: 15 (0.1%)
Israeli: 10 (0.09%)
Czech: 9 (0.08%)
Syrian: 9 (0.08%)
Australian: 9 (0.08%)
Scotch-Irish: 7 (0.06%)
Senegalese: 6 (0.05%)
Bulgarian: 5 (0.04%)
Most common places of birth for foreign-born residents (%): Costa Rica Summit:
15.2% (735)New Jersey:
0.7% (14,848)
India Summit:
10.5% (506)New Jersey:
12.8% (274,609)
China, excluding Hong Kong and Taiwan Summit:
6.2% (300)New Jersey:
3.7% (78,969)
Mexico Summit:
5.4% (259)New Jersey:
4.8% (102,527)
Peru Summit:
4.7% (225)New Jersey:
2.7% (58,563)
Egypt Summit:
3.2% (155)New Jersey:
1.6% (33,678)
Brazil Summit:
2.9% (140)New Jersey:
2.1% (46,020)
Germany Summit:
2.8% (134)New Jersey:
0.8% (17,217)
Ukraine Summit:
2.4% (114)New Jersey:
1.1% (22,760)
Russia Summit:
2.3% (112)New Jersey:
0.9% (20,371)
Greece Summit:
2.2% (105)New Jersey:
0.3% (7,501)
Poland Summit:
2.2% (104)New Jersey:
2.3% (48,811)
Honduras Summit:
2.0% (99)New Jersey:
1.7% (37,335)
Korea Summit:
2.0% (97)New Jersey:
3.3% (70,512)
Colombia Summit:
2.0% (97)New Jersey:
4.2% (90,817)
Guatemala Summit:
2.0% (96)New Jersey:
2.2% (46,813)
Sri Lanka Summit:
1.9% (94)New Jersey:
0.2% (3,488)
Other Eastern Europe Summit:
1.9% (93)New Jersey:
0.4% (7,791)
United Kingdom, excluding England and Scotland Summit:
1.8% (86)New Jersey:
0.6% (12,793)
Italy Summit:
1.8% (86)New Jersey:
1.5% (33,198)
Philippines Summit:
1.7% (81)New Jersey:
4.0% (85,934)
Canada Summit:
1.6% (78)New Jersey:
0.9% (18,317)
Taiwan Summit:
1.6% (77)New Jersey:
0.7% (15,548)
Turkey Summit:
1.6% (75)New Jersey:
0.8% (16,778)
Place of birth for U.S.-born residents:
This state: 8,725Other state: 8,600Northeast: 5,799Midwest: 1,111South: 838West: 564 90.7% of Summit residents lived in the same house 1 years ago.
Out of people who lived in different houses, 27.8% lived in this county.
Out of people who lived in different counties, 27.3% lived in New Jersey.
Summit:
90.7%State average:
90.4%
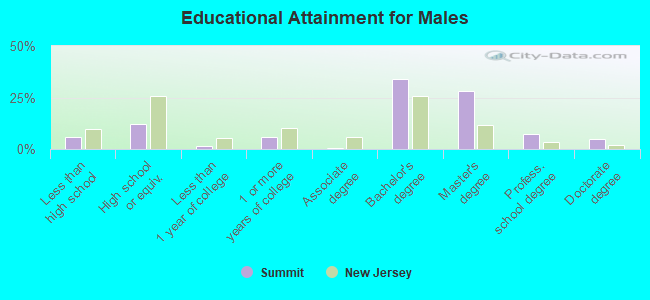
Education attainment for males 25 years and older:
No schooling: 51Nursery to 4th grade: 315th and 6th grade: 1027th and 8th grade: 559th grade: 7710th grade: 2411th grade: 012th grade, no diploma: 68High school graduate (or equivalency): 863Less than 1 year of college: 119Some college more than 1 year, no degree: 418Associate degree: 41Bachelor's degree: 2,455Master's degree: 2,044Professional school degree: 531Doctorate degree: 350
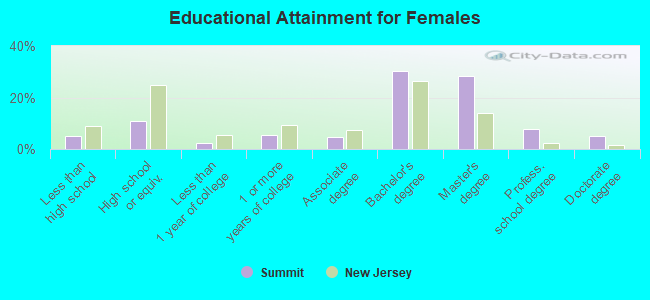
Education attainment for females 25 years and older:
No schooling: 67Nursery to 4th grade: 135th and 6th grade: 577th and 8th grade: 449th grade: 7810th grade: 611th grade: 1512th grade, no diploma: 120High school graduate (or equivalency): 869Less than 1 year of college: 173Some college more than 1 year, no degree: 445Associate degree: 356Bachelor's degree: 2,408Master's degree: 2,237Professional school degree: 622Doctorate degree: 395
Housing units in structures:
One, detached: 5,655One, attached: 633Two: 5623 or 4: 3615 to 9: 32710 to 19: 36120 to 49: 42350 or more: 204Mobile homes: 17Housing units lacking complete plumbing facilities in 2022: 0.2%Housing units lacking complete kitchen facilities in 2022: 0.8%House/condo owner moved in on average 13 years ago
Renter moved in on average 1 years ago
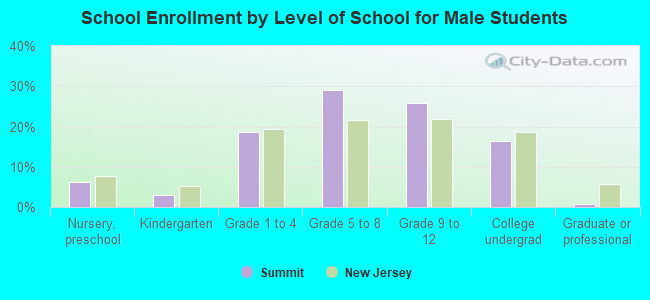
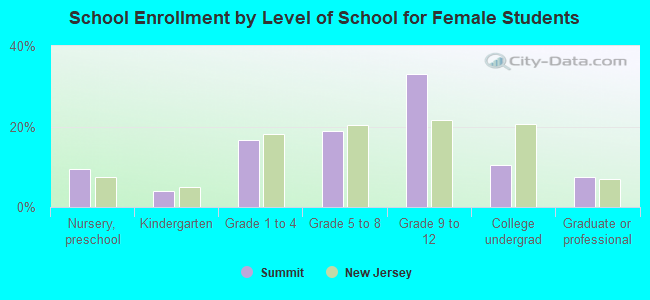
Private vs. public school enrollment:
Students in private schools in grades 1 to 8 (elementary and middle school): 377 Here:
14.2%New Jersey:
12.3%
Students in private schools in grades 9 to 12 (high school): 480 Here:
25.7%New Jersey:
13.1%
Students in private undergraduate colleges: 325 Here:
38.4%New Jersey:
33.2%