Housing density: 2,507 houses/condos per square mile
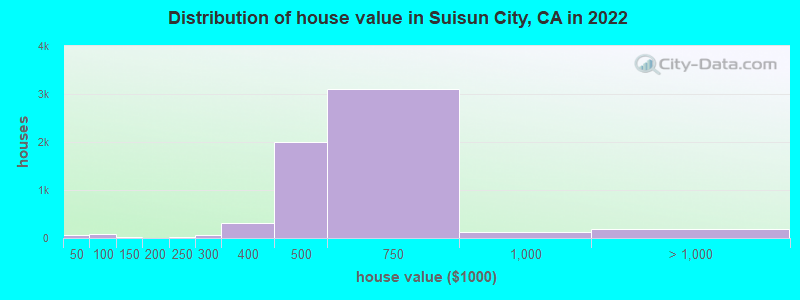
Median price asked for vacant for-sale houses and condos in 2022: $1,328,140.
Median contract rent in 2022: $1,824 (lower quartile is $1,307, upper quartile is over $2,000)
Median rent asked for vacant for-rent units in 2022: $3,209
Median gross rent in Suisun City, CA in 2022: over $2,000
Housing units in Suisun City with a mortgage: 4,989 (415 second mortgage, 0 home equity loan, 327 both second mortgage and home equity loan) Houses without a mortgage: 0
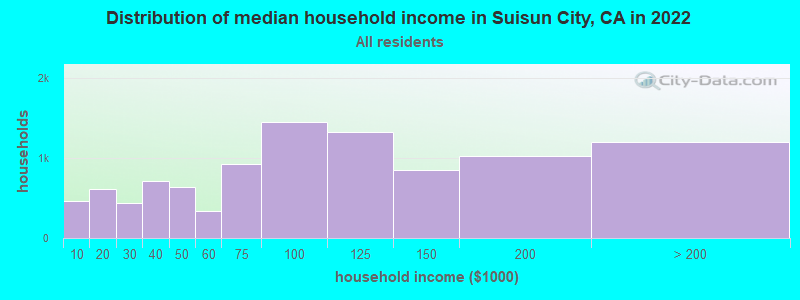
Median household income for houses/condos with a mortgage: $95,556
Median household income for apartments without a mortgage: $76,371
Median monthly housing costs: $2,077
Compare current foreclosures near Suisun City, CA:
3,902 married couples with children.
1,857 single-parent households (489 men, 1,368 women).
66.7% of residents of Suisun City speak English at home.
16.8% of residents speak Spanish at home (59% speak English very well, 24% speak English well, 12% speak English not well, 4% don't speak English at all).
1.5% of residents speak other Indo-European language at home (53% speak English very well, 47% speak English well).
13.5% of residents speak Asian or Pacific Island language at home (61% speak English very well, 33% speak English well, 5% speak English not well, 1% don't speak English at all).
0.3% of residents speak other language at home (46% speak English very well, 54% speak English well).
Foreign born population: 6,115 (20.9%)
(66.1% of them are naturalized citizens)
Percentage of workers working in this county: 61.7% Number of people working at home: 1,027 (7.6% of all workers)
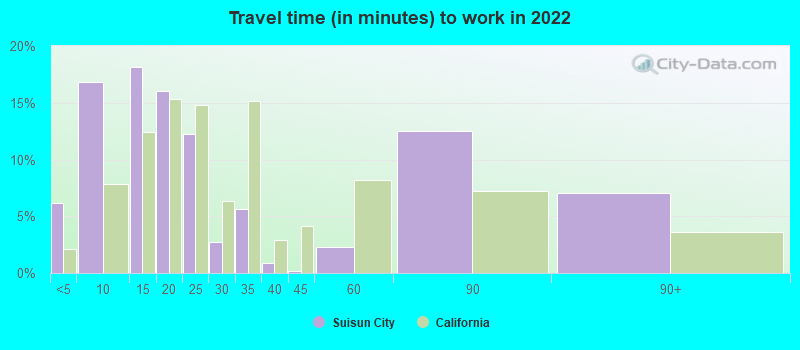
Travel time to work (commute)
Less than 5 minutes: 194
5 to 9 minutes: 973
10 to 14 minutes: 1,570
15 to 19 minutes: 1,691
20 to 24 minutes: 1,277
25 to 29 minutes: 522
30 to 34 minutes: 1,425
35 to 39 minutes: 429
40 to 44 minutes: 435
45 to 59 minutes: 1,058
60 to 89 minutes: 1,683
90 or more minutes: 772
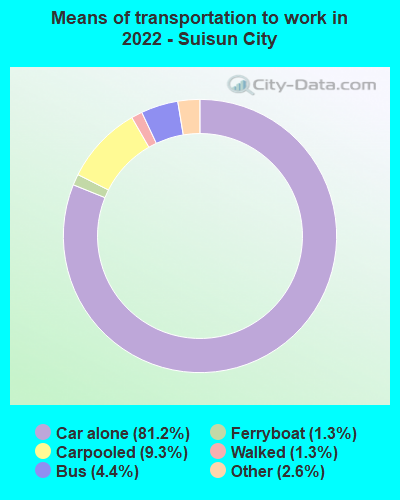
Means of transportation to work:
Drove a car alone: 1,567 (55.4%)
Carpooled: 215 (7.6%)
Bus: 72 (2.5%)
Ferryboat: 29 (1.0%)
Taxi: 45 (1.6%)
Walked: 21 (0.7%)
Worked at home: 1,027 (36.3%)
Unemployment by race in 2022
Unemployment rate for White non-Hispanic residents
7.4%Males
0.6%Females
Unemployment rate for Black residents
18.7%Males
4.7%Females
Unemployment rate for Asian residents
2.5%Males
5.2%Females
Unemployment rate for other race residents
10.8%Males
Unemployment rate for two or more race residents
11.0%Males
4.4%Females
Unemployment rate for Hispanic or Latino residents
12.5%Males
1.5%Females
Year of entry for the foreign-born population in Suisun City, California
1,0002010 or later
1,1662000 to 2009
1,1281990 to 1999
1,7921980 to 1989
1,0981970 to 1979
969Before 1970
First ancestries reported:
European: 936 (5.4%)
African: 910 (5.3%)
American: 731 (4.3%)
German: 347 (2.0%)
English: 286 (1.7%)
Irish: 233 (1.4%)
Italian: 145 (0.8%)
Portuguese: 140 (0.8%)
Palestinian: 86 (0.5%)
French: 86 (0.5%)
Scotch-Irish: 75 (0.4%)
Swedish: 64 (0.4%)
Polish: 45 (0.3%)
Lithuanian: 43 (0.3%)
Scottish: 37 (0.2%)
Jamaican: 33 (0.2%)
Trinidadian and Tobagonian: 31 (0.2%)
British: 28 (0.2%)
Dutch: 25 (0.1%)
French Canadian: 25 (0.1%)
Norwegian: 25 (0.1%)
Russian: 21 (0.1%)
Czech: 17 (0.10%)
Ukrainian: 16 (0.09%)
Ethiopian: 13 (0.08%)
Finnish: 12 (0.07%)
Eastern European: 11 (0.06%)
Iranian: 11 (0.06%)
Slovak: 11 (0.06%)
Nigerian: 8 (0.05%)
Sudanese: 6 (0.03%)
Most common places of birth for foreign-born residents (%):
Philippines
Suisun City:
40.4% (2,350)
California:
7.8% (818,297)
Mexico
Suisun City:
29.1% (1,694)
California:
37.2% (3,881,193)
Vietnam
Suisun City:
2.9% (168)
California:
4.9% (512,335)
Nicaragua
Suisun City:
2.8% (163)
California:
0.6% (58,161)
Japan
Suisun City:
2.6% (154)
California:
1.0% (103,575)
El Salvador
Suisun City:
2.4% (140)
California:
4.2% (440,287)
Fiji
Suisun City:
2.0% (117)
California:
0.3% (33,937)
Hong Kong
Suisun City:
1.6% (92)
California:
1.0% (105,215)
Place of birth for U.S.-born residents:
This state: 17,908
Other state: 4,414
Northeast: 782
Midwest: 1,259
South: 1,656
West: 692
94.3% of Suisun City residents lived in the same house 1 years ago. Out of people who lived in different houses, 28.7% lived in this county. Out of people who lived in different counties, 76.3% lived in California.
Suisun City:
94.3%
State average:
88.9%
Education attainment for males 25 years and older:
No schooling: 304
Nursery to 4th grade: 0
5th and 6th grade: 88
7th and 8th grade: 69
9th grade: 68
10th grade: 80
11th grade: 118
12th grade, no diploma: 389
High school graduate (or equivalency): 3,126
Less than 1 year of college: 780
Some college more than 1 year, no degree: 1,569
Associate degree: 968
Bachelor's degree: 1,422
Master's degree: 188
Professional school degree: 81
Doctorate degree: 12
Education attainment for females 25 years and older:
No schooling: 347
Nursery to 4th grade: 94
5th and 6th grade: 42
7th and 8th grade: 39
9th grade: 65
10th grade: 97
11th grade: 85
12th grade, no diploma: 273
High school graduate (or equivalency): 2,857
Less than 1 year of college: 1,054
Some college more than 1 year, no degree: 1,511
Associate degree: 1,297
Bachelor's degree: 1,574
Master's degree: 610
Professional school degree: 68
Doctorate degree: 28
Housing units in structures:
One, detached: 7,928
One, attached: 281
Two: 30
3 or 4: 381
5 to 9: 357
10 to 19: 375
20 to 49: 264
50 or more: 360
Mobile homes: 45
Boats, RVs, vans, etc.: 29
House/condo owner moved in on average 13 years ago