Sudley, VA (Virginia) Houses and Residents
| Sudley: | $421,944 |
| Virginia: | $365,700 |
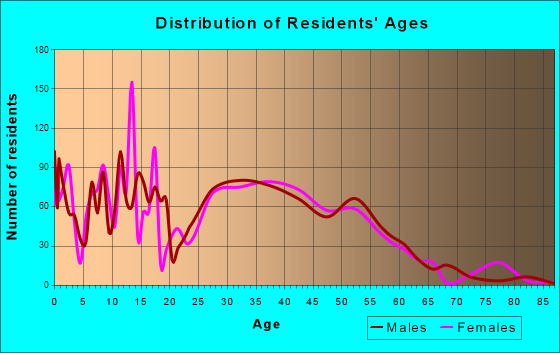
Total population: 16,203 (Urban population: 7,971, Rural population: 0)
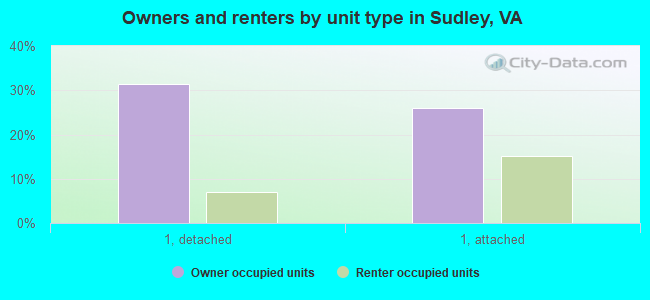
Houses: 5,839 (5,532 occupied: 3,345 owner occupied, 2,215 renter occupied)
| % of renters here: | 40% |
| State: | 33% |
Housing density: 3,737 houses/condos per square mile
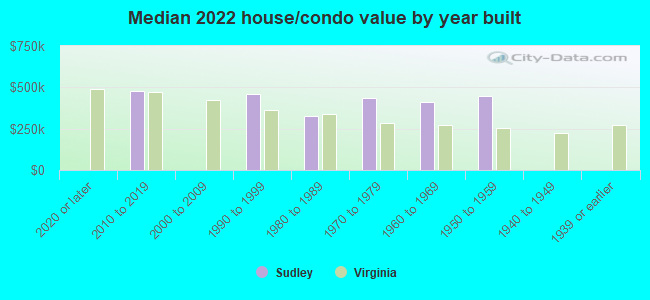
Median price asked for vacant for-sale houses and condos in 2022: $467,459.
Median contract rent in 2022: $1,730 (lower quartile is $1,477, upper quartile is $1,970)
Median rent asked for vacant for-rent units in 2022: $1,923
Median gross rent in Sudley, VA in 2022: $1,825
Housing units in Sudley with a mortgage: 2,708 (73 second mortgage, 2 home equity loan, 57 both second mortgage and home equity loan)
Houses without a mortgage: 0
Median household income for houses/condos with a mortgage: $98,534
Median household income for apartments without a mortgage: $108,961
Median monthly housing costs: $1,778
Compare current foreclosures near Sudley, VA:
| Photo | Address | Area | Beds / Baths | Price | Details |
|---|---|---|---|---|---|

|
#1
Marlow St
Gainesville, VA 20155
|
1,247 sq. feet
|
2 baths 2 beds |
show details | |

|
#2
Commonwealth Blvd
Fairfax, VA 22032
|
2,103 sq. feet
|
2 baths 4 beds |
show details | |

|
#3
Brazilnut Ct
Woodbridge, VA 22193
|
2,146 sq. feet
|
3 baths 3 beds |
show details | |

|
#4
Castle Harbor Way
Centreville, VA 20120
|
1,518 sq. feet
|
2 baths 3 beds |
show details | |

|
#5
Kimilwick Pl
Bristow, VA 20136
|
3,983 sq. feet
|
2 baths 4 beds |
show details | |

|
#6
Arkansas Ave
Herndon, VA 20170
|
1,025 sq. feet
|
1 baths 3 beds |
show details | |

|
#7
Cypress Tree Pl
Herndon, VA 20170
|
1,456 sq. feet
|
2 baths 3 beds |
show details | |

|
#8
Dubois Ct
Woodbridge, VA 22193
|
1,356 sq. feet
|
2 baths 4 beds |
show details | |

|
#9
Counsellor Dr
Vienna, VA 22181
|
1,916 sq. feet
|
2 baths 5 beds |
show details | |

|
#10
Prince William St
Manassas, VA 20110
|
- sq. feet
|
1 baths 4 beds |
show details |
| Photo | Address | Area | Beds / Baths | Price | Details |
|---|---|---|---|---|---|

|
#11
Knollwood Dr
Manassas, VA 20111
|
3,172 sq. feet
|
3 baths 4 beds |
show details | |

|
#12
Glade Bank Dr
Manassas, VA 20111
|
1,942 sq. feet
|
3 baths 4 beds |
show details | |

|
#13
Lee Hwy
Warrenton, VA 20187
|
- sq. feet
|
3 baths 4 beds |
show details | |

|
#14
Reese Ct
Warrenton, VA 20187
|
3,004 sq. feet
|
5 baths 4 beds |
show details | |

|
#15
Doulton Ct
Fairfax, VA 22032
|
2,551 sq. feet
|
4 baths 5 beds |
show details | |

|
#16
Antiopi St
Annandale, VA 22003
|
2,505 sq. feet
|
2 baths 4 beds |
show details | |

|
#17
Moore Dr
Manassas, VA 20111
|
1,872 sq. feet
|
1 baths 3 beds |
show details | |

|
#18
Kincheloe Rd
Clifton, VA 20124
|
4,492 sq. feet
|
4 baths 5 beds |
show details | |

|
#19
Mathews Dr
Woodbridge, VA 22191
|
1,523 sq. feet
|
1 baths 4 beds |
show details | |

|
#20
Moonbeam Dr
Woodbridge, VA 22193
|
1,980 sq. feet
|
2 baths 4 beds |
show details |
| Photo | Address | Area | Beds / Baths | Price | Details |
|---|---|---|---|---|---|

|
#21
Cocquina Dr
Reston, VA 20191
|
996 sq. feet
|
3 baths 6 beds |
show details | |

|
#22
Rockton Ct
Centreville, VA 20121
|
1,440 sq. feet
|
2 baths 3 beds |
show details | |

|
#23
Burdett Rd
Burke, VA 22015
|
1,232 sq. feet
|
2 baths 3 beds |
show details | |

|
#24
Culpeper Dr
Woodbridge, VA 22191
|
1,224 sq. feet
|
3 baths 4 beds |
show details | |

|
#25
Gardenview Loop
Woodbridge, VA 22191
|
1,110 sq. feet
|
2 baths 2 beds |
show details | |

|
#26
Tamberly Lane
Manassas, VA 20111
|
- sq. feet
|
2 baths 4 beds |
show details | |

|
#27
New Braddock Rd
Centreville, VA 20121
|
1,372 sq. feet
|
2 baths 3 beds |
show details | |

|
#28
Stonepath Cir
Centreville, VA 20120
|
1,452 sq. feet
|
4 baths 4 beds |
show details | |

|
#29
Saddlehorn Ct
Burke, VA 22015
|
1,138 sq. feet
|
2 baths 3 beds |
show details | |

|
#30
Springbrook Ct
Woodbridge, VA 22193
|
1,428 sq. feet
|
2 baths 3 beds |
show details |
| Photo | Address | Area | Beds / Baths | Price | Details |
|---|---|---|---|---|---|

|
#31
Lakewood Dr
Woodbridge, VA 22192
|
2,038 sq. feet
|
2 baths 4 beds |
show details | |

|
#32
Carolyn Forest Dr
Woodbridge, VA 22192
|
1,593 sq. feet
|
2 baths 2 beds |
show details | |

|
#33
Canfield Ter
Sterling, VA 20164
|
1,680 sq. feet
|
3 baths 3 beds |
show details | |

|
#34
Duck Pond Ter
Manassas, VA 20111
|
1,546 sq. feet
|
3 baths 3 beds |
show details | |

|
#35
Collis Oak Ct
Fairfax, VA 22033
|
1,362 sq. feet
|
3 baths 3 beds |
show details | |

|
#36
Scotch Heather Pl
Woodbridge, VA 22192
|
2,716 sq. feet
|
2 baths 3 beds |
show details | |

|
#37
Rolling Spring Ct
Springfield, VA 22152
|
3,365 sq. feet
|
4 baths 4 beds |
show details | |

|
#38
Pearl Fog Way
Dunn Loring, VA 22027
|
3,497 sq. feet
|
4 baths 4 beds |
show details | |

|
#39
Monitor Ct
Manassas, VA 20109
|
1,829 sq. feet
|
2 baths 3 beds |
show details | |

|
#40
Portsmouth Rd
Manassas, VA 20109
|
1,785 sq. feet
|
3 baths 3 beds |
show details |
| Photo | Address | Area | Beds / Baths | Price | Details |
|---|---|---|---|---|---|

|
#41
Vernon St
Manassas, VA 20109
|
1,280 sq. feet
|
2 baths 3 beds |
show details | |

|
#42
Pollen St
Lorton, VA 22079
|
1,052 sq. feet
|
2 baths 3 beds |
show details | |

|
#43
Lyceum Ln
Manassas, VA 20112
|
4,911 sq. feet
|
3 baths 4 beds |
show details | |

|
#44
Damascus Dr
Manassas, VA 20109
|
1,299 sq. feet
|
2 baths 4 beds |
show details | |

|
#45
Willoughby Ct
Chantilly, VA 20151
|
950 sq. feet
|
2 baths 4 beds |
show details | |

|
#46
Graysons Mill Ln
Lorton, VA 22079
|
2,961 sq. feet
|
2 baths 4 beds |
show details | |

|
#47
Lee Landing Dr
Falls Church, VA 22043
|
900 sq. feet
|
1 baths 2 beds |
show details | |

|
#48
Lakeland Dr
Sterling, VA 20164
|
2,143 sq. feet
|
2 baths 3 beds |
show details | |

|
#49
Cerromar Way
Gainesville, VA 20155
|
1,680 sq. feet
|
3 baths 3 beds |
show details | |

|
Check over 1 million property listings on Foreclosure.com!
|
browse all offers | |||


 | Apartments in/around Manassas under $1500/mo (1 reply) |
| Moving to Bristow/Gainesville (15 replies) |
| Safe/clean/quiet areas of Manassas or similar? (30 replies) |
| Underground rumbling in Bristow (2 replies) |
| Moving to Gainesville/Haymarket/Bristow area (7 replies) |
| Apartment Hunting in Manassas area ... suggestions please! (10 replies) |
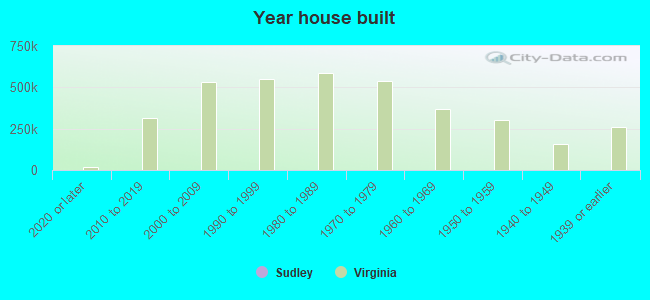
Median year apartment built: 1981
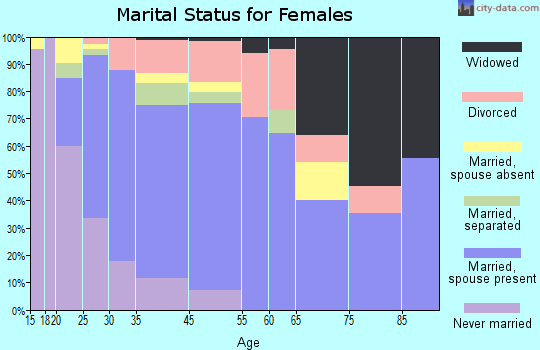
Household type by relationship:
Households: 19,522- Male householders: 3,158 (565 living alone), Female householders: 2,321 (720 living alone)
2,689 spouses (2,689 opposite-sex spouses), 491 unmarried partners, (491 opposite-sex unmarried partners), 5,994 children (5,573 natural, 243 adopted, 177 stepchildren), 629 grandchildren, 619 brothers or sisters, 987 parents, 0 foster children, 830 other relatives, 1,750 non-relatives
- In group quarters: 47
Size of family households: 813 2-persons, 789 3-persons, 960 4-persons, 691 5-persons, 371 6-persons, 268 7-or-more-persons.
Size of nonfamily households: 1,359 1-person, 85 2-persons, 58 3-persons, 78 4-persons, 59 6-persons.
2,590 married couples with children.
1,591 single-parent households (600 men, 991 women).
34.5% of residents of Sudley speak English at home.
47.7% of residents speak Spanish at home (51% speak English very well, 15% speak English well, 22% speak English not well, 11% don't speak English at all).
9.3% of residents speak other Indo-European language at home (52% speak English very well, 36% speak English well, 8% speak English not well, 4% don't speak English at all).
4.0% of residents speak Asian or Pacific Island language at home (41% speak English very well, 29% speak English well, 29% speak English not well, 1% don't speak English at all).
3.9% of residents speak other language at home (77% speak English very well, 23% speak English well).
Foreign born population: 9,180 (47.0%)
(45.9% of them are naturalized citizens)
| Here: | 7.0 |
| State: | 7.0 |
| Here: | 4.8 |
| State: | 4.3 |
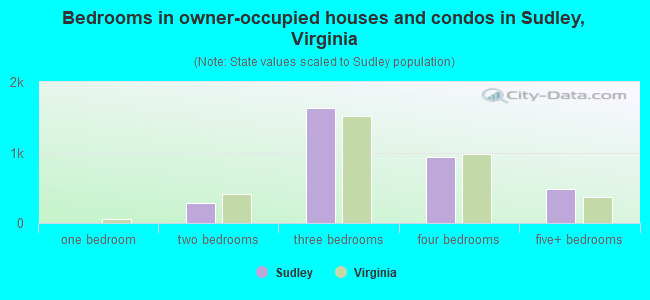
- Bedrooms in owner-occupied houses and condos in Sudley, Virginia
- 0no bedroom
- 51 bedroom
- 2902 bedrooms
- 1,6273 bedrooms
- 9404 bedrooms
- 4855+ bedrooms
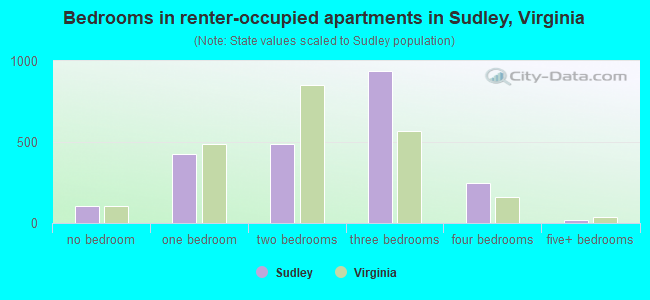
- Bedrooms in renter-occupied apartments in Sudley, Virginia
- 103no bedroom
- 4261 bedroom
- 4852 bedrooms
- 9393 bedrooms
- 2444 bedrooms
- 185+ bedrooms
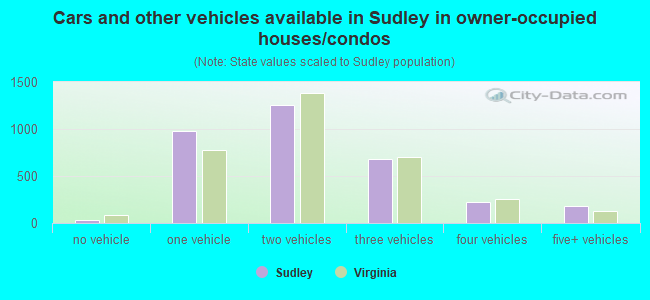
- Cars and other vehicles available in Sudley in owner-occupied houses/condos
- 30no vehicle
- 9831 vehicle
- 1,2562 vehicles
- 6773 vehicles
- 2204 vehicles
- 1815+ vehicles
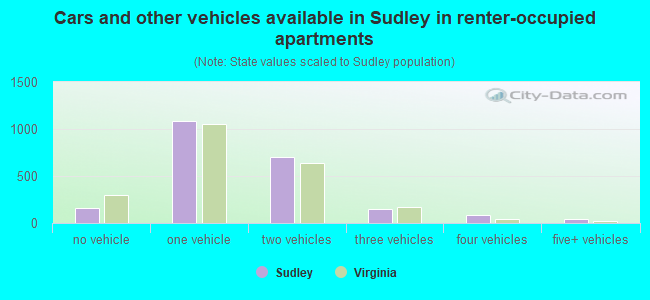
- Cars and other vehicles available in Sudley in renter-occupied apartments
- 156no vehicle
- 1,0881 vehicle
- 6992 vehicles
- 1493 vehicles
- 824 vehicles
- 415+ vehicles
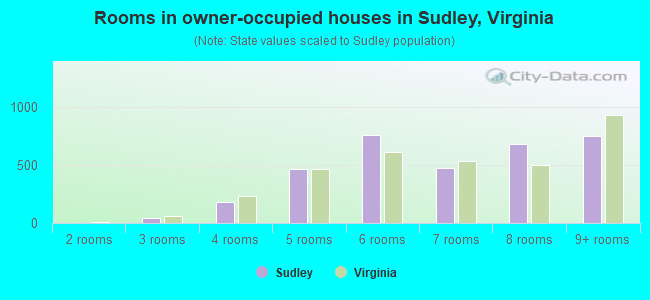
- Rooms in owner-occupied houses in Sudley, Virginia
- 01 room
- 02 rooms
- 463 rooms
- 1804 rooms
- 4615 rooms
- 7606 rooms
- 4747 rooms
- 6778 rooms
- 7489+ rooms
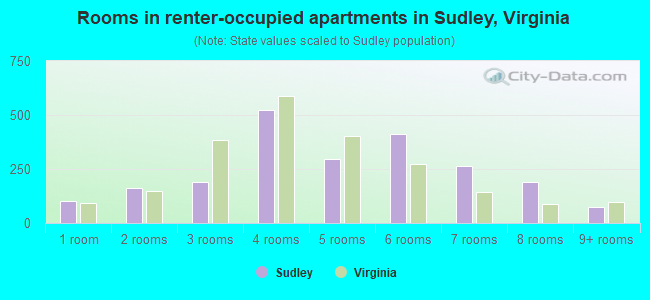
- Rooms in renter-occupied apartments in Sudley, Virginia
- 1031 room
- 1622 rooms
- 1883 rooms
- 5254 rooms
- 2945 rooms
- 4146 rooms
- 2667 rooms
- 1888 rooms
- 769+ rooms
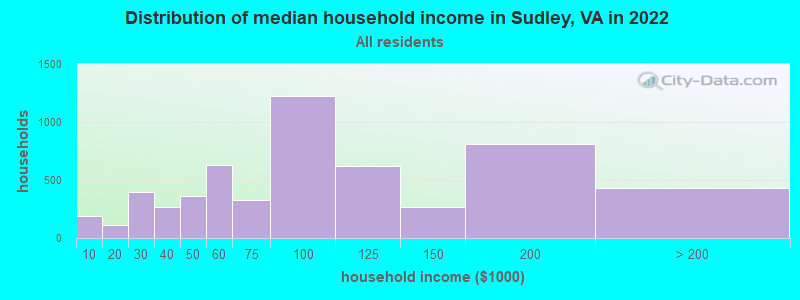
Sudley, VA household income distribution

- 187Less than $10,000
- 110$10,000 to $19,999
- 393$20,000 to $29,999
- 269$30,000 to $39,999
- 363$40,000 to $49,999
- 629$50,000 to $59,999
- 331$60,000 to $74,999
- 1,224$75,000 to $99,999
- 617$100,000 to $124,999
- 271$125,000 to $149,999
- 810$150,000 to $199,999
- 435$200,000 or more
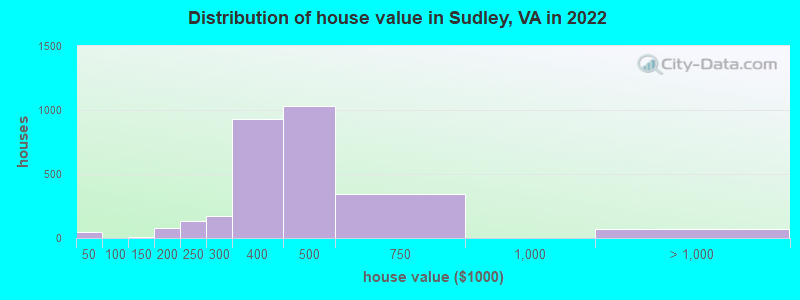
Home value of owner - occupied houses in 2022 in Sudley, VA
-
- 15Less than $10,000
- 19$10,000 to $14,999
- 8$25,000 to $29,999
- 11$125,000 to $149,999
- 30$150,000 to $174,999
- 51$175,000 to $199,999
- 129$200,000 to $249,999
- 169$250,000 to $299,999
- 927$300,000 to $399,999
- 1,033$400,000 to $499,999
- 342$500,000 to $749,999
- 34$1,000,000 to $1,499,999
- 36$2,000,000 or more
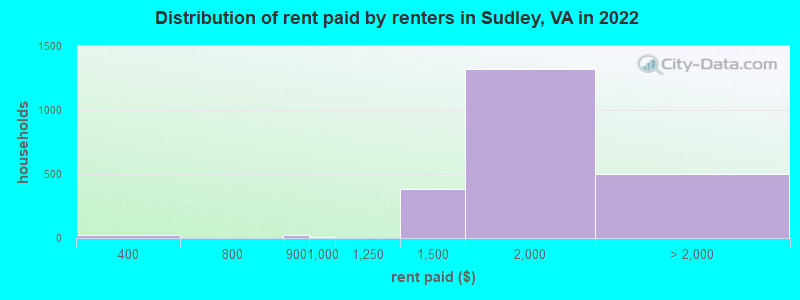
Rent paid by renters in 2022 in Sudley, VA
-
- 20$300 to $349
- 5$350 to $399
- 20$800 to $899
- 11$900 to $999
- 382$1,250 to $1,499
- 1,323$1,500 to $1,999
- 411$2,000 to $2,499
- 30$2,500 to $2,999
- 10$3,500 or more
- 45No cash rent
Percentage of workers working in this county: 52.8%
Number of people working at home: 1,213 (12.5% of all workers)
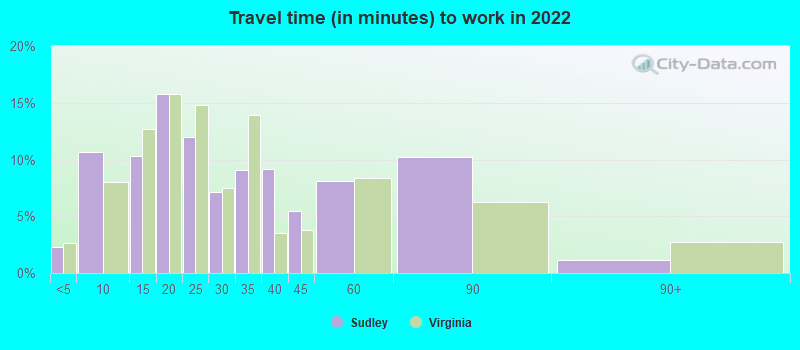
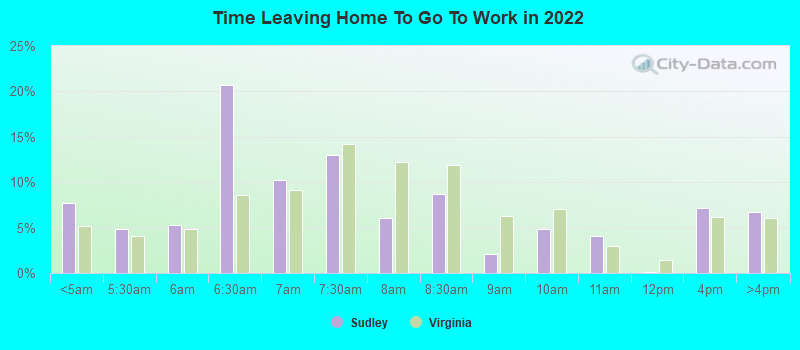
Travel time to work (commute)
- Less than 5 minutes: 523
- 5 to 9 minutes: 403
- 10 to 14 minutes: 1,007
- 15 to 19 minutes: 1,489
- 20 to 24 minutes: 629
- 25 to 29 minutes: 355
- 30 to 34 minutes: 959
- 35 to 39 minutes: 496
- 40 to 44 minutes: 786
- 45 to 59 minutes: 620
- 60 to 89 minutes: 1,053
- 90 or more minutes: 228
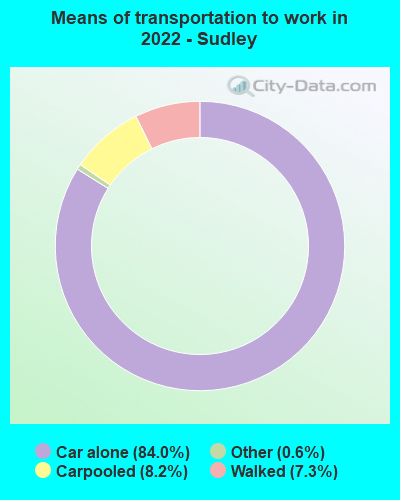
Means of transportation to work:
- Drove a car alone: 2,174 (57.6%)
- Carpooled: 210 (5.6%)
- Taxi: 21 (0.6%)
- Walked: 179 (4.7%)
- Worked at home: 1,213 (32.1%)
- Unemployment by race in 2022
- Unemployment rate for White non-Hispanic residents
- 1.8%Males
- 2.3%Females
- Unemployment rate for Black residents
- 4.6%Males
- Unemployment rate for Asian residents
- 14.7%Males
- 10.1%Females
- Unemployment rate for other race residents
- 2.5%Males
- Unemployment rate for two or more race residents
- 1.3%Males
- 2.2%Females
- Unemployment rate for Hispanic or Latino residents
- 3.3%Males
- 1.5%Females
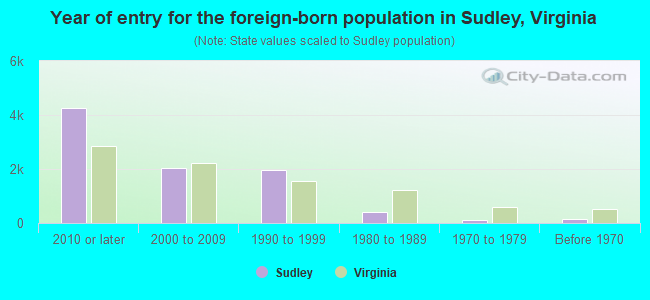
- Year of entry for the foreign-born population in Sudley, Virginia
- 4,2752010 or later
- 2,0542000 to 2009
- 1,9781990 to 1999
- 3911980 to 1989
- 1211970 to 1979
- 130Before 1970
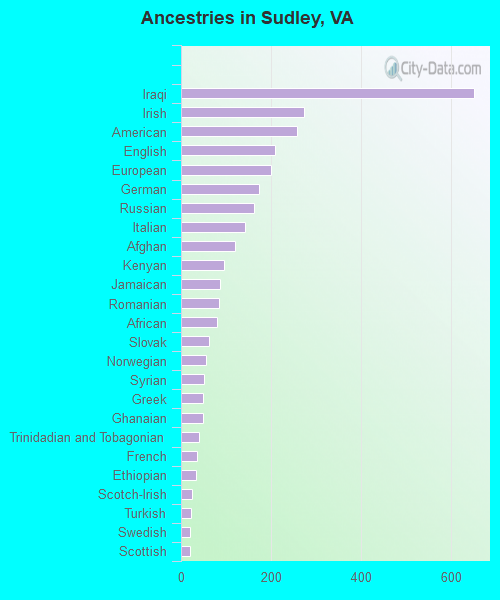
First ancestries reported:
- Iraqi: 651 (4.9%)
- Irish: 274 (2.1%)
- American: 257 (1.9%)
- English: 208 (1.6%)
- European: 200 (1.5%)
- German: 172 (1.3%)
- Russian: 161 (1.2%)
- Italian: 141 (1.1%)
- Afghan: 120 (0.9%)
- Kenyan: 95 (0.7%)
- Jamaican: 87 (0.7%)
- Romanian: 85 (0.6%)
- African: 80 (0.6%)
- Slovak: 63 (0.5%)
- Norwegian: 56 (0.4%)
- Syrian: 51 (0.4%)
- Greek: 48 (0.4%)
- Ghanaian: 48 (0.4%)
- Trinidadian and Tobagonian: 41 (0.3%)
- French: 35 (0.3%)
- Ethiopian: 34 (0.3%)
- Scotch-Irish: 25 (0.2%)
- Turkish: 23 (0.2%)
- Swedish: 21 (0.2%)
- Scottish: 19 (0.1%)
- British West Indian: 15 (0.1%)
- Sudanese: 13 (0.10%)
- Jordanian: 10 (0.08%)
- Polish: 7 (0.05%)
Most common places of birth for foreign-born residents (%):
| Sudley: | 21.9% (2,086) |
| Virginia: | 9.9% (107,534) |
| Sudley: | 12.4% (1,182) |
| Virginia: | 3.3% (35,938) |
| Sudley: | 10.6% (1,006) |
| Virginia: | 5.3% (57,498) |
| Sudley: | 6.2% (586) |
| Virginia: | 9.0% (97,830) |
| Sudley: | 4.8% (460) |
| Virginia: | 3.0% (32,892) |
| Sudley: | 4.5% (426) |
| Virginia: | 2.4% (26,366) |
| Sudley: | 3.7% (356) |
| Virginia: | 0.9% (9,351) |
| Sudley: | 3.0% (284) |
| Virginia: | 0.9% (9,695) |
| Sudley: | 2.6% (252) |
| Virginia: | 0.4% (4,715) |
| Sudley: | 2.3% (219) |
| Virginia: | 0.9% (9,440) |
| Sudley: | 1.8% (174) |
| Virginia: | 1.1% (12,049) |
| Sudley: | 1.8% (170) |
| Virginia: | 1.8% (19,426) |
| Sudley: | 1.6% (148) |
| Virginia: | 0.6% (6,916) |
| Sudley: | 1.5% (146) |
| Virginia: | 0.1% (853) |
Place of birth for U.S.-born residents:
- This state: 6,105
- Other state: 3,573
- Northeast: 1,141
- Midwest: 349
- South: 1,651
- West: 391
80.9% of Sudley residents lived in the same house 1 years ago.
Out of people who lived in different houses, 29.3% lived in this county.
Out of people who lived in different counties, 68.1% lived in Virginia.
| Sudley: | 80.9% |
| State average: | 86.6% |
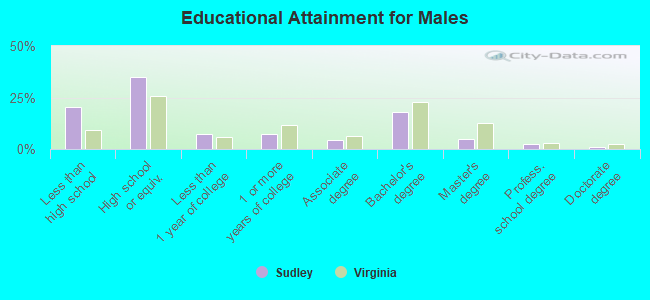
Education attainment for males 25 years and older:
- No schooling: 227
- Nursery to 4th grade: 118
- 5th and 6th grade: 562
- 7th and 8th grade: 95
- 9th grade: 333
- 10th grade: 0
- 11th grade: 0
- 12th grade, no diploma: 61
- High school graduate (or equivalency): 2,410
- Less than 1 year of college: 500
- Some college more than 1 year, no degree: 491
- Associate degree: 289
- Bachelor's degree: 1,222
- Master's degree: 328
- Professional school degree: 166
- Doctorate degree: 59
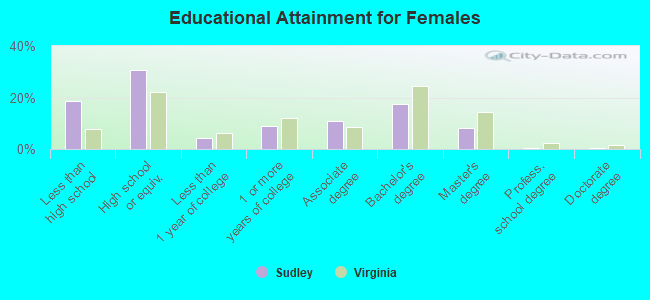
Education attainment for females 25 years and older:
- No schooling: 302
- Nursery to 4th grade: 206
- 5th and 6th grade: 149
- 7th and 8th grade: 118
- 9th grade: 64
- 10th grade: 66
- 11th grade: 24
- 12th grade, no diploma: 168
- High school graduate (or equivalency): 1,797
- Less than 1 year of college: 256
- Some college more than 1 year, no degree: 532
- Associate degree: 627
- Bachelor's degree: 1,026
- Master's degree: 481
- Professional school degree: 31
- Doctorate degree: 22
Housing units in structures:
- One, detached: 2,325
- One, attached: 2,249
- 3 or 4: 10
- 5 to 9: 263
- 10 to 19: 716
- 20 to 49: 37
- 50 or more: 237
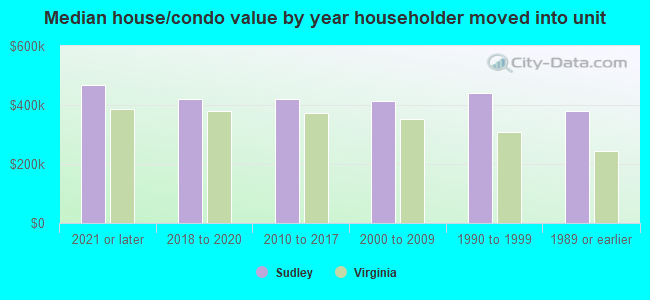
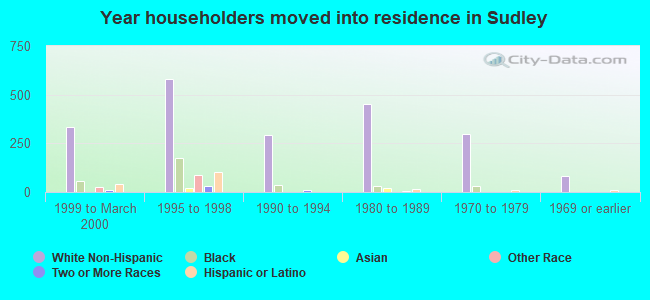
House/condo owner moved in on average 9 years ago
Renter moved in on average 1 years ago
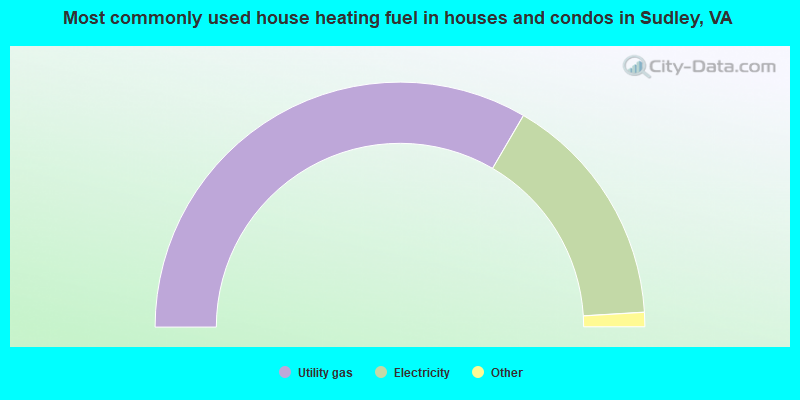
- 66.9%Utility gas
- 31.3%Electricity
- 1.0%Bottled, tank, or LP gas
- 0.8%No fuel used
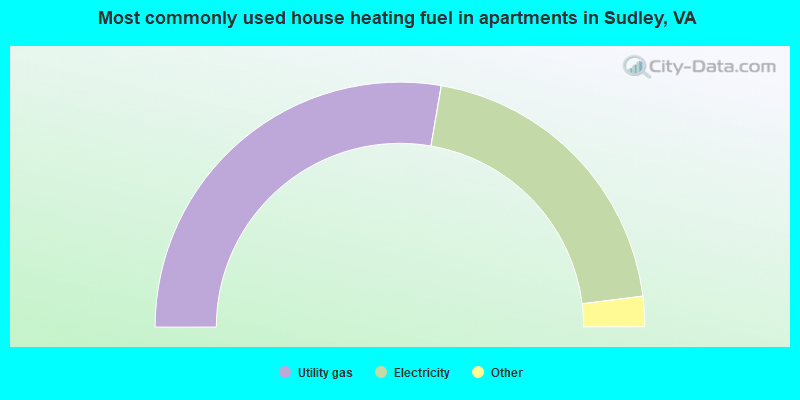
- 55.4%Utility gas
- 40.6%Electricity
- 3.7%Bottled, tank, or LP gas
- 0.2%No fuel used
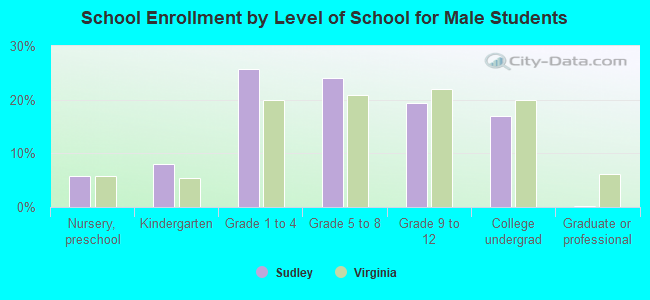
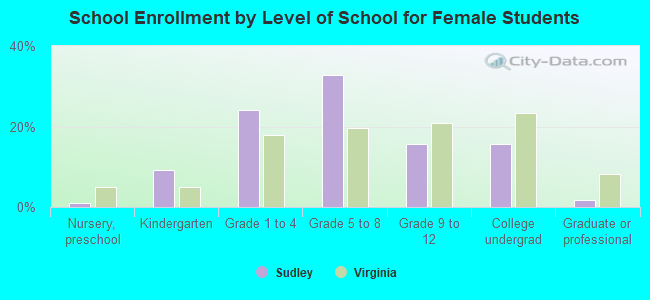
Private vs. public school enrollment:
| Here: | 0.2% |
| Virginia: | 13.2% |
| Here: | 3.6% |
| Virginia: | 10.2% |
| Here: | 4.9% |
| Virginia: | 18.7% |