Stuart, VA (Virginia) Houses and Residents
| Stuart: | $179,406 |
| Virginia: | $365,700 |
Total population: 1,455 (Urban population: 0, Rural population: 942 (all nonfarm))
Houses: 669 (546 occupied: 271 owner occupied, 281 renter occupied)
| % of renters here: | 51% |
| State: | 33% |
Housing density: 906 houses/condos per square mile
Median price asked for vacant for-sale houses and condos in 2022: $365,864.
Median contract rent in 2022: $417 (lower quartile is $269, upper quartile is $483)
Median rent asked for vacant for-rent units in 2022: $591
Median gross rent in Stuart, VA in 2022: $504
Housing units in Stuart with a mortgage: 124 (31 second mortgage, 0 home equity loan, 30 both second mortgage and home equity loan)
Houses without a mortgage: 0
Median household income for houses/condos with a mortgage: $77,239
Median household income for apartments without a mortgage: $59,335
Median monthly housing costs: $508
Compare current foreclosures near Stuart, VA:
| Photo | Address | Area | Beds / Baths | Price | Details |
|---|---|---|---|---|---|

|
#1
Martin Farm Rd
Stuart, VA 24171
|
- sq. feet
|
2 baths 2 beds |
show details | |

|
#2
Bob White Rd
Stuart, VA 24171
|
- sq. feet
|
- baths - beds |
show details | |

|
#3
Golf Course Rd
Stuart, VA 24171
|
- sq. feet
|
- baths - beds |
show details | |

|
#4
Trail Rd
Stuart, VA 24171
|
- sq. feet
|
- baths - beds |
show details | |

|
#5
Jeb Stuart Hwy
Stuart, VA 24171
|
- sq. feet
|
- baths - beds |
show details | |

|
#6
Corns Rd
Stuart, VA 24171
|
- sq. feet
|
- baths - beds |
show details | |

|
#7
Jessica Ave
Bassett, VA 24055
|
1,188 sq. feet
|
2 baths 3 beds |
show details | |

|
#8
Healms Rd
Bassett, VA 24055
|
- sq. feet
|
1 baths 3 beds |
show details | |

|
#9
Frye Rd
Westfield, NC 27053
|
2,119 sq. feet
|
2 baths 3 beds |
show details | |

|
#10
Lankford Rd
Lawsonville, NC 27022
|
1,248 sq. feet
|
2 baths 3 beds |
show details |
| Photo | Address | Area | Beds / Baths | Price | Details |
|---|---|---|---|---|---|

|
#11
Willis Rd
Meadows Of Dan, VA 24120
|
- sq. feet
|
2 baths 3 beds |
show details | |

|
#12
Egg Farm Rd
Patrick Springs, VA 24133
|
- sq. feet
|
1 baths 2 beds |
show details | |

|
#13
Blue Hollow Rd
Mount Airy, NC 27030
|
- sq. feet
|
2 baths 3 beds |
show details | |

|
#14
Cory Trl
Mount Airy, NC 27030
|
- sq. feet
|
2 baths 3 beds |
show details | |

|
#15
E Pine St
Mount Airy, NC 27030
|
- sq. feet
|
1 baths 2 beds |
show details | |

|
#16
Marshall Johnson Rd
Pilot Mountain, NC 27041
|
- sq. feet
|
2 baths 3 beds |
show details | |

|
#17
Road
Westfield, NC 27053
|
- sq. feet
|
- baths - beds |
show details | |

|
#18
Doe Run Rd
Ararat, VA 24053
|
- sq. feet
|
- baths - beds |
show details | |

|
#19
Long Mountain Rd SW
Willis, VA 24380
|
- sq. feet
|
- baths - beds |
show details | |

|
#20
Flamingo Rd
Bassett, VA 24055
|
- sq. feet
|
- baths - beds |
show details |
| Photo | Address | Area | Beds / Baths | Price | Details |
|---|---|---|---|---|---|

|
#21
Perry Bowman Rd
Ararat, VA 24053
|
- sq. feet
|
- baths - beds |
show details | |

|
#22
King Rd
Westfield, NC 27053
|
- sq. feet
|
- baths - beds |
show details | |

|
#23
Antler Pt
Hillsville, VA 24343
|
- sq. feet
|
- baths - beds |
show details | |

|
#24
Westland Dr
Martinsville, VA 24112
|
- sq. feet
|
- baths - beds |
show details | |

|
#25
Nc 89 Hwy E
Walnut Cove, NC 27052
|
- sq. feet
|
- baths - beds |
show details | |

|
#26
Old Well Rd
Spencer, VA 24165
|
- sq. feet
|
- baths - beds |
show details | |

|
#27
Crestview Dr
Bassett, VA 24055
|
- sq. feet
|
- baths - beds |
show details | |

|
#28
Highway 89 West
Westfield, NC 27053
|
- sq. feet
|
- baths - beds |
show details | |

|
#29
Maple Leaf Rd
Spencer, VA 24165
|
- sq. feet
|
- baths - beds |
show details | |

|
#30
Fletch Hall Rd
Sandy Ridge, NC 27046
|
- sq. feet
|
- baths - beds |
show details |
| Photo | Address | Area | Beds / Baths | Price | Details |
|---|---|---|---|---|---|

|
#31
Country Girl Trl
Mount Airy, NC 27030
|
- sq. feet
|
- baths - beds |
show details | |

|
#32
Morningside Dr
Bassett, VA 24055
|
- sq. feet
|
- baths - beds |
show details | |

|
#33
Amity Dr
Martinsville, VA 24112
|
- sq. feet
|
- baths - beds |
show details | |

|
#34
Fir Dr.
Danbury, NC 27016
|
- sq. feet
|
- baths - beds |
show details | |

|
#35
Youlan Dr
Bassett, VA 24055
|
- sq. feet
|
- baths - beds |
show details | |

|
#36
Moorefield Store Rd
Spencer, VA 24165
|
- sq. feet
|
- baths - beds |
show details | |

|
#37
Dobyns Rd
Claudville, VA 24076
|
- sq. feet
|
- baths - beds |
show details | |

|
#38
Honeysuckle Dr
Martinsville, VA 24112
|
- sq. feet
|
- baths - beds |
show details | |

|
#39
Al Philpott Hwy
Spencer, VA 24165
|
- sq. feet
|
- baths - beds |
show details | |

|
#40
Preston Rd
Martinsville, VA 24112
|
- sq. feet
|
- baths - beds |
show details |
| Photo | Address | Area | Beds / Baths | Price | Details |
|---|---|---|---|---|---|

|
#41
Huntington Hills Dr
Bassett, VA 24055
|
- sq. feet
|
- baths - beds |
show details | |

|
#42
Buffalo Mountain Rd SW
Willis, VA 24380
|
- sq. feet
|
- baths - beds |
show details | |

|
#43
Graceland Dr
Bassett, VA 24055
|
- sq. feet
|
- baths - beds |
show details | |

|
#44
George Taylor Rd
Spencer, VA 24165
|
- sq. feet
|
- baths - beds |
show details | |

|
#45
Hamilton Rd
Bassett, VA 24055
|
- sq. feet
|
- baths - beds |
show details | |

|
#46
Huntington Hills Dr
Bassett, VA 24055
|
- sq. feet
|
- baths - beds |
show details | |

|
#47
Fairystone Home Pl
Bassett, VA 24055
|
- sq. feet
|
- baths - beds |
show details | |

|
#48
Jeb Stuart Hwy
Spencer, VA 24165
|
- sq. feet
|
- baths - beds |
show details | |

|
#49
Grassy Creek Ln
Patrick Springs, VA 24133
|
- sq. feet
|
- baths - beds |
show details | |

|
Check over 1 million property listings on Foreclosure.com!
|
browse all offers | |||

Latest news about housing in Stuart, VA collected exclusively by city-data.com from local newspapers, TV, and radio stations

 | Apartments Purcellville to Winchester (3 replies) |
| where to look for a house with good schools??? (9 replies) |
| Apartments in/around Manassas under $1500/mo (1 reply) |
| Charlottesville downtown mall, as nice as the pictures? (57 replies) |
| Mini-Housing Bubble In NOVA? (153 replies) |
| Section 8 Apartments In Newport News (11 replies) |

Median year apartment built: 1976
Household type by relationship:
Households: 1,543- Male householders: 272 (123 living alone), Female householders: 268 (135 living alone)
166 spouses (166 opposite-sex spouses), 73 unmarried partners, (73 opposite-sex unmarried partners), 200 children (180 natural, 5 adopted, 15 stepchildren), 102 grandchildren, 2 brothers or sisters, 29 parents, 0 foster children, 2 other relatives, 3 non-relatives
- In group quarters: 422
Size of family households: 132 2-persons, 41 3-persons, 20 4-persons, 23 5-persons, 19 6-persons.
Size of nonfamily households: 267 1-person, 52 2-persons.
87 married couples with children.
56 single-parent households (3 men, 53 women).
94.8% of residents of Stuart speak English at home.
2.9% of residents speak Spanish at home (67% speak English very well, 7% speak English well, 26% speak English not well).
0.8% of residents speak other Indo-European language at home (58% speak English very well, 42% speak English well).
1.3% of residents speak Asian or Pacific Island language at home (89% speak English very well, 11% speak English well).
0.9% of residents speak other language at home (100% speak English very well).
Foreign born population: 49 (3.2%)
(38.8% of them are naturalized citizens)
| Here: | 7.0 |
| State: | 7.0 |
| Here: | 3.8 |
| State: | 4.3 |

- Bedrooms in owner-occupied houses and condos in Stuart, Virginia
- 0no bedroom
- 01 bedroom
- 402 bedrooms
- 1593 bedrooms
- 434 bedrooms
- 295+ bedrooms

- Bedrooms in renter-occupied apartments in Stuart, Virginia
- 0no bedroom
- 801 bedroom
- 1742 bedrooms
- 283 bedrooms
- 04 bedrooms
- 05+ bedrooms

- Cars and other vehicles available in Stuart in owner-occupied houses/condos
- 6no vehicle
- 441 vehicle
- 1332 vehicles
- 543 vehicles
- 294 vehicles
- 55+ vehicles

- Cars and other vehicles available in Stuart in renter-occupied apartments
- 104no vehicle
- 1201 vehicle
- 322 vehicles
- 163 vehicles
- 34 vehicles
- 65+ vehicles

- Rooms in owner-occupied houses in Stuart, Virginia
- 01 room
- 02 rooms
- 43 rooms
- 44 rooms
- 375 rooms
- 706 rooms
- 437 rooms
- 358 rooms
- 789+ rooms

- Rooms in renter-occupied apartments in Stuart, Virginia
- 01 room
- 332 rooms
- 473 rooms
- 1424 rooms
- 335 rooms
- 246 rooms
- 37 rooms
- 08 rooms
- 09+ rooms


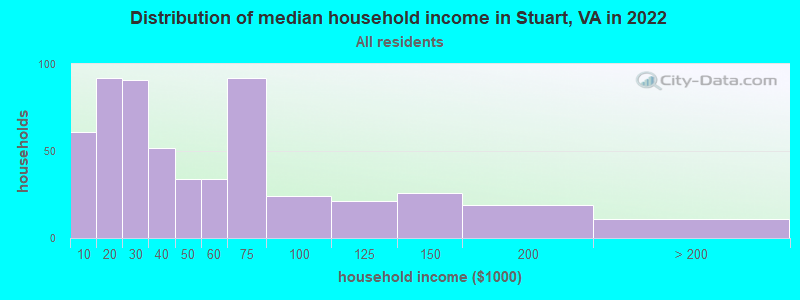
Stuart, VA household income distribution

- 61Less than $10,000
- 92$10,000 to $19,999
- 91$20,000 to $29,999
- 52$30,000 to $39,999
- 34$40,000 to $49,999
- 34$50,000 to $59,999
- 92$60,000 to $74,999
- 24$75,000 to $99,999
- 21$100,000 to $124,999
- 26$125,000 to $149,999
- 19$150,000 to $199,999
- 11$200,000 or more
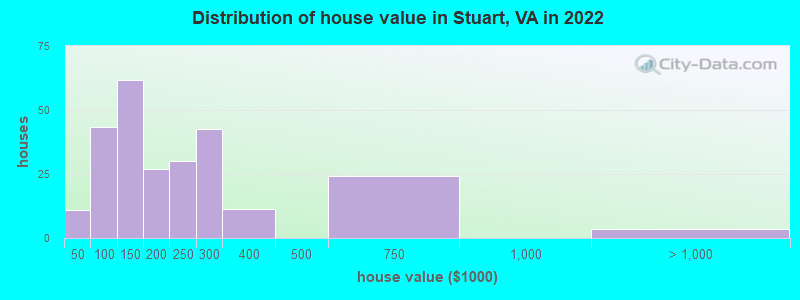
Home value of owner - occupied houses in 2022 in Stuart, VA
-
- 1$10,000 to $14,999
- 8$40,000 to $49,999
- 3$60,000 to $69,999
- 8$70,000 to $79,999
- 7$80,000 to $89,999
- 14$90,000 to $99,999
- 43$100,000 to $124,999
- 18$125,000 to $149,999
- 13$150,000 to $174,999
- 12$175,000 to $199,999
- 30$200,000 to $249,999
- 42$250,000 to $299,999
- 11$300,000 to $399,999
- 24$500,000 to $749,999
- 3$1,000,000 to $1,499,999
Rent paid by renters in 2022 in Stuart, VA
-
- 7Less than $100
- 20$100 to $149
- 12$150 to $199
- 16$200 to $249
- 17$250 to $299
- 24$300 to $349
- 14$350 to $399
- 45$400 to $449
- 45$450 to $499
- 17$500 to $549
- 7$550 to $599
- 7$600 to $649
- 10$650 to $699
- 22No cash rent


Percentage of workers working in this county: 70.9%
Number of people working at home: 59 (13.8% of all workers)
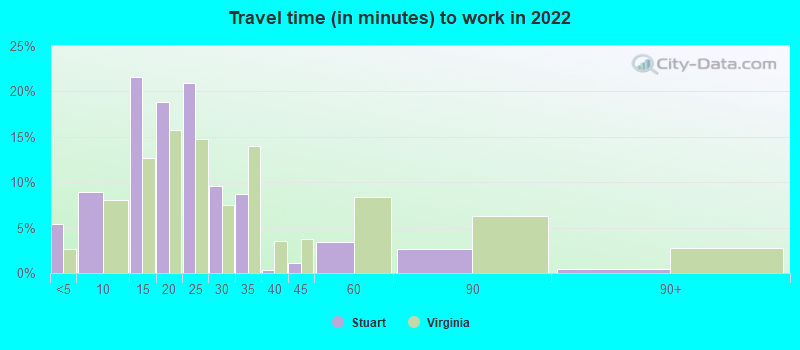
Travel time to work (commute)
- Less than 5 minutes: 56
- 5 to 9 minutes: 79
- 10 to 14 minutes: 52
- 15 to 19 minutes: 31
- 20 to 24 minutes: 3
- 25 to 29 minutes: 24
- 30 to 34 minutes: 23
- 35 to 39 minutes: 18
- 40 to 44 minutes: 25
- 45 to 59 minutes: 25
- 60 to 89 minutes: 17
- 90 or more minutes: 10
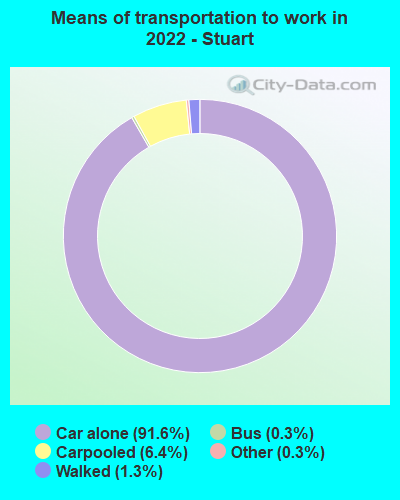
Means of transportation to work:
- Drove a car alone: 1,434 (84.9%)
- Carpooled: 102 (6.0%)
- Bus: 3 (0.2%)
- Taxi: 5 (0.3%)
- Walked: 21 (1.2%)
- Worked at home: 59 (3.5%)

- Unemployment by race in 2022
- Unemployment rate for White non-Hispanic residents
- 11.3%Males
- 2.1%Females
- Unemployment rate for two or more race residents
- 39.2%Females

- Year of entry for the foreign-born population in Stuart, Virginia
- 162010 or later
- 22000 to 2009
- 291990 to 1999
- 21980 to 1989
- 41970 to 1979
- 4Before 1970

First ancestries reported:
- American: 541 (47.5%)
- English: 203 (17.8%)
- German: 60 (5.3%)
- Irish: 37 (3.2%)
- Scotch-Irish: 14 (1.2%)
- European: 13 (1.1%)
- Jamaican: 11 (1.0%)
- Scandinavian: 9 (0.8%)
- Eastern European: 8 (0.7%)
- Scottish: 7 (0.6%)
- French: 6 (0.5%)
Most common places of birth for foreign-born residents (%):
| Stuart: | 22.4% (11) |
| Virginia: | 1.0% (10,734) |
| Stuart: | 22.4% (11) |
| Virginia: | 5.3% (57,498) |
| Stuart: | 20.4% (10) |
| Virginia: | 9.0% (97,830) |
| Stuart: | 14.3% (7) |
| Virginia: | 2.3% (24,582) |
| Stuart: | 10.2% (5) |
| Virginia: | 0.1% (843) |
| Stuart: | 6.1% (3) |
| Virginia: | 0.8% (8,513) |
Place of birth for U.S.-born residents:
- This state: 994
- Other state: 481
- Northeast: 108
- Midwest: 25
- South: 328
- West: 17
90.8% of Stuart residents lived in the same house 1 years ago.
Out of people who lived in different houses, 29.7% lived in this county.
Out of people who lived in different counties, 86.4% lived in Virginia.
| Stuart: | 90.8% |
| State average: | 86.6% |
Education attainment for males 25 years and older:
- No schooling: 3
- Nursery to 4th grade: 7
- 5th and 6th grade: 13
- 7th and 8th grade: 7
- 9th grade: 13
- 10th grade: 19
- 11th grade: 25
- 12th grade, no diploma: 4
- High school graduate (or equivalency): 226
- Less than 1 year of college: 50
- Some college more than 1 year, no degree: 59
- Associate degree: 57
- Bachelor's degree: 59
- Master's degree: 22
- Professional school degree: 3
- Doctorate degree: 4

Education attainment for females 25 years and older:
- No schooling: 7
- Nursery to 4th grade: 0
- 5th and 6th grade: 19
- 7th and 8th grade: 60
- 9th grade: 5
- 10th grade: 10
- 11th grade: 14
- 12th grade, no diploma: 0
- High school graduate (or equivalency): 202
- Less than 1 year of college: 35
- Some college more than 1 year, no degree: 88
- Associate degree: 29
- Bachelor's degree: 52
- Master's degree: 52
- Professional school degree: 4
- Doctorate degree: 0


Housing units in structures:
- One, detached: 410
- One, attached: 8
- Two: 22
- 3 or 4: 37
- 5 to 9: 126
- 20 to 49: 43
- 50 or more: 4
- Mobile homes: 17
Housing units lacking complete kitchen facilities in 2022: 4.7%
House/condo owner moved in on average 20 years ago
Renter moved in on average 0 years ago

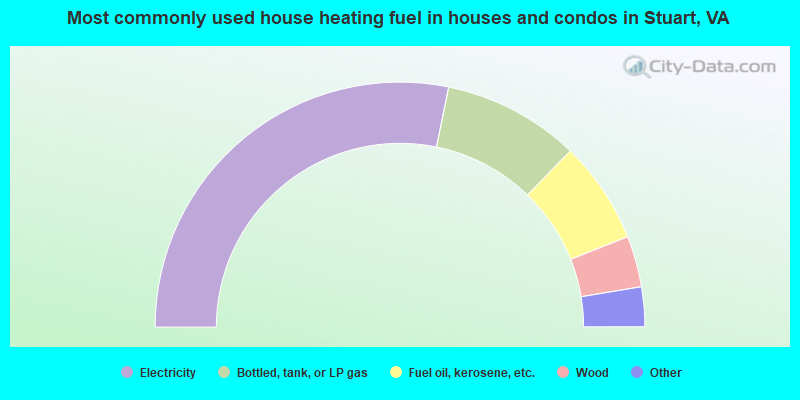
- 56.8%Electricity
- 18.2%Bottled, tank, or LP gas
- 13.6%Fuel oil, kerosene, etc.
- 6.8%Wood
- 2.3%Utility gas
- 2.3%Other fuel
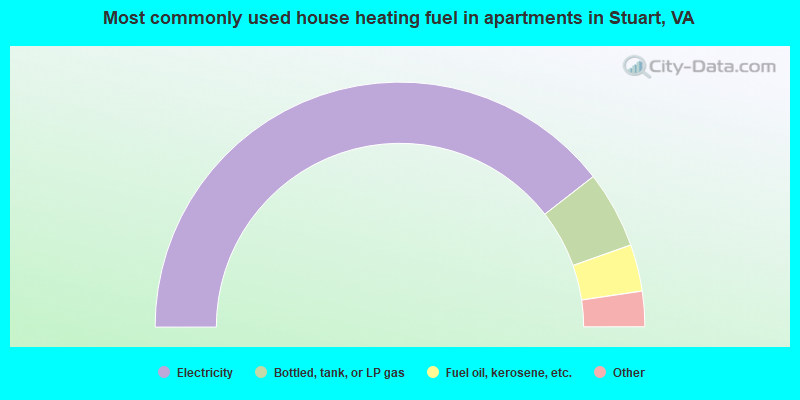
- 79.2%Electricity
- 10.2%Bottled, tank, or LP gas
- 6.2%Fuel oil, kerosene, etc.
- 3.6%Utility gas
- 0.7%Wood
Private vs. public school enrollment:
| Here: | 4.6% |
| Virginia: | 13.2% |
| Here: | 0.0% |
| Virginia: | 10.2% |
| Here: | 6.8% |
| Virginia: | 18.7% |


