Stratford, CT (Connecticut) Houses and Residents
| Stratford: | $344,606 |
| Connecticut: | $347,200 |
Mean price in 2022:
Detached houses: $348,906
Here: $348,906 State: $503,946 Townhouses or other attached units: $254,219
Here: $254,219 State: $304,959 In 2-unit structures: $249,810
Here: $249,810 State: $304,133 In 3-to-4-unit structures: $243,836
Here: $243,836 State: $272,970 In 5-or-more-unit structures: $194,948
Here: $194,948 State: $249,308
Total population: 51,384 (Urban population: 49,976, Rural population: 0)
Houses: 22,110 (20,200 occupied: 16,184 owner occupied, 4,260 renter occupied)
| % of renters here: | 21% |
| State: | 34% |
Housing density: 1,257 houses/condos per square mile
Median price asked for vacant for-sale houses and condos in 2022: $303,205.
Median contract rent in 2022: $1,284 (lower quartile is $965, upper quartile is $1,739)
Median rent asked for vacant for-rent units in 2022: $1,695
Median gross rent in Stratford, CT in 2022: $1,525
Housing units in Stratford with a mortgage: 10,496 (216 second mortgage, 1,336 home equity loan, 41 both second mortgage and home equity loan)
Houses without a mortgage: 5,009
Median household income for houses/condos with a mortgage: $121,905
Median household income for apartments without a mortgage: $81,058
Median monthly housing costs: $1,852
Compare current foreclosures in Stratford, CT:
| Photo | Address | Area | Beds / Baths | Price | Details |
|---|---|---|---|---|---|

|
#1
Alfred Ct
Stratford, CT 06615
|
1,406 sq. feet
|
2 baths 3 beds |
$449,900
|
show details |

|
#2
Los Angeles Ave
Stratford, CT 06614
|
1,238 sq. feet
|
2 baths 3 beds |
show details | |

|
#3
Henry Ave
Stratford, CT 06614
|
1,547 sq. feet
|
1 baths 3 beds |
show details | |

|
#4
Reitter St
Stratford, CT 06614
|
1,310 sq. feet
|
1 baths 3 beds |
show details | |

|
#5
High View Dr
Stratford, CT 06614
|
2,574 sq. feet
|
2 baths 4 beds |
show details | |

|
#6
Prospect Dr
Stratford, CT 06615
|
1,924 sq. feet
|
1 baths 2 beds |
show details | |

|
#7
Graham St
Stratford, CT 06615
|
1,056 sq. feet
|
2 baths 3 beds |
show details | |

|
#8
Newton St
Stratford, CT 06614
|
1,660 sq. feet
|
1 baths 3 beds |
show details | |

|
#9
Marcroft St
Stratford, CT 06614
|
1,346 sq. feet
|
2 baths 3 beds |
show details | |

|
#10
King St
Stratford, CT 06614
|
1,040 sq. feet
|
1 baths 2 beds |
show details |
| Photo | Address | Area | Beds / Baths | Price | Details |
|---|---|---|---|---|---|

|
#11
Henry Ave Unit 32k
Stratford, CT 06614
|
662 sq. feet
|
1 baths 1 beds |
show details | |

|
#12
General St
Stratford, CT 06615
|
1,200 sq. feet
|
1 baths 2 beds |
show details | |

|
#13
Hawley Gln
Stratford, CT 06614
|
1,090 sq. feet
|
1 baths 1 beds |
show details | |

|
#14
Nichols Ave
Stratford, CT 06614
|
1,373 sq. feet
|
1 baths 3 beds |
show details | |

|
#15
Seminole Ln # B
Stratford, CT 06614
|
1,454 sq. feet
|
2 baths 1 beds |
show details | |

|
#16
Seminole Ln
Stratford, CT 06614
|
1,454 sq. feet
|
2 baths 1 beds |
show details | |

|
#17
Thompson St
Stratford, CT 06615
|
1,483 sq. feet
|
2 baths 3 beds |
show details | |

|
#18
Stratford Rd
Stratford, CT 06615
|
2,106 sq. feet
|
2 baths 3 beds |
show details | |

|
#19
Canary Pl
Stratford, CT 06614
|
1,171 sq. feet
|
1 baths 3 beds |
show details | |

|
#20
Drome Ave
Stratford, CT 06615
|
1,382 sq. feet
|
1 baths 3 beds |
show details |
| Photo | Address | Area | Beds / Baths | Price | Details |
|---|---|---|---|---|---|

|
#21
Henry Ave
Stratford, CT 06614
|
1,363 sq. feet
|
1 baths 3 beds |
show details | |

|
#22
Knowlton St
Stratford, CT 06615
|
1,135 sq. feet
|
2 baths 3 beds |
show details | |

|
#23
Nichols Ave
Stratford, CT 06614
|
2,657 sq. feet
|
2 baths 5 beds |
show details | |

|
#24
Briarfield Dr
Stratford, CT 06614
|
1,423 sq. feet
|
1 baths 4 beds |
show details | |

|
#25
High Park Ave
Stratford, CT 06615
|
1,191 sq. feet
|
1 baths 3 beds |
show details | |

|
#26
Silver Ln
Stratford, CT 06614
|
1,080 sq. feet
|
2 baths 3 beds |
show details | |

|
#27
Fernwood Dr
Stratford, CT 06614
|
1,300 sq. feet
|
1 baths 3 beds |
show details | |

|
#28
Guzzi Dr
Stratford, CT 06615
|
1,040 sq. feet
|
1 baths 3 beds |
show details | |

|
#29
Goldbach Dr
Stratford, CT 06614
|
1,318 sq. feet
|
1 baths 3 beds |
show details | |

|
#30
Barnum Ave
Stratford, CT 06615
|
3,263 sq. feet
|
3 baths 5 beds |
show details |
| Photo | Address | Area | Beds / Baths | Price | Details |
|---|---|---|---|---|---|

|
#31
Sun Ridge Ln
Stratford, CT 06614
|
1,767 sq. feet
|
3 baths 3 beds |
show details | |

|
#32
Perry Ln
Stratford, CT 06614
|
2,637 sq. feet
|
2 baths 4 beds |
show details | |

|
#33
Boswell St
Stratford, CT 06615
|
1,887 sq. feet
|
2 baths 4 beds |
show details | |

|
#34
Lawlor Ter
Stratford, CT 06614
|
1,682 sq. feet
|
1 baths 3 beds |
show details | |

|
#35
Greenfield Ave
Stratford, CT 06614
|
1,272 sq. feet
|
2 baths 3 beds |
show details | |

|
#36
Swanson Ave
Stratford, CT 06614
|
1,386 sq. feet
|
1 baths 3 beds |
show details | |

|
#37
Riverdale Dr
Stratford, CT 06615
|
1,426 sq. feet
|
2 baths 3 beds |
show details | |

|
#38
Franklin Ave
Stratford, CT 06614
|
1,707 sq. feet
|
1 baths 4 beds |
show details | |

|
#39
Avon St
Stratford, CT 06615
|
- sq. feet
|
- baths - beds |
show details | |

|
#40
Sherwood Pl Apt D10
Stratford, CT 06615
|
- sq. feet
|
- baths - beds |
show details |
| Photo | Address | Area | Beds / Baths | Price | Details |
|---|---|---|---|---|---|

|
#41
Penny Meadow Ln Unit D
Stratford, CT 06614
|
- sq. feet
|
- baths - beds |
show details | |

|
#42
Warwick Ave
Stratford, CT 06615
|
- sq. feet
|
- baths - beds |
show details | |

|
#43
Burritt Ave # A1
Stratford, CT 06615
|
- sq. feet
|
- baths - beds |
show details | |

|
#44
Gregory Cir
Stratford, CT 06615
|
- sq. feet
|
- baths - beds |
show details | |

|
#45
Philo St
Stratford, CT 06615
|
- sq. feet
|
- baths - beds |
show details | |

|
#46
Happy Hollow Cir, Unit C
Stratford, CT 06614
|
- sq. feet
|
- baths - beds |
show details | |

|
#47
California St Unit C22
Stratford, CT 06615
|
- sq. feet
|
- baths - beds |
show details | |

|
#48
Roosevelt Ave
Stratford, CT 06615
|
- sq. feet
|
- baths - beds |
show details | |

|
#49
Success Ave
Stratford, CT 06614
|
- sq. feet
|
- baths - beds |
show details | |

|
Check over 1 million property listings on Foreclosure.com!
|
browse all offers | |||

Latest news about housing in Stratford, CT collected exclusively by city-data.com from local newspapers, TV, and radio stations


Median year apartment built: 1972
Household type by relationship:
Households: 52,615- Male householders: 9,284 (2,045 living alone), Female householders: 10,761 (3,424 living alone)
10,033 spouses (9,899 opposite-sex spouses), 916 unmarried partners, (871 opposite-sex unmarried partners), 16,022 children (14,686 natural, 610 adopted, 725 stepchildren), 1,150 grandchildren, 718 brothers or sisters, 1,017 parents, 57 foster children, 1,021 other relatives, 1,235 non-relatives
- In group quarters: 394
Size of family households: 6,251 2-persons, 3,583 3-persons, 2,266 4-persons, 1,340 5-persons, 308 6-persons, 276 7-or-more-persons.
Size of nonfamily households: 5,800 1-person, 718 2-persons, 117 3-persons, 17 4-persons, 15 6-persons, 25 7-or-more-persons.
6,264 married couples with children.
2,324 single-parent households (472 men, 1,852 women).
79.2% of residents of Stratford speak English at home.
12.6% of residents speak Spanish at home (69% speak English very well, 19% speak English well, 8% speak English not well, 4% don't speak English at all).
6.5% of residents speak other Indo-European language at home (62% speak English very well, 24% speak English well, 11% speak English not well, 3% don't speak English at all).
1.1% of residents speak Asian or Pacific Island language at home (67% speak English very well, 13% speak English well, 13% speak English not well, 7% don't speak English at all).
0.8% of residents speak other language at home (78% speak English very well, 15% speak English well, 7% speak English not well).
Foreign born population: 8,021 (15.2%)
(65.4% of them are naturalized citizens)
| Here: | 6.1 |
| State: | 6.5 |
| Here: | 4.1 |
| State: | 4.0 |

- Bedrooms in owner-occupied houses and condos in Stratford, Connecticut
- 6no bedroom
- 9451 bedroom
- 3,3592 bedrooms
- 8,6213 bedrooms
- 2,6394 bedrooms
- 6155+ bedrooms

- Bedrooms in renter-occupied apartments in Stratford, Connecticut
- 410no bedroom
- 1,3441 bedroom
- 1,2712 bedrooms
- 8673 bedrooms
- 3204 bedrooms
- 495+ bedrooms

- Cars and other vehicles available in Stratford in owner-occupied houses/condos
- 368no vehicle
- 4,5641 vehicle
- 6,8762 vehicles
- 2,9493 vehicles
- 8824 vehicles
- 5465+ vehicles

- Cars and other vehicles available in Stratford in renter-occupied apartments
- 984no vehicle
- 2,2451 vehicle
- 7332 vehicles
- 2243 vehicles
- 384 vehicles
- 365+ vehicles

- Rooms in owner-occupied houses in Stratford, Connecticut
- 61 room
- 352 rooms
- 3853 rooms
- 1,5414 rooms
- 3,2605 rooms
- 4,6746 rooms
- 2,9687 rooms
- 1,6938 rooms
- 1,6229+ rooms

- Rooms in renter-occupied apartments in Stratford, Connecticut
- 4101 room
- 5272 rooms
- 7003 rooms
- 8194 rooms
- 8595 rooms
- 6336 rooms
- 1947 rooms
- 428 rooms
- 779+ rooms


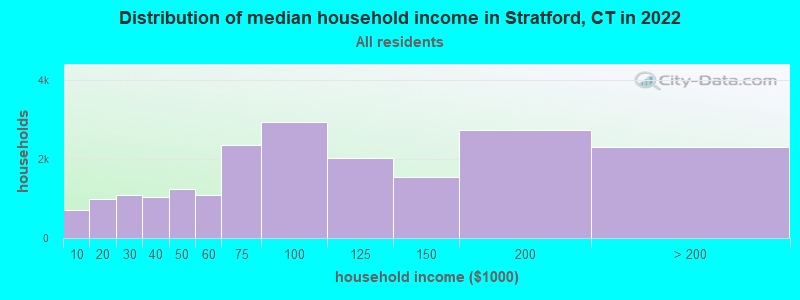
Stratford, CT household income distribution

- 709Less than $10,000
- 983$10,000 to $19,999
- 1,097$20,000 to $29,999
- 1,026$30,000 to $39,999
- 1,242$40,000 to $49,999
- 1,087$50,000 to $59,999
- 2,362$60,000 to $74,999
- 2,937$75,000 to $99,999
- 2,031$100,000 to $124,999
- 1,553$125,000 to $149,999
- 2,727$150,000 to $199,999
- 2,314$200,000 or more
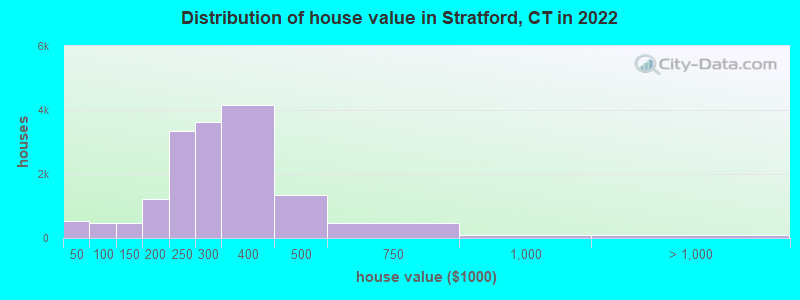
Home value of owner - occupied houses in 2022 in Stratford, CT
-
- 142Less than $10,000
- 6$15,000 to $19,999
- 67$20,000 to $24,999
- 25$25,000 to $29,999
- 33$30,000 to $34,999
- 91$35,000 to $39,999
- 148$40,000 to $49,999
- 68$50,000 to $59,999
- 68$60,000 to $69,999
- 49$70,000 to $79,999
- 76$80,000 to $89,999
- 45$90,000 to $99,999
- 216$100,000 to $124,999
- 252$125,000 to $149,999
- 536$150,000 to $174,999
- 696$175,000 to $199,999
- 3,329$200,000 to $249,999
- 3,611$250,000 to $299,999
- 4,162$300,000 to $399,999
- 1,358$400,000 to $499,999
- 483$500,000 to $749,999
- 96$750,000 to $999,999
- 11$1,000,000 to $1,499,999
- 78$2,000,000 or more
Rent paid by renters in 2022 in Stratford, CT
-
- 12Less than $100
- 76$150 to $199
- 25$200 to $249
- 71$250 to $299
- 30$300 to $349
- 52$350 to $399
- 136$400 to $449
- 98$450 to $499
- 37$500 to $549
- 47$550 to $599
- 3$600 to $649
- 32$650 to $699
- 18$700 to $749
- 15$750 to $799
- 246$800 to $899
- 370$900 to $999
- 827$1,000 to $1,249
- 729$1,250 to $1,499
- 1,230$1,500 to $1,999
- 194$2,000 to $2,499
- 55$3,000 to $3,499
- 238$3,500 or more
- 256No cash rent


Percentage of workers working in this county: 75.1%
Number of people working at home: 2,696 (9.9% of all workers)
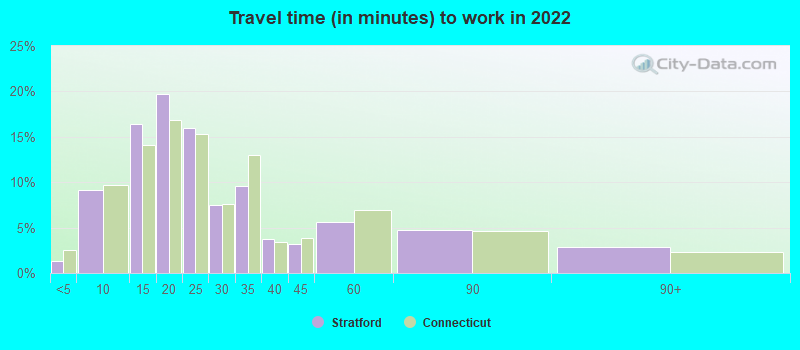
Travel time to work (commute)
- Less than 5 minutes: 259
- 5 to 9 minutes: 1,780
- 10 to 14 minutes: 3,667
- 15 to 19 minutes: 4,324
- 20 to 24 minutes: 3,841
- 25 to 29 minutes: 1,321
- 30 to 34 minutes: 2,322
- 35 to 39 minutes: 645
- 40 to 44 minutes: 616
- 45 to 59 minutes: 1,707
- 60 to 89 minutes: 2,034
- 90 or more minutes: 1,323
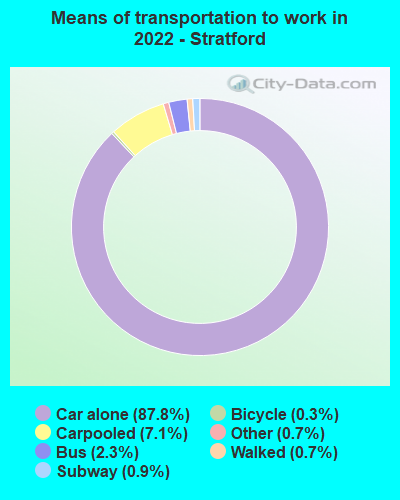
Means of transportation to work:
- Drove a car alone: 20,713 (77.4%)
- Carpooled: 1,641 (6.1%)
- Bus: 380 (1.4%)
- Subway or elevated rail: 55 (0.2%)
- Long-distance train or commuter rail: 148 (0.6%)
- Light rail, streetcar or trolley: 23 (0.1%)
- Ferryboat: 65 (0.2%)
- Taxi: 229 (0.9%)
- Bicycle: 74 (0.3%)
- Walked: 196 (0.7%)
- Worked at home: 2,764 (10.3%)

- Unemployment by race in 2022
- Unemployment rate for White non-Hispanic residents
- 5.3%Males
- 3.8%Females
- Unemployment rate for Black residents
- 5.0%Males
- 3.0%Females
- Unemployment rate for American Indian and Alaska Native residents
- 10.9%Males
- Unemployment rate for Asian residents
- 1.3%Males
- 17.6%Females
- Unemployment rate for other race residents
- 4.8%Males
- 11.3%Females
- Unemployment rate for two or more race residents
- 12.0%Males
- 23.9%Females
- Unemployment rate for Hispanic or Latino residents
- 5.5%Males
- 8.2%Females

- Year of entry for the foreign-born population in Stratford, Connecticut
- 2,0142010 or later
- 1,8782000 to 2009
- 1,8411990 to 1999
- 9361980 to 1989
- 6681970 to 1979
- 1,532Before 1970

First ancestries reported:
- Italian: 3,375 (12.4%)
- Irish: 1,931 (7.1%)
- American: 1,323 (4.9%)
- Jamaican: 1,148 (4.2%)
- Polish: 1,058 (3.9%)
- Haitian: 679 (2.5%)
- African: 600 (2.2%)
- English: 546 (2.0%)
- European: 502 (1.8%)
- Slovak: 397 (1.5%)
- Hungarian: 392 (1.4%)
- German: 361 (1.3%)
- Portuguese: 282 (1.0%)
- Albanian: 275 (1.0%)
- Afghan: 240 (0.9%)
- French Canadian: 209 (0.8%)
- Eastern European: 180 (0.7%)
- Greek: 176 (0.6%)
- Russian: 171 (0.6%)
- Trinidadian and Tobagonian: 170 (0.6%)
- French: 142 (0.5%)
- Scottish: 135 (0.5%)
- Turkish: 121 (0.4%)
- Ukrainian: 110 (0.4%)
- Swedish: 103 (0.4%)
- Slavic: 98 (0.4%)
- British: 92 (0.3%)
- Lithuanian: 65 (0.2%)
- Czechoslovakian: 62 (0.2%)
- Canadian: 61 (0.2%)
- Finnish: 59 (0.2%)
- Syrian: 58 (0.2%)
- West Indian: 58 (0.2%)
- Scotch-Irish: 44 (0.2%)
- Brazilian: 43 (0.2%)
- Dutch: 32 (0.1%)
- Ghanaian: 31 (0.1%)
- Czech: 30 (0.1%)
- Arab: 29 (0.1%)
- Romanian: 29 (0.1%)
- Bulgarian: 29 (0.1%)
- Austrian: 23 (0.08%)
- Lebanese: 22 (0.08%)
- Armenian: 19 (0.07%)
- Nigerian: 18 (0.07%)
- Carpatho Rusyn: 17 (0.06%)
- U.S. Virgin Islander: 16 (0.06%)
- Belgian: 11 (0.04%)
- Guyanese: 11 (0.04%)
- Norwegian: 11 (0.04%)
- Welsh: 10 (0.04%)
- Celtic: 10 (0.04%)
- Barbadian: 7 (0.03%)
- Northern European: 7 (0.03%)
- British West Indian: 6 (0.02%)
- Yugoslavian: 5 (0.02%)
Most common places of birth for foreign-born residents (%):
| Stratford: | 13.9% (1,050) |
| Connecticut: | 100.0% (-1) |
| Stratford: | 8.4% (634) |
| Connecticut: | 100.0% (-1) |
| Stratford: | 5.6% (421) |
| Connecticut: | 100.0% (-1) |
| Stratford: | 4.8% (362) |
| Connecticut: | 100.0% (-1) |
| Stratford: | 4.7% (356) |
| Connecticut: | 100.0% (-1) |
| Stratford: | 3.6% (271) |
| Connecticut: | 100.0% (-1) |
| Stratford: | 3.6% (268) |
| Connecticut: | 100.0% (-1) |
| Stratford: | 3.2% (244) |
| Connecticut: | 100.0% (-1) |
| Stratford: | 3.2% (241) |
| Connecticut: | 100.0% (-1) |
| Stratford: | 3.1% (232) |
| Connecticut: | 100.0% (-1) |
| Stratford: | 2.8% (215) |
| Connecticut: | 100.0% (-1) |
| Stratford: | 2.7% (205) |
| Connecticut: | 100.0% (-1) |
| Stratford: | 2.7% (201) |
| Connecticut: | 100.0% (-1) |
| Stratford: | 2.2% (165) |
| Connecticut: | 100.0% (-1) |
| Stratford: | 2.1% (161) |
| Connecticut: | 100.0% (-1) |
| Stratford: | 2.1% (157) |
| Connecticut: | 100.0% (-1) |
| Stratford: | 2.0% (148) |
| Connecticut: | 100.0% (-1) |
| Stratford: | 1.9% (144) |
| Connecticut: | 100.0% (-1) |
| Stratford: | 1.7% (129) |
| Connecticut: | 100.0% (-1) |
Place of birth for U.S.-born residents:
- This state: 32,219
- Other state: 10,537
- Northeast: 6,922
- Midwest: 981
- South: 1,889
- West: 679
93.2% of Stratford residents lived in the same house 1 years ago.
Out of people who lived in different houses, 35.0% lived in this county.
Out of people who lived in different counties, 41.2% lived in Connecticut.
| Stratford: | 93.2% |
| State average: | 88.4% |
Education attainment for males 25 years and older:
- No schooling: 334
- Nursery to 4th grade: 181
- 5th and 6th grade: 121
- 7th and 8th grade: 167
- 9th grade: 115
- 10th grade: 145
- 11th grade: 253
- 12th grade, no diploma: 357
- High school graduate (or equivalency): 5,441
- Less than 1 year of college: 868
- Some college more than 1 year, no degree: 1,733
- Associate degree: 1,423
- Bachelor's degree: 3,806
- Master's degree: 1,761
- Professional school degree: 504
- Doctorate degree: 245

Education attainment for females 25 years and older:
- No schooling: 534
- Nursery to 4th grade: 87
- 5th and 6th grade: 72
- 7th and 8th grade: 113
- 9th grade: 88
- 10th grade: 190
- 11th grade: 199
- 12th grade, no diploma: 332
- High school graduate (or equivalency): 6,049
- Less than 1 year of college: 1,379
- Some college more than 1 year, no degree: 2,013
- Associate degree: 2,211
- Bachelor's degree: 4,289
- Master's degree: 2,511
- Professional school degree: 356
- Doctorate degree: 167


Housing units in structures:
- One, detached: 14,212
- One, attached: 2,521
- Two: 2,109
- 3 or 4: 731
- 5 to 9: 745
- 10 to 19: 449
- 20 to 49: 722
- 50 or more: 598
- Boats, RVs, vans, etc.: 19
Median worth of mobile homes: $452,607
Housing units lacking complete kitchen facilities in 2022: 0.9%
House/condo owner moved in on average 14 years ago
Renter moved in on average 3 years ago

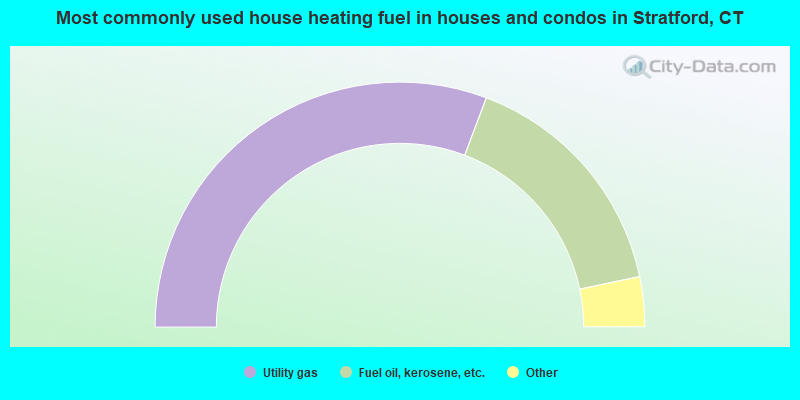
- 61.5%Utility gas
- 31.9%Fuel oil, kerosene, etc.
- 3.1%Electricity
- 1.5%Bottled, tank, or LP gas
- 1.0%Coal or coke
- 0.5%Wood
- 0.2%Other fuel
- 0.2%No fuel used
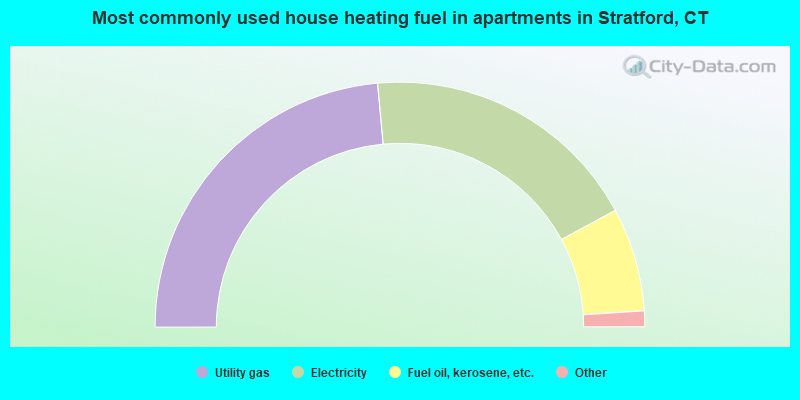
- 47.1%Utility gas
- 37.1%Electricity
- 13.7%Fuel oil, kerosene, etc.
- 1.4%Bottled, tank, or LP gas
- 0.7%Other fuel
Private vs. public school enrollment:
| Here: | 7.9% |
| Connecticut: | 9.5% |
| Here: | 12.0% |
| Connecticut: | 12.9% |
| Here: | 37.4% |
| Connecticut: | 35.5% |


