Stonington, IL (Illinois) Houses and Residents
| Stonington: | $97,862 |
| Illinois: | $251,600 |
Mean price in 2022:
Detached houses: $109,157
Here: $109,157 State: $310,164 Mobile homes: $77,865
Here: $77,865 State: $78,855
Total population: 899 (Urban population: 0, Rural population: 957 (all nonfarm))
Houses: 377 (330 occupied: 257 owner occupied, 77 renter occupied)
| % of renters here: | 23% |
| State: | 33% |
Housing density: 830 houses/condos per square mile
Median price asked for vacant for-sale houses and condos in 2022: $75,401.
Median contract rent in 2022: $590 (lower quartile is $455, upper quartile is $719)
Median rent asked for vacant for-rent units in 2022: $835
Median gross rent in Stonington, IL in 2022: $843
Housing units in Stonington with a mortgage: 133 (10 second mortgage, 0 home equity loan, 5 both second mortgage and home equity loan)
Houses without a mortgage: 0
Median household income for houses/condos with a mortgage: $45,510
Median household income for apartments without a mortgage: $49,215
Median monthly housing costs: $790
Compare current foreclosures near Stonington, IL:
| Photo | Address | Area | Beds / Baths | Price | Details |
|---|---|---|---|---|---|

|
#1
S Elm St
Stonington, IL 62567
|
1,704 sq. feet
|
2 baths 3 beds |
show details | |

|
#2
W Brown Ave
Stonington, IL 62567
|
- sq. feet
|
- baths - beds |
show details | |

|
#3
S Maple St
Stonington, IL 62567
|
- sq. feet
|
- baths - beds |
show details | |

|
#4
N Cherokee St
Taylorville, IL 62568
|
1,088 sq. feet
|
1 baths 3 beds |
show details | |

|
#5
North Ave
Kincaid, IL 62540
|
- sq. feet
|
- baths 2 beds |
$39,900
|
show details |

|
#6
Kenton Blvd
Taylorville, IL 62568
|
1,530 sq. feet
|
1 baths 4 beds |
show details | |

|
#7
Summit Ave
Kincaid, IL 62540
|
1,100 sq. feet
|
1 baths 3 beds |
show details | |

|
#8
E 2750 North Rd
Blue Mound, IL 62513
|
570 sq. feet
|
- baths 3 beds |
show details | |

|
#9
Railroad St
Mechanicsburg, IL 62545
|
- sq. feet
|
- baths - beds |
show details | |

|
#10
Kincaid St
Taylorville, IL 62568
|
- sq. feet
|
- baths - beds |
show details |
| Photo | Address | Area | Beds / Baths | Price | Details |
|---|---|---|---|---|---|

|
#11
4th Cross St
Mechanicsburg, IL 62545
|
- sq. feet
|
- baths - beds |
show details | |

|
#12
S Main St
Taylorville, IL 62568
|
- sq. feet
|
- baths - beds |
show details | |

|
#13
W Market St
Taylorville, IL 62568
|
- sq. feet
|
- baths - beds |
show details | |

|
#14
S Elevator St
Taylorville, IL 62568
|
- sq. feet
|
- baths - beds |
show details | |

|
#15
S Sunnyside Dr
Blue Mound, IL 62513
|
- sq. feet
|
- baths - beds |
show details | |

|
#16
W Cantrell St
Decatur, IL 62522
|
- sq. feet
|
- baths - beds |
show details | |

|
#17
Bullard Rd
Buffalo, IL 62515
|
- sq. feet
|
- baths - beds |
show details | |

|
#18
Romulis Rd
Niantic, IL 62551
|
- sq. feet
|
- baths - beds |
show details | |

|
#19
E 2675 North Rd
Mechanicsburg, IL 62545
|
- sq. feet
|
- baths - beds |
show details | |

|
#20
S 4th St
Mechanicsburg, IL 62545
|
- sq. feet
|
- baths - beds |
show details |
| Photo | Address | Area | Beds / Baths | Price | Details |
|---|---|---|---|---|---|

|
#21
E Temple St
Mount Auburn, IL 62547
|
- sq. feet
|
- baths - beds |
show details | |

|
#22
N 800 East Rd
Edinburg, IL 62531
|
- sq. feet
|
- baths - beds |
show details | |

|
#23
N Church St
Owaneco, IL 62555
|
- sq. feet
|
- baths - beds |
show details | |

|
#24
W Arch St
Mount Auburn, IL 62547
|
- sq. feet
|
- baths - beds |
show details | |

|
#25
E Market St
Taylorville, IL 62568
|
- sq. feet
|
- baths - beds |
show details | |

|
#26
E Thompson St
Taylorville, IL 62568
|
- sq. feet
|
- baths - beds |
show details | |

|
#27
E Main Cross St
Taylorville, IL 62568
|
- sq. feet
|
- baths - beds |
show details | |

|
#28
S Roosevelt Rd
Taylorville, IL 62568
|
- sq. feet
|
- baths - beds |
show details | |

|
#29
W Dunbar St
Blue Mound, IL 62513
|
- sq. feet
|
- baths - beds |
show details | |

|
#30
White Pine Cir
Decatur, IL 62521
|
- sq. feet
|
- baths - beds |
show details |
| Photo | Address | Area | Beds / Baths | Price | Details |
|---|---|---|---|---|---|

|
Check over 1 million property listings on Foreclosure.com!
|
browse all offers | |||
| Photo | Address | Area | Beds / Baths | Price | Details |
|---|

Latest news about housing in Stonington, IL collected exclusively by city-data.com from local newspapers, TV, and radio stations

 | Decatur to Champaign Commute? (10 replies) |

Median year apartment built: 1972
Household type by relationship:
Households: 717- Male householders: 141 (41 living alone), Female householders: 183 (90 living alone)
122 spouses (120 opposite-sex spouses), 38 unmarried partners, (38 opposite-sex unmarried partners), 201 children (182 natural, 3 adopted, 14 stepchildren), 6 grandchildren, 0 brothers or sisters, 2 parents, 0 foster children, 0 other relatives, 21 non-relatives
Size of family households: 102 2-persons, 12 3-persons, 29 4-persons, 7 5-persons.
Size of nonfamily households: 139 1-person, 47 2-persons.
73 married couples with children.
10 single-parent households (2 men, 8 women).
97.2% of residents of Stonington speak English at home.
1.1% of residents speak Spanish at home (100% speak English very well).
0.3% of residents speak other Indo-European language at home (100% speak English very well).
0.7% of residents speak Asian or Pacific Island language at home (80% speak English well, 20% don't speak English at all).
Foreign born population: 12 (1.7%)
(0.0% of them are naturalized citizens)
| Here: | 6.3 |
| State: | 6.4 |
| Here: | 5.0 |
| State: | 4.1 |

- Bedrooms in owner-occupied houses and condos in Stonington, Illinois
- 0no bedroom
- 21 bedroom
- 672 bedrooms
- 1393 bedrooms
- 464 bedrooms
- 35+ bedrooms

- Bedrooms in renter-occupied apartments in Stonington, Illinois
- 0no bedroom
- 101 bedroom
- 382 bedrooms
- 223 bedrooms
- 74 bedrooms
- 05+ bedrooms

- Cars and other vehicles available in Stonington in owner-occupied houses/condos
- 5no vehicle
- 901 vehicle
- 902 vehicles
- 483 vehicles
- 184 vehicles
- 75+ vehicles

- Cars and other vehicles available in Stonington in renter-occupied apartments
- 0no vehicle
- 491 vehicle
- 232 vehicles
- 53 vehicles
- 04 vehicles
- 05+ vehicles

- Rooms in owner-occupied houses in Stonington, Illinois
- 01 room
- 02 rooms
- 63 rooms
- 234 rooms
- 525 rooms
- 606 rooms
- 577 rooms
- 408 rooms
- 199+ rooms

- Rooms in renter-occupied apartments in Stonington, Illinois
- 01 room
- 02 rooms
- 33 rooms
- 244 rooms
- 175 rooms
- 166 rooms
- 167 rooms
- 08 rooms
- 09+ rooms


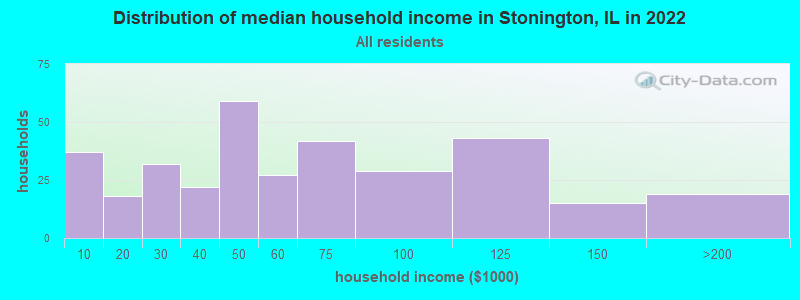
Stonington, IL household income distribution

- 37Less than $10,000
- 18$10,000 to $19,999
- 32$20,000 to $29,999
- 22$30,000 to $39,999
- 59$40,000 to $49,999
- 27$50,000 to $59,999
- 42$60,000 to $74,999
- 29$75,000 to $99,999
- 43$100,000 to $124,999
- 15$125,000 to $149,999
- 18$150,000 to $199,999
- 1$200,000 or more
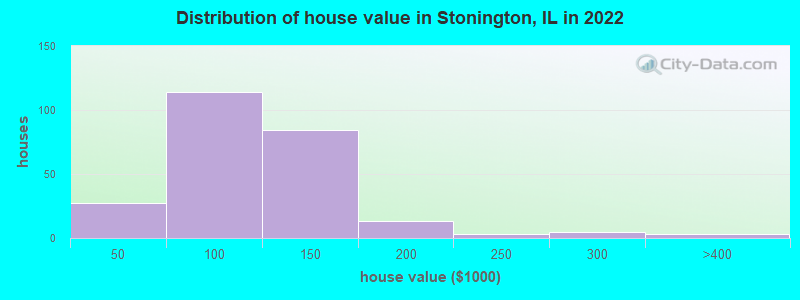
Home value of owner - occupied houses in 2022 in Stonington, IL
-
- 4Less than $10,000
- 2$20,000 to $24,999
- 6$30,000 to $34,999
- 7$35,000 to $39,999
- 6$40,000 to $49,999
- 19$50,000 to $59,999
- 16$60,000 to $69,999
- 23$70,000 to $79,999
- 37$80,000 to $89,999
- 11$90,000 to $99,999
- 30$100,000 to $124,999
- 54$125,000 to $149,999
- 11$150,000 to $174,999
- 1$175,000 to $199,999
- 2$200,000 to $249,999
- 5$250,000 to $299,999
- 1$300,000 to $399,999
- 2$500,000 to $749,999
Rent paid by renters in 2022 in Stonington, IL
-
- 1$250 to $299
- 3$300 to $349
- 10$350 to $399
- 2$400 to $449
- 5$450 to $499
- 8$500 to $549
- 4$550 to $599
- 3$600 to $649
- 13$650 to $699
- 6$700 to $749
- 3$750 to $799
- 9$800 to $899
- 1$1,250 to $1,499
- 3No cash rent


Percentage of workers working in this county: 59.6%
Number of people working at home: 3 (0.8% of all workers)
Travel time to work (commute)
- Less than 5 minutes: 23
- 5 to 9 minutes: 57
- 10 to 14 minutes: 45
- 15 to 19 minutes: 67
- 20 to 24 minutes: 21
- 25 to 29 minutes: 21
- 30 to 34 minutes: 38
- 35 to 39 minutes: 3
- 40 to 44 minutes: 10
- 45 to 59 minutes: 39
- 60 to 89 minutes: 9
- 90 or more minutes: 0
Means of transportation to work:
- Drove a car alone: 317 (80.9%)
- Carpooled: 58 (14.8%)
- Bus or trolley bus: 2 (0.5%)
- Walked: 7 (1.8%)
- Worked at home: 8 (2.0%)

- Unemployment by race in 2022
- Unemployment rate for White non-Hispanic residents
- 3.9%Males
- 3.9%Females

- Year of entry for the foreign-born population in Stonington, Illinois
- 142010 or later
- 02000 to 2009
- 01990 to 1999
- 11980 to 1989
- 01970 to 1979
- 2Before 1970

First ancestries reported:
- German: 58 (23.8%)
- American: 57 (23.4%)
- English: 34 (14.0%)
- French: 13 (5.3%)
- Polish: 11 (4.5%)
- Scottish: 9 (3.7%)
- Irish: 6 (2.5%)
- Palestinian: 4 (1.6%)
- Danish: 4 (1.6%)
- Italian: 4 (1.6%)
- Dutch: 3 (1.2%)
- European: 2 (0.8%)
- Scotch-Irish: 2 (0.8%)
- Belgian: 1 (0.4%)
- British: 1 (0.4%)
Most common places of birth for foreign-born residents (%):
| Stonington: | 91.7% (11) |
| Illinois: | 0.9% (16,553) |
| Stonington: | 8.3% (1) |
| Illinois: | 0.1% (2,017) |
| Stonington: | 8.3% (1) |
| Illinois: | 4.1% (74,364) |
Place of birth for U.S.-born residents:
- This state: 541
- Other state: 148
- Northeast: 6
- Midwest: 59
- South: 73
- West: 8
94.6% of Stonington residents lived in the same house 1 years ago.
Out of people who lived in different houses, 44.3% lived in this county.
Out of people who lived in different counties, 100.0% lived in Illinois.
| Stonington: | 94.6% |
| State average: | 88.3% |
Education attainment for males 25 years and older:
- No schooling: 3
- Nursery to 4th grade: 0
- 5th and 6th grade: 0
- 7th and 8th grade: 1
- 9th grade: 0
- 10th grade: 2
- 11th grade: 1
- 12th grade, no diploma: 1
- High school graduate (or equivalency): 132
- Less than 1 year of college: 44
- Some college more than 1 year, no degree: 36
- Associate degree: 31
- Bachelor's degree: 31
- Master's degree: 5
- Professional school degree: 0
- Doctorate degree: 0

Education attainment for females 25 years and older:
- No schooling: 6
- Nursery to 4th grade: 0
- 5th and 6th grade: 0
- 7th and 8th grade: 2
- 9th grade: 1
- 10th grade: 3
- 11th grade: 8
- 12th grade, no diploma: 7
- High school graduate (or equivalency): 125
- Less than 1 year of college: 8
- Some college more than 1 year, no degree: 34
- Associate degree: 16
- Bachelor's degree: 41
- Master's degree: 27
- Professional school degree: 0
- Doctorate degree: 0


Housing units in structures:
- One, detached: 322
- Two: 18
- 3 or 4: 14
- 5 to 9: 10
- Mobile homes: 13
Housing units lacking complete kitchen facilities in 2022: 4.3%
House/condo owner moved in on average 18 years ago
Renter moved in on average 7 years ago

Private vs. public school enrollment:
| Here: | 0.0% |
| Illinois: | 13.3% |
| Here: | 0.0% |
| Illinois: | 9.9% |
| Here: | 0.0% |
| Illinois: | 27.4% |


