Stoneham, MA (Massachusetts) Houses and Residents
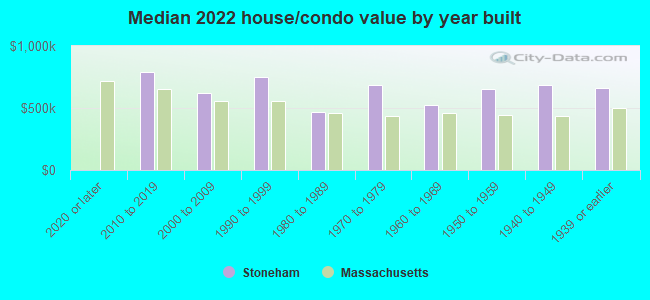
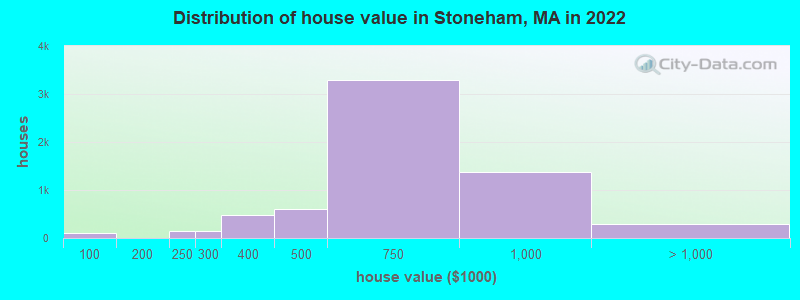
Estimated median house or condo value in 2022: $643,290 (it was $227,900 in 2000 )
Stoneham:
$643,290Massachusetts:
$534,700
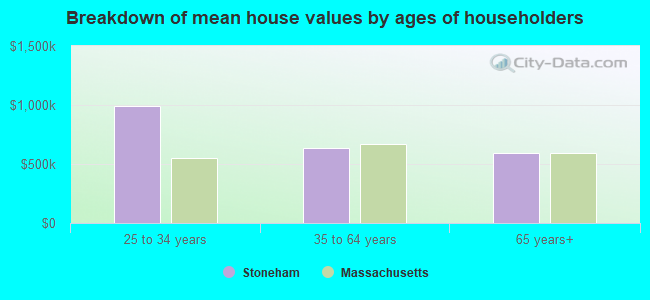
Lower value quartile - upper value quartile: $504,803 - $761,815Mean price in 2022: Detached houses: $716,278 Here:
$716,278State:
$651,570
Townhouses or other attached units: $482,673 Here:
$482,673State:
$617,749
In 2-unit structures: $629,212 Here:
$629,212State:
$594,808
In 3-to-4-unit structures: $310,429 Here:
$310,429State:
$601,912
In 5-or-more-unit structures: $508,346 Here:
$508,346State:
$555,768
Total population: 21,437 (All urban)
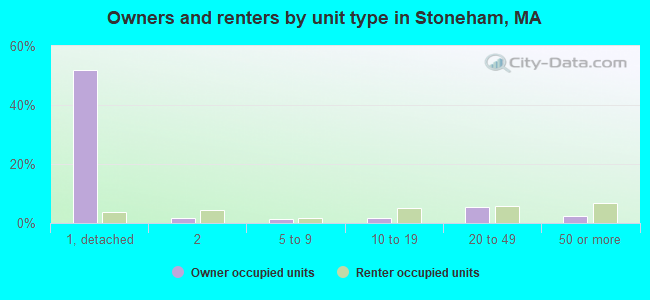
Houses: 10,045 (9,791 occupied: 6,634 owner occupied, 3,148 renter occupied )
% of renters here:
32%State:
38%
Housing density: 1,634 houses/condos per square mile
Median price asked for vacant for-sale houses and condos in 2022 in this county: $1,068,910.
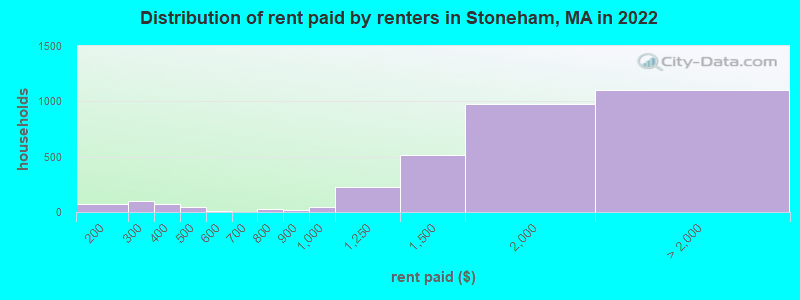
Median contract rent in 2022: $1,692 (lower quartile is $1,336, upper quartile is over $2,000)
Median rent asked for vacant for-rent units in 2022: $3,250
Median gross rent in Stoneham, MA in 2022: $1,836
Housing units in Stoneham with a mortgage: 4,341 (626 second mortgage, 0 home equity loan, 506 both second mortgage and home equity loan )Houses without a mortgage: 85
Median household income for houses/condos with a mortgage: $169,866
Median household income for apartments without a mortgage: $95,930
Median monthly housing costs: $1,951
Data:
Median house or condo value ($)
Median house or condo value ($ change since 2000)
Median house or condo value ($) - White
Median house or condo value ($) - Black or African American
Median house or condo value ($) - Asian
Median house or condo value ($) - Hispanic or Latino
Median house or condo value ($) - American Indian and Alaska Native
Median house or condo value ($) - Multirace
Median house or condo value ($) - Other Race
Median price asked for mobile homes ($)
Household density (households per square mile)
Mean house or condo value by units in structure - 1, detached ($)
Mean house or condo value by units in structure - 1, attached ($)
Mean house or condo value by units in structure - 2 ($)
Mean house or condo value by units in structure by units in structure - 3 or 4 ($)
Mean house or condo value by units in structure - 5 or more ($)
Mean house or condo value by units in structure - Boat, RV, van, etc. ($)
Mean house or condo value by units in structure - Mobile home ($)
Median contract rent ($)
Median contract rent - Lower quartile ($)
Median contract rent - Upper quartile ($)
Median gross rent ($)
Urban houses (%)
Rural houses (%)
Houses occupied (%)
Houses occupied (% change since 2000)
Houses owner occupied (%)
Houses owner occupied (% change since 2000)
Houses renter occupied (%)
Houses renter occupied (% change since 2000)
Vacant housing units - For rent (%)
Vacant housing units - For rent (% change since 2000)
Vacant housing units - For sale only (%)
Vacant housing units - For sale only (% change since 2000)
Vacant housing units - Rented or sold, not occupied (%)
Vacant housing units - Rented or sold, not occupied (% change since 2000)
Vacant housing units - For seasonal, recreational, or occasional use (%)
Vacant housing units - For seasonal, recreational, or occasional use (% change since 2000)
Vacant housing units - For migrant workers (%)
Vacant housing units - For migrant workers (% change since 2000)
Vacant housing units - Other vacant (%)
Vacant housing units - Other vacant (% change since 2000)
Median monthly housing costs ($)
Median household income for houses/condos with a mortgage ($)
Median household income for houses/condos without a mortgage ($)
Median household income ($)
Median household income ($) - White
Median household income ($) - Black or African American
Median household income ($) - Asian
Median household income ($) - Hispanic or Latino
Median household income ($) - American Indian and Alaska Native
Median household income ($) - Multirace
Median household income ($) - Other Race
Mortgage status - with mortgage (%)
Mortgage status - with second mortgage (%)
Mortgage status - with home equity loan (%)
Mortgage status - with both second mortgage and home equity loan (%)
Mortgage status - without a mortgage (%)
Median year house/condo built
Median year apartment built
Household type by relationship - Male householder living alone (%)
Household type by relationship - Male householder not living alone (%)
Household type by relationship - Female householder living alone (%)
Household type by relationship - Female householder not living alone (%)
Household type by relationship - Opposite-Sex spouse (%)
Household type by relationship - Same-Sex spouse (%)
Household type by relationship - Opposite-Sex unmarried partner (%)
Household type by relationship - Same-Sex unmarried partner (%)
Household type by relationship - In group quarters (%)
Size of family households - 2-person household (%)
Size of family households - 3-person household (%)
Size of family households - 4-person household (%)
Size of family households - 5-person household (%)
Size of family households - 6-person household (%)
Size of family households - 7-or-more-person household (%)
Size of nonfamily households - 1-person household (%)
Size of nonfamily households - 2-person household (%)
Size of nonfamily households - 3-person household (%)
Size of nonfamily households - 4-person household (%)
Size of nonfamily households - 5-person household (%)
Size of nonfamily households - 6-person household (%)
Size of nonfamily households - 7-or-moreperson household (%)
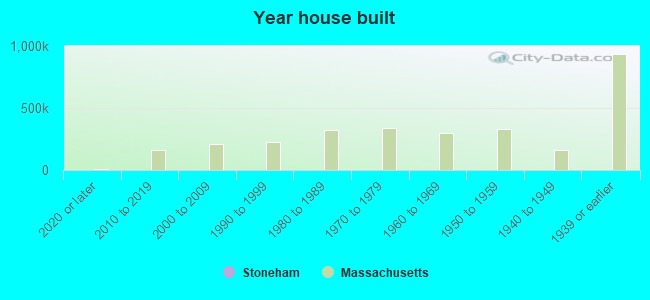
Year house built - Built 2010 or later (%)
Year house built - Built 2000 to 2009 (%)
Year house built - Built 1990 to 1999 (%)
Year house built - Built 1980 to 1989 (%)
Year house built - Built 1970 to 1979 (%)
Year house built - Built 1960 to 1969 (%)
Year house built - Built 1950 to 1959 (%)
Year house built - Built 1940 to 1949 (%)
Year house built - Built 1939 or earlier (%)
Median number of rooms in houses and condos
Median number of rooms in apartments
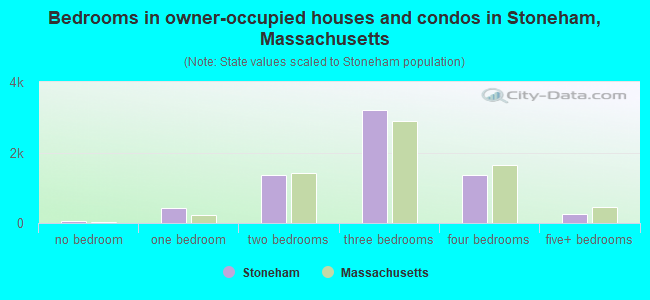
Median number of bedrooms in owner occupied houses
Mean number of bedrooms in owner occupied houses
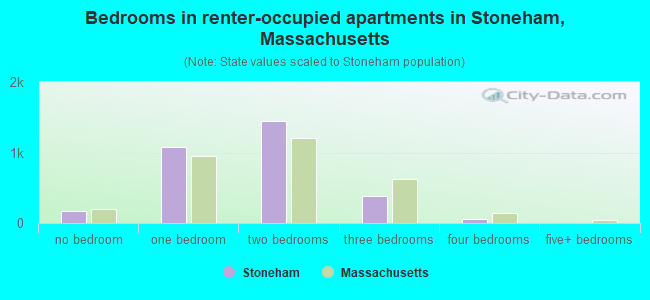
Median number of bedrooms in renter occupied houses
Mean number of bedrooms in renter occupied houses
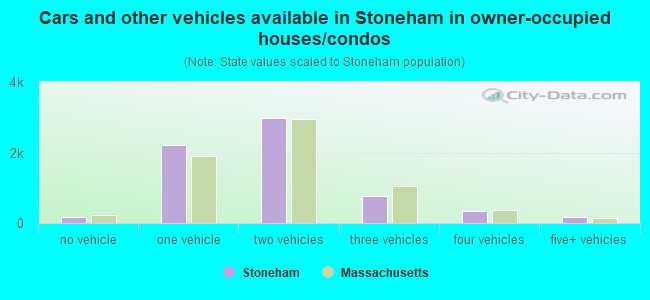
Median number of vehichles in owner occupied houses
Mean number of vehichles in owner occupied houses
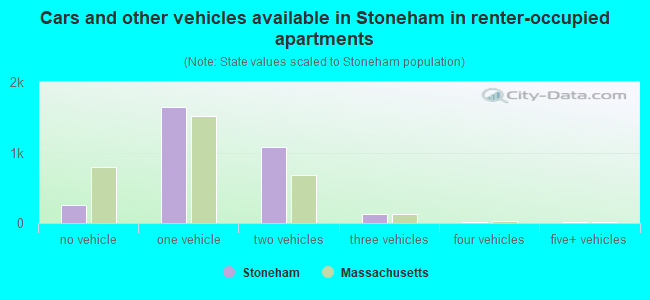
Median number of vehichles in renter occupied houses
Mean number of vehichles in renter occupied houses
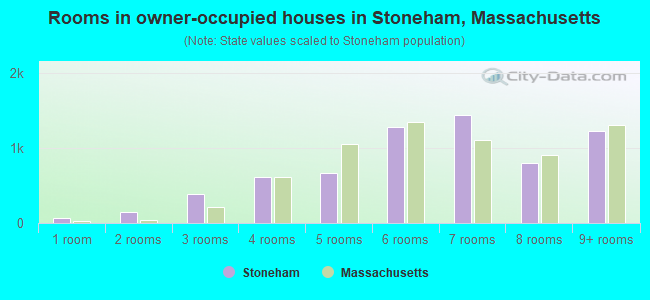
Rooms in owner-occupied houses - 1 room (%)
Rooms in owner-occupied houses - 2 rooms (%)
Rooms in owner-occupied houses - 3 rooms (%)
Rooms in owner-occupied houses - 4 rooms (%)
Rooms in owner-occupied houses - 5 rooms (%)
Rooms in owner-occupied houses - 6 rooms (%)
Rooms in owner-occupied houses - 7 rooms (%)
Rooms in owner-occupied houses - 8 rooms (%)
Rooms in owner-occupied houses - 9+ rooms (%)
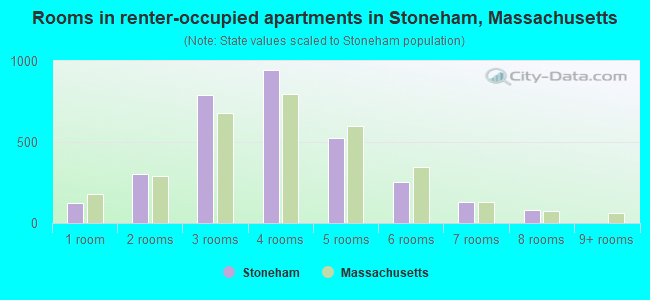
Rooms in renter-occupied houses - 1 room (%)
Rooms in renter-occupied houses - 2 rooms (%)
Rooms in renter-occupied houses - 3 rooms (%)
Rooms in renter-occupied houses - 4 rooms (%)
Rooms in renter-occupied houses - 5 rooms (%)
Rooms in renter-occupied houses - 6 rooms (%)
Rooms in renter-occupied houses - 7 rooms (%)
Rooms in renter-occupied houses - 8 rooms (%)
Rooms in renter-occupied houses - 9+ rooms (%)
Bedrooms in owner-occupied houses - no bedrooms (%)
Bedrooms in owner-occupied houses - 1 bedroom (%)
Bedrooms in owner-occupied houses - 2 bedrooms (%)
Bedrooms in owner-occupied houses - 3 bedrooms (%)
Bedrooms in owner-occupied houses - 4 bedrooms (%)
Bedrooms in owner-occupied houses - 5+ bedrooms (%)
Bedrooms in renter-occupied houses - no bedrooms (%)
Bedrooms in renter-occupied houses - 1 bedroom (%)
Bedrooms in renter-occupied houses - 2 bedrooms (%)
Bedrooms in renter-occupied houses - 3 bedrooms (%)
Bedrooms in renter-occupied houses - 4 bedrooms (%)
Bedrooms in renter-occupied houses - 5+ bedrooms (%)
Vehicles available in owner-occupied houses - no vehicle available (%)
Vehicles available in owner-occupied houses - 1 vehicle available(%)
Vehicles available in owner-occupied houses - 2 Vehicles available (%)
Vehicles available in owner-occupied houses - 3 Vehicles available (%)
Vehicles available in owner-occupied houses - 4 Vehicles available (%)
Vehicles available in owner-occupied houses - 5+ Vehicles available (%)
Vehicles available in renter-occupied houses - no vehicle available (%)
Vehicles available in renter-occupied houses - 1 vehicle available (%)
Vehicles available in renter-occupied houses - 2 Vehicles available (%)
Vehicles available in renter-occupied houses - 3 Vehicles available (%)
Vehicles available in renter-occupied houses - 4 Vehicles available (%)
Vehicles available in renter-occupied houses - 5+ Vehicles available (%)
Housing units in structures - 1, detached (%)
Housing units in structures - 1, attached (%)
Housing units in structures - 2 (%)
Housing units in structures - 3 or 4 (%)
Housing units in structures - 5 to 9 (%)
Housing units in structures - 10 to 19 (%)
Housing units in structures - 20 to 49 (%)
Housing units in structures - 50 or more (%)
Housing units in structures - Mobile home (%)
Housing units in structures - Boat, RV, van, etc. (%)
Housing units in structures - Owners - 1, detached (%)
Housing units in structures - Owners - 1, attached (%)
Housing units in structures - Owners - 2 (%)
Housing units in structures - Owners - 3 or 4 (%)
Housing units in structures - Owners - 5 to 9 (%)
Housing units in structures - Owners - 10 to 19 (%)
Housing units in structures - Owners - 20 to 49 (%)
Housing units in structures - Owners - 50 or more (%)
Housing units in structures - Owners - Mobile home (%)
Housing units in structures - Owners - Boat, RV, van, etc. (%)
Housing units in structures - Renters - 1, detached (%)
Housing units in structures - Renters - 1, attached (%)
Housing units in structures - Renters - 2 (%)
Housing units in structures - Renters - 3 or 4 (%)
Housing units in structures - Renters - 5 to 9 (%)
Housing units in structures - Renters - 10 to 19 (%)
Housing units in structures - Renters - 20 to 49 (%)
Housing units in structures - Renters - 50 or more (%)
Housing units in structures - Renters - Mobile home (%)
Housing units in structures - Renters - Boat, RV, van, etc. (%)
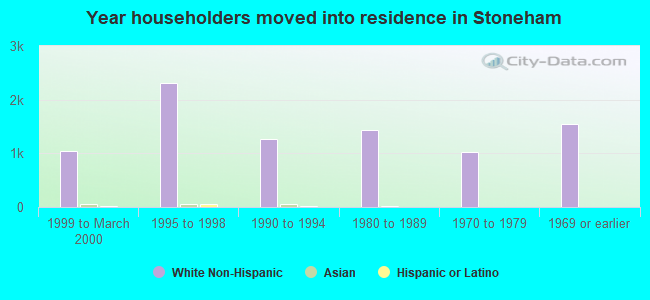
House/condo owner moved in on average (years ago)
Renter moved in on average (years ago)
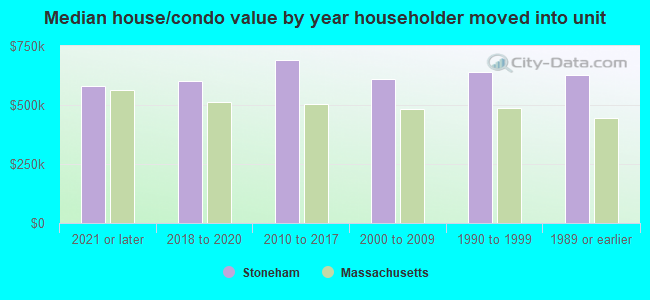
Year householder moved into unit - Moved in 1999 to March 2000 (%)
Year householder moved into unit - Moved in 1999 to March 2000 (%) - White
Year householder moved into unit - Moved in 1999 to March 2000 (%) - Black or African American
Year householder moved into unit - Moved in 1999 to March 2000 (%) - Asian
Year householder moved into unit - Moved in 1999 to March 2000 (%) - Hispanic or Latino
Year householder moved into unit - Moved in 1999 to March 2000 (%) - American Indian and Alaska Native
Year householder moved into unit - Moved in 1999 to March 2000 (%) - Multirace
Year householder moved into unit - Moved in 1999 to March 2000 (%) - Other Race
Year householder moved into unit - Moved in 1995 to 1998 (%)
Year householder moved into unit - Moved in 1995 to 1998 (%) - White
Year householder moved into unit - Moved in 1995 to 1998 (%) - Black or African American
Year householder moved into unit - Moved in 1995 to 1998 (%) - Asian
Year householder moved into unit - Moved in 1995 to 1998 (%) - Hispanic or Latino
Year householder moved into unit - Moved in 1995 to 1998 (%) - American Indian and Alaska Native
Year householder moved into unit - Moved in 1995 to 1998 (%) - Multirace
Year householder moved into unit - Moved in 1995 to 1998 (%) - Other Race
Year householder moved into unit - Moved in 1990 to 1994 (%)
Year householder moved into unit - Moved in 1990 to 1994 (%) - White
Year householder moved into unit - Moved in 1990 to 1994 (%) - Black or African American
Year householder moved into unit - Moved in 1990 to 1994 (%) - Asian
Year householder moved into unit - Moved in 1990 to 1994 (%) - Hispanic or Latino
Year householder moved into unit - Moved in 1990 to 1994 (%) - American Indian and Alaska Native
Year householder moved into unit - Moved in 1990 to 1994 (%) - Multirace
Year householder moved into unit - Moved in 1990 to 1994 (%) - Other Race
Year householder moved into unit - Moved in 1980 to 1989 (%)
Year householder moved into unit - Moved in 1980 to 1989 (%) - White
Year householder moved into unit - Moved in 1980 to 1989 (%) - Black or African American
Year householder moved into unit - Moved in 1980 to 1989 (%) - Asian
Year householder moved into unit - Moved in 1980 to 1989 (%) - Hispanic or Latino
Year householder moved into unit - Moved in 1980 to 1989 (%) - American Indian and Alaska Native
Year householder moved into unit - Moved in 1980 to 1989 (%) - Multirace
Year householder moved into unit - Moved in 1980 to 1989 (%) - Other Race
Year householder moved into unit - Moved in 1970 to 1979 (%)
Year householder moved into unit - Moved in 1970 to 1979 (%) - White
Year householder moved into unit - Moved in 1970 to 1979 (%) - Black or African American
Year householder moved into unit - Moved in 1970 to 1979 (%) - Asian
Year householder moved into unit - Moved in 1970 to 1979 (%) - Hispanic or Latino
Year householder moved into unit - Moved in 1970 to 1979 (%) - American Indian and Alaska Native
Year householder moved into unit - Moved in 1970 to 1979 (%) - Multirace
Year householder moved into unit - Moved in 1970 to 1979 (%) - Other Race
Year householder moved into unit - Moved in 1969 or earlier (%)
Year householder moved into unit - Moved in 1969 or earlier (%) - White
Year householder moved into unit - Moved in 1969 or earlier (%) - Black or African American
Year householder moved into unit - Moved in 1969 or earlier (%) - Asian
Year householder moved into unit - Moved in 1969 or earlier (%) - Hispanic or Latino
Year householder moved into unit - Moved in 1969 or earlier (%) - American Indian and Alaska Native
Year householder moved into unit - Moved in 1969 or earlier (%) - Multirace
Year householder moved into unit - Moved in 1969 or earlier (%) - Other Race
Housing units lacking complete plumbing facilities (%)
Housing units lacking complete kitchen facilities (%)
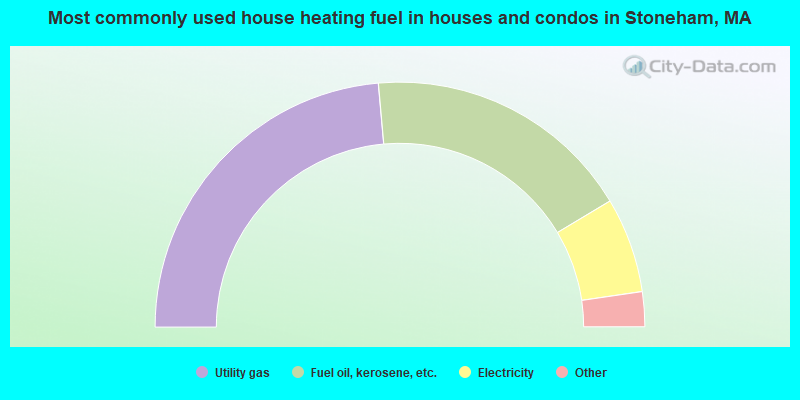
House heating fuel used in houses and condos - Utility gas (%)
House heating fuel used in houses and condos - Bottled, tank, or LP gas (%)
House heating fuel used in houses and condos - Electricity (%)
House heating fuel used in houses and condos - Fuel oil, kerosene, etc. (%)
House heating fuel used in houses and condos - Coal or coke (%)
House heating fuel used in houses and condos - Wood (%)
House heating fuel used in houses and condos - Solar energy (%)
House heating fuel used in houses and condos - Other fuel (%)
House heating fuel used in houses and condos - No fuel used (%)
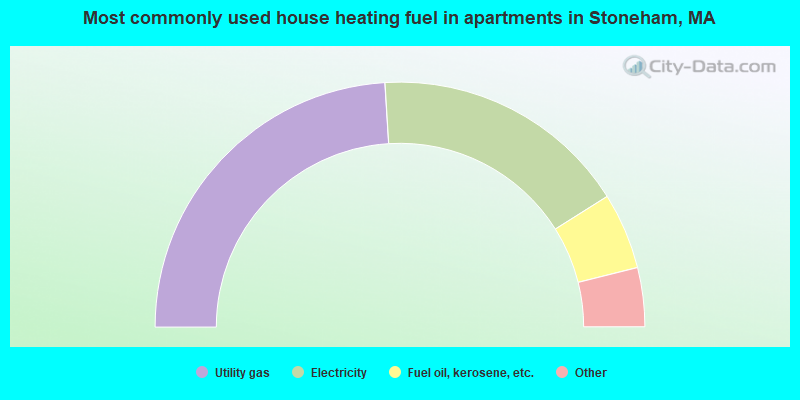
House heating fuel used in apartments - Utility gas (%)
House heating fuel used in apartments - Bottled, tank, or LP gas (%)
House heating fuel used in apartments - Electricity (%)
House heating fuel used in apartments - Fuel oil, kerosene, etc. (%)
House heating fuel used in apartments - Coal or coke (%)
House heating fuel used in apartments - Wood (%)
House heating fuel used in apartments - Solar energy (%)
House heating fuel used in apartments - Other fuel (%)
House heating fuel used in apartments - No fuel used (%)
Latest news about housing in Stoneham, MA collected exclusively by city-data.com from local newspapers, TV, and radio stations
Median year house/condo built: 1959Median year apartment built: 1970Household type by relationship:
Households: 22,906
Male householders: 4,381 (1,206 living alone ), Female householders: 5,236 (1,748 living alone )5,008 spouses (4,986 opposite-sex spouses ), 620 unmarried partners , (590 opposite-sex unmarried partners ), 5,715 children (5,396 natural , 85 adopted , 233 stepchildren ), 341 grandchildren , 184 brothers or sisters , 162 parents , 0 foster children , 445 other relatives , 708 non-relatives In group quarters: 101
Size of family households: 2,748 2-persons , 1,240 3-persons , 1,306 4-persons , 425 5-persons , 119 6-persons , 62 7-or-more-persons .
Size of nonfamily households: 3,080 1-person , 603 2-persons , 111 3-persons , 68 4-persons .
3,616 married couples with children. single-parent households (31 men , 393 women ).
79.2% of residents of Stoneham speak English at home. of residents speak Spanish at home (51% speak English very well , 27% speak English well , 23% speak English not well ).of residents speak other Indo-European language at home (70% speak English very well , 17% speak English well , 9% speak English not well , 4% don't speak English at all ).of residents speak Asian or Pacific Island language at home (47% speak English very well , 41% speak English well , 10% speak English not well , 1% don't speak English at all ).of residents speak other language at home (75% speak English very well , 12% speak English well , 12% speak English not well , 1% don't speak English at all ).
Foreign born population: 3,344 (14.6%)of them are naturalized citizens )
Median number of rooms in houses and condos:
Median number of rooms in apartments
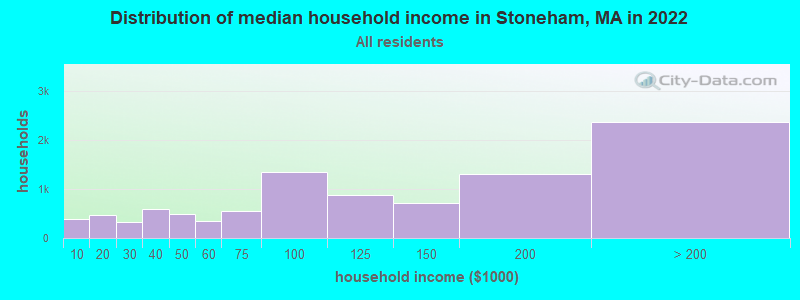
Stoneham, MA household income distribution 390 Less than $10,000477 $10,000 to $19,999327 $20,000 to $29,999597 $30,000 to $39,999496 $40,000 to $49,999337 $50,000 to $59,999547 $60,000 to $74,9991,351 $75,000 to $99,999869 $100,000 to $124,999710 $125,000 to $149,9991,298 $150,000 to $199,9992,360 $200,000 or more
Home value of owner - occupied houses in 2022 in Stoneham, MA 27 $30,000 to $34,99998 $50,000 to $59,99914 $60,000 to $69,999147 $200,000 to $249,999155 $250,000 to $299,999489 $300,000 to $399,999610 $400,000 to $499,9993,290 $500,000 to $749,9991,385 $750,000 to $999,999218 $1,000,000 to $1,499,99975 $2,000,000 or moreRent paid by renters in 2022 in Stoneham, MA 44 $100 to $14930 $150 to $19957 $200 to $24939 $250 to $29936 $300 to $34932 $350 to $39937 $400 to $4494 $450 to $4997 $550 to $5999 $700 to $74919 $750 to $79913 $800 to $89941 $900 to $999229 $1,000 to $1,249513 $1,250 to $1,499973 $1,500 to $1,999701 $2,000 to $2,49935 $2,500 to $2,999136 $3,000 to $3,49964 $3,500 or more165 No cash rent
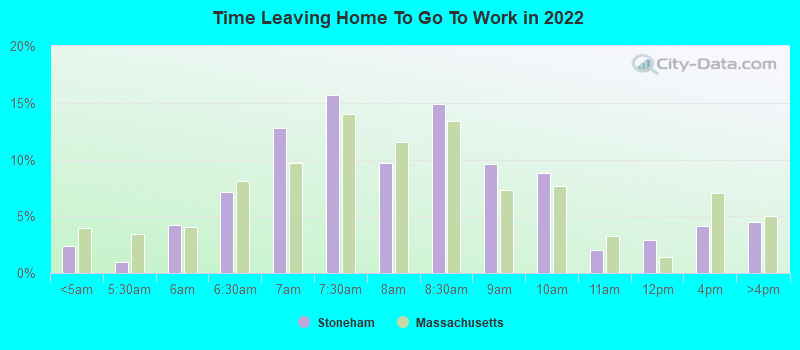
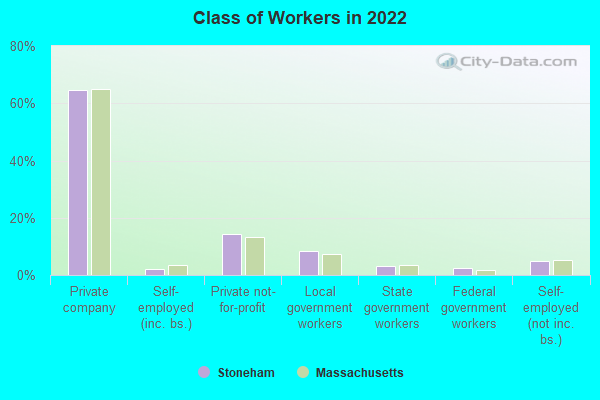
Percentage of workers working in this county: 75.1%Number of people working at home: 2,614 (20.3% of all workers )
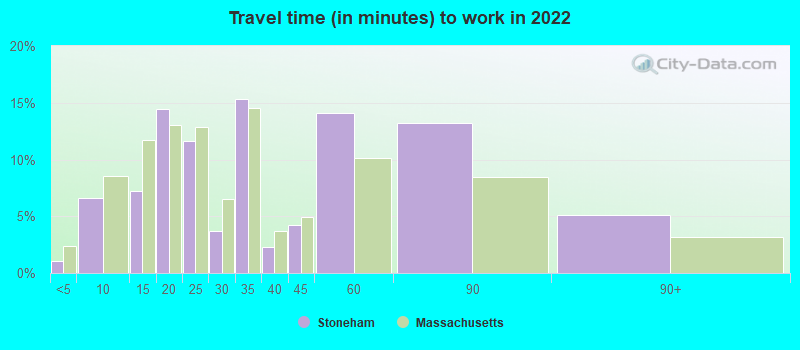
Travel time to work (commute)
Less than 5 minutes: 1425 to 9 minutes: 80010 to 14 minutes: 1,33315 to 19 minutes: 1,33120 to 24 minutes: 1,20025 to 29 minutes: 76230 to 34 minutes: 1,79235 to 39 minutes: 12840 to 44 minutes: 49645 to 59 minutes: 80060 to 89 minutes: 1,30490 or more minutes: 66
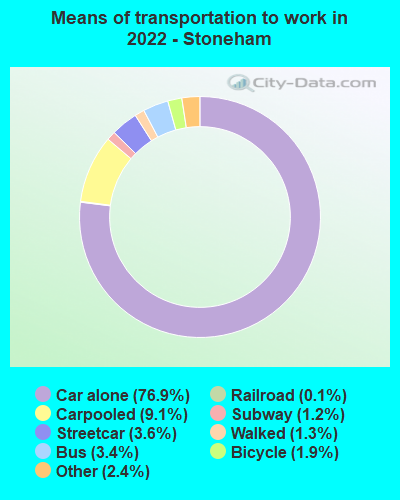
Means of transportation to work:
Drove a car alone: 7,840 (60.4%)Carpooled: 974 (7.5%)Bus : 274 (2.1%)Subway or elevated rail : 364 (2.8%)Long-distance train or commuter rail : 88 (0.7%)Light rail, streetcar or trolley : 18 (0.1%)Ferryboat: 11 (0.1%)Taxi: 322 (2.5%)Bicycle: 239 (1.8%)Walked: 133 (1.0%)Worked at home: 2,614 (20.1%)
Unemployment by race in 2022
Unemployment rate for White non-Hispanic residents 2.5% Males1.6% FemalesUnemployment rate for Black residents 3.3% FemalesUnemployment rate for Asian residents 5.0% Males2.1% FemalesUnemployment rate for two or more race residents 1.3% FemalesUnemployment rate for Hispanic or Latino residents 5.1% Males
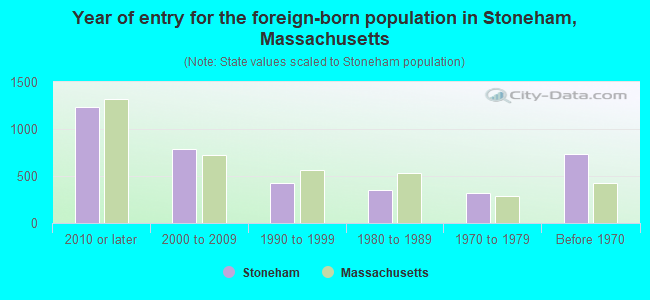
Year of entry for the foreign-born population in Stoneham, Massachusetts
1,232 2010 or later 789 2000 to 2009 426 1990 to 1999 349 1980 to 1989 324 1970 to 1979 738 Before 1970
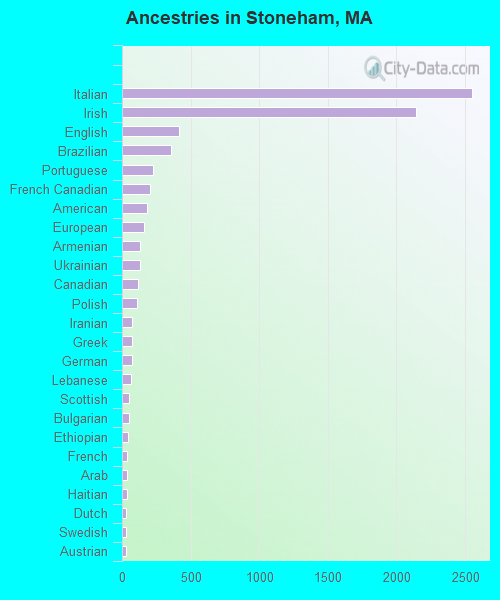
First ancestries reported:
Italian: 2,547 (24.1%)
Irish: 2,140 (20.3%)
English: 419 (4.0%)
Brazilian: 355 (3.4%)
Portuguese: 223 (2.1%)
French Canadian: 205 (1.9%)
American: 184 (1.7%)
European: 157 (1.5%)
Armenian: 128 (1.2%)
Ukrainian: 128 (1.2%)
Canadian: 118 (1.1%)
Polish: 109 (1.0%)
Iranian: 74 (0.7%)
Greek: 73 (0.7%)
German: 71 (0.7%)
Lebanese: 62 (0.6%)
Scottish: 54 (0.5%)
Bulgarian: 53 (0.5%)
Ethiopian: 46 (0.4%)
French: 40 (0.4%)
Arab: 34 (0.3%)
Haitian: 33 (0.3%)
Dutch: 31 (0.3%)
Swedish: 30 (0.3%)
Austrian: 28 (0.3%)
Northern European: 25 (0.2%)
Russian: 24 (0.2%)
Scotch-Irish: 23 (0.2%)
Lithuanian: 18 (0.2%)
Eastern European: 13 (0.1%)
Kenyan: 12 (0.1%)
Palestinian: 8 (0.08%)
Slovak: 7 (0.07%)
Celtic: 5 (0.05%)
British: 4 (0.04%) Most common places of birth for foreign-born residents (%): Brazil Stoneham:
18.6% (622)Massachusetts:
7.6% (92,959)
India Stoneham:
10.1% (339)Massachusetts:
6.8% (82,934)
China, excluding Hong Kong and Taiwan Stoneham:
8.8% (294)Massachusetts:
8.4% (103,233)
Algeria Stoneham:
5.3% (176)Massachusetts:
0.1% (1,720)
Ukraine Stoneham:
5.1% (172)Massachusetts:
0.9% (10,808)
Hong Kong Stoneham:
4.0% (134)Massachusetts:
0.7% (8,536)
Portugal Stoneham:
3.9% (132)Massachusetts:
4.1% (50,360)
Israel Stoneham:
3.8% (127)Massachusetts:
0.5% (6,073)
Thailand Stoneham:
3.3% (110)Massachusetts:
0.5% (5,553)
Colombia Stoneham:
3.2% (108)Massachusetts:
2.3% (27,810)
Ethiopia Stoneham:
2.7% (90)Massachusetts:
0.4% (5,467)
Italy Stoneham:
2.5% (84)Massachusetts:
1.4% (16,886)
Korea Stoneham:
2.2% (74)Massachusetts:
1.4% (17,613)
Costa Rica Stoneham:
2.1% (70)Massachusetts:
0.2% (2,160)
Philippines Stoneham:
2.0% (68)Massachusetts:
0.9% (10,810)
Canada Stoneham:
2.0% (67)Massachusetts:
2.3% (28,158)
Poland Stoneham:
2.0% (66)Massachusetts:
0.9% (10,915)
Japan Stoneham:
1.8% (60)Massachusetts:
0.6% (7,301)
Place of birth for U.S.-born residents:
This state: 16,125Other state: 2,915Northeast: 1,332Midwest: 503South: 604West: 471 92.0% of Stoneham residents lived in the same house 1 years ago.
Out of people who lived in different houses, 38.3% lived in this county.
Out of people who lived in different counties, 64.7% lived in Massachusetts.
Stoneham:
92.0%State average:
87.7%
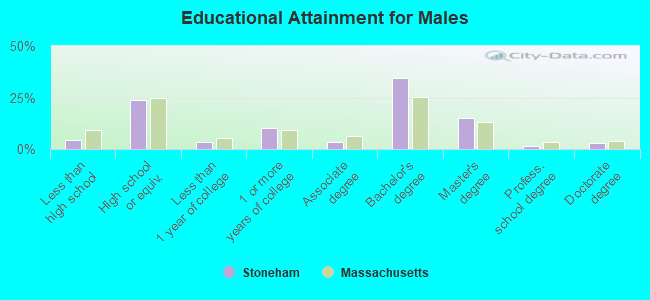
Education attainment for males 25 years and older:
No schooling: 33Nursery to 4th grade: 05th and 6th grade: 07th and 8th grade: 09th grade: 18610th grade: 2211th grade: 10912th grade, no diploma: 27High school graduate (or equivalency): 1,985Less than 1 year of college: 275Some college more than 1 year, no degree: 864Associate degree: 293Bachelor's degree: 2,884Master's degree: 1,266Professional school degree: 122Doctorate degree: 248
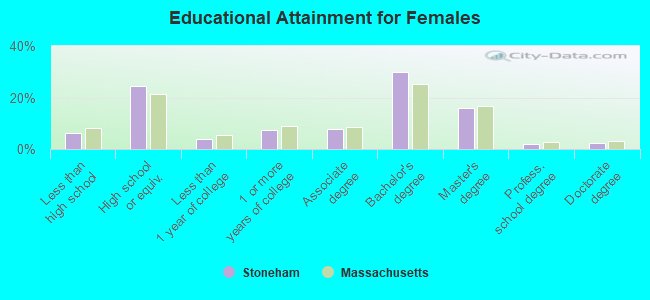
Education attainment for females 25 years and older:
No schooling: 108Nursery to 4th grade: 195th and 6th grade: 707th and 8th grade: 239th grade: 1610th grade: 10811th grade: 2312th grade, no diploma: 188High school graduate (or equivalency): 2,180Less than 1 year of college: 356Some college more than 1 year, no degree: 676Associate degree: 687Bachelor's degree: 2,682Master's degree: 1,439Professional school degree: 185Doctorate degree: 211
Housing units in structures:
One, detached: 5,326One, attached: 314Two: 8133 or 4: 5745 to 9: 28710 to 19: 68920 to 49: 1,00650 or more: 1,034Housing units lacking complete plumbing facilities in 2022: 0.1%Housing units lacking complete kitchen facilities in 2022: 0.3%House/condo owner moved in on average 16 years ago
Renter moved in on average 4 years ago
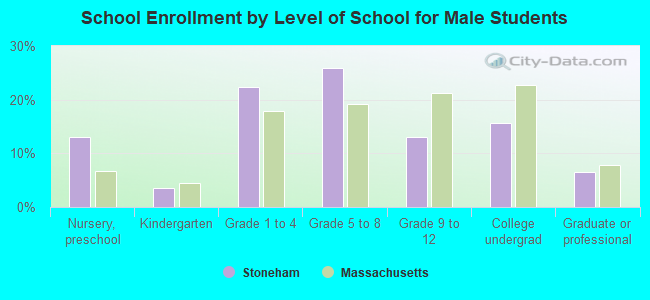
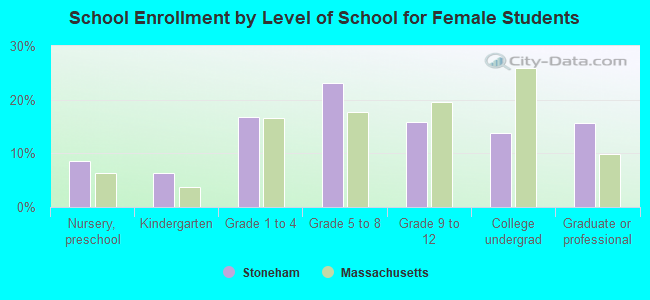
Private vs. public school enrollment:
Students in private schools in grades 1 to 8 (elementary and middle school): 149 Here:
7.2%Massachusetts:
10.3%
Students in private schools in grades 9 to 12 (high school): 152 Here:
22.4%Massachusetts:
12.3%
Students in private undergraduate colleges: 345 Here:
50.3%Massachusetts:
51.2%