Sterling, MA (Massachusetts) Houses and Residents
| Sterling: | $540,163 |
| Massachusetts: | $534,700 |
Total population: 7,808 (Urban population: 2,773, Rural population: 4,484 (53 farm, 4,431 nonfarm))
Houses: 2,637 (2,573 occupied: 2,188 owner occupied, 385 renter occupied)
| % of renters here: | 15% |
| State: | 38% |
Housing density: 86 houses/condos per square mile
Median price asked for vacant for-sale houses and condos in 2022 in this county: $182,682.
Median contract rent in 2022: $1,122 (lower quartile is $859, upper quartile is $1,699)
Median rent asked for vacant for-rent units in 2022: $1,159
Median gross rent in Sterling, MA in 2022: $1,284
Housing units in Sterling with a mortgage: 1,471 (62 second mortgage, 274 home equity loan, 0 both second mortgage and home equity loan)
Houses without a mortgage: 461


Latest news about housing in Sterling, MA collected exclusively by city-data.com from local newspapers, TV, and radio stations


Household type by relationship:
Households: 771,507- In family households: 644,137 (138,415 male householders, 64,187 female householders)
151,406 spouses, 234,038 children (220,335 natural, 5,096 adopted, 8,607 stepchildren), 11,080 grandchildren, 6,742 brothers or sisters, 7,870 parents, foster children, 7,297 other relatives, 18,119 non-relatives
- In nonfamily households: 127,370 (47,312 male householders (35,337 living alone)), 53,166 female householders (44,100 living alone)), 26,892 nonrelatives
- In group quarters: 27,045 (11,315 institutionalized population)
135,695 married couples with children.
42,745 single-parent households (8,218 men, 34,527 women).
96.2% of residents of Sterling speak English at home.
1.0% of residents speak Spanish at home (57% speak English very well, 33% speak English well, 10% speak English not well).
2.6% of residents speak other Indo-European language at home (86% speak English very well, 12% speak English well, 3% speak English not well).
0.1% of residents speak other language at home (100% speak English well).
Foreign born population: 264 (3.2%)
(40.5% of them are naturalized citizens)
| Here: | 6.4 |
| State: | 6.5 |
| Here: | 3.2 |
| State: | 4.0 |

- Bedrooms in owner-occupied houses and condos in Sterling, Massachusetts
- 0no bedroom
- 591 bedroom
- 3802 bedrooms
- 1,1373 bedrooms
- 5244 bedrooms
- 885+ bedrooms

- Bedrooms in renter-occupied apartments in Sterling, Massachusetts
- 0no bedroom
- 2011 bedroom
- 1182 bedrooms
- 573 bedrooms
- 04 bedrooms
- 95+ bedrooms

- Cars and other vehicles available in Sterling in owner-occupied houses/condos
- 60no vehicle
- 3051 vehicle
- 1,2922 vehicles
- 3483 vehicles
- 1354 vehicles
- 485+ vehicles

- Cars and other vehicles available in Sterling in renter-occupied apartments
- 72no vehicle
- 1681 vehicle
- 802 vehicles
- 523 vehicles
- 134 vehicles
- 05+ vehicles

- Rooms in owner-occupied houses in Sterling, Massachusetts
- 01 room
- 82 rooms
- 173 rooms
- 1324 rooms
- 3375 rooms
- 4306 rooms
- 4737 rooms
- 4018 rooms
- 3909+ rooms

- Rooms in renter-occupied apartments in Sterling, Massachusetts
- 01 room
- 832 rooms
- 623 rooms
- 1284 rooms
- 835 rooms
- 06 rooms
- 77 rooms
- 98 rooms
- 139+ rooms


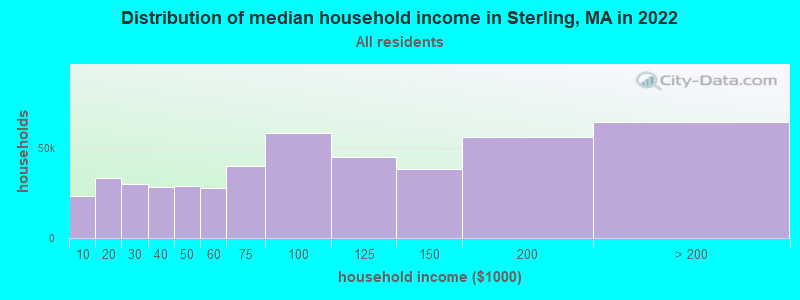
Sterling, MA household income distribution

- 23,287Less than $10,000
- 33,225$10,000 to $19,999
- 30,259$20,000 to $29,999
- 28,164$30,000 to $39,999
- 28,840$40,000 to $49,999
- 27,614$50,000 to $59,999
- 40,072$60,000 to $74,999
- 58,283$75,000 to $99,999
- 45,240$100,000 to $124,999
- 38,658$125,000 to $149,999
- 56,303$150,000 to $199,999
- 64,537$200,000 or more
Percentage of workers working in this county: 80.0%
Number of people working at home: 765 (16.0% of all workers)
Travel time to work (commute)
- Less than 5 minutes: 87
- 5 to 9 minutes: 259
- 10 to 14 minutes: 472
- 15 to 19 minutes: 458
- 20 to 24 minutes: 838
- 25 to 29 minutes: 316
- 30 to 34 minutes: 453
- 35 to 39 minutes: 105
- 40 to 44 minutes: 106
- 45 to 59 minutes: 291
- 60 to 89 minutes: 251
- 90 or more minutes: 157
Means of transportation to work:
- Drove a car alone: 3,494 (88.7%)
- Carpooled: 239 (6.1%)
- Railroad: 27 (0.7%)
- Walked: 26 (0.7%)
- Other means: 7 (0.2%)
- Worked at home: 148 (3.8%)


- Year of entry for the foreign-born population in Sterling, Massachusetts
- 161995 to March 2000
- 201990 to 1994
- 221985 to 1989
- 01980 to 1984
- 01975 to 1979
- 211970 to 1974
- 01965 to 1969
- 51Before 1965

First ancestries reported:
- Irish: 1,835 (19.0%)
- Italian: 1,474 (15.3%)
- French: 1,150 (11.9%)
- English: 1,004 (10.4%)
- German: 816 (8.5%)
- Other: 766 (7.9%)
- French Canadian: 582 (6.0%)
- Polish: 582 (6.0%)
- Swedish: 428 (4.4%)
- United States: 276 (2.9%)
- Scottish: 226 (2.3%)
- Lithuanian: 111 (1.1%)
- Greek: 85 (0.9%)
- Scotch-Irish: 84 (0.9%)
- Dutch: 39 (0.4%)
- Russian: 36 (0.4%)
- Arab: 29 (0.3%)
- Portuguese: 28 (0.3%)
- Hungarian: 20 (0.2%)
- Welsh: 20 (0.2%)
- Norwegian: 15 (0.2%)
- Ukrainian: 15 (0.2%)
- Swiss: 14 (0.1%)
- Czech: 9 (0.09%)
- Slovak: 9 (0.09%)
Most common places of birth for foreign-born residents (%):
| Sterling: | 23.8% (31) |
| Massachusetts: | 5.2% (40,247) |
| Sterling: | 22.3% (29) |
| Massachusetts: | 1.9% (14,883) |
| Sterling: | 16.9% (22) |
| Massachusetts: | 3.3% (25,403) |
| Sterling: | 12.3% (16) |
| Massachusetts: | 0.3% (2,058) |
| Sterling: | 11.5% (15) |
| Massachusetts: | 0.5% (3,834) |
| Sterling: | 7.7% (10) |
| Massachusetts: | 3.7% (28,319) |
| Sterling: | 5.4% (7) |
| Massachusetts: | 0.3% (2,642) |
Place of birth for U.S.-born residents:
- This state: 5,837
- Other state: 1,282
- Northeast: 859
- Midwest: 176
- South: 162
- West: 85
68% of Sterling residents lived in the same house 5 years ago.
Out of people who lived in different houses, 79% lived in this county.
Out of people who lived in different counties, 42% lived in Massachusetts.
Education attainment for males 25 years and older:
- No schooling: 6
- Nursery to 4th grade: 0
- 5th and 6th grade: 24
- 7th and 8th grade: 54
- 9th grade: 45
- 10th grade: 8
- 11th grade: 35
- 12th grade, no diploma: 54
- High school graduate (or equivalency): 579
- Less than 1 year of college: 158
- Some college more than 1 year, no degree: 272
- Associate degree: 240
- Bachelor's degree: 571
- Master's degree: 244
- Professional school degree: 42
- Doctorate degree: 26

Education attainment for females 25 years and older:
- No schooling: 5
- Nursery to 4th grade: 9
- 5th and 6th grade: 0
- 7th and 8th grade: 38
- 9th grade: 43
- 10th grade: 7
- 11th grade: 23
- 12th grade, no diploma: 54
- High school graduate (or equivalency): 592
- Less than 1 year of college: 192
- Some college more than 1 year, no degree: 375
- Associate degree: 320
- Bachelor's degree: 582
- Master's degree: 234
- Professional school degree: 27
- Doctorate degree: 25


Housing units in structures:
- One, detached: 2,116
- One, attached: 120
- Two: 219
- 3 or 4: 105
- 5 to 9: 49
- Mobile homes: 28
Median worth of mobile homes: $253,297

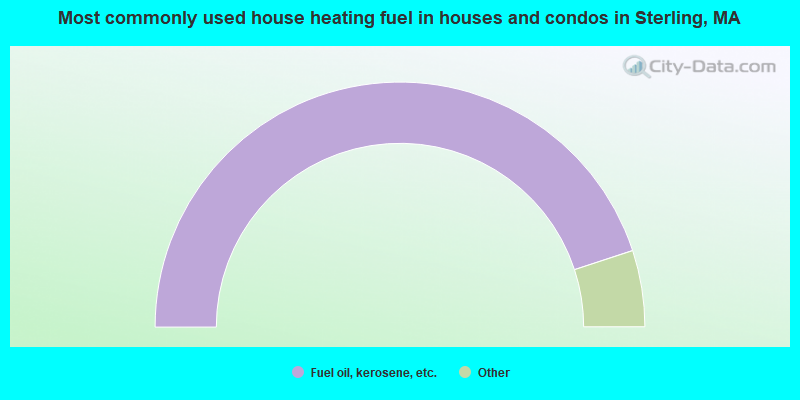
- 89.9%Fuel oil, kerosene, etc.
- 3.2%Electricity
- 3.0%Bottled, tank, or LP gas
- 2.6%Wood
- 0.6%Solar energy
- 0.5%Utility gas
- 0.3%Coal or coke
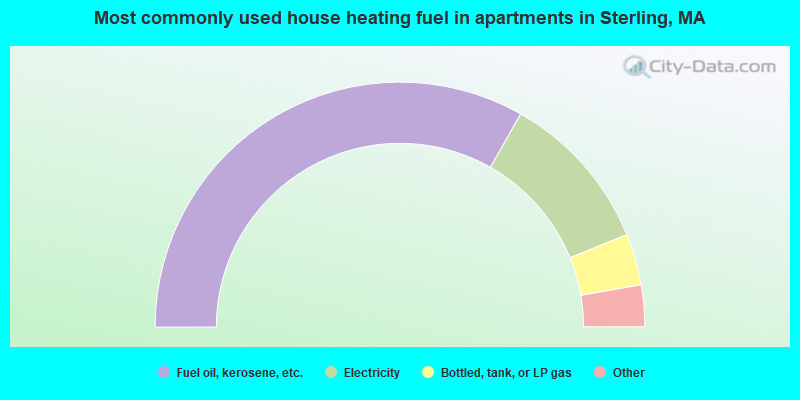
- 66.5%Fuel oil, kerosene, etc.
- 21.3%Electricity
- 6.8%Bottled, tank, or LP gas
- 2.9%Other fuel
- 2.6%Wood
Private vs. public school enrollment:
| Here: | 4.0% |
| Massachusetts: | 10.8% |
| Here: | 13.8% |
| Massachusetts: | 12.2% |
| Here: | 43.8% |
| Massachusetts: | 48.2% |


