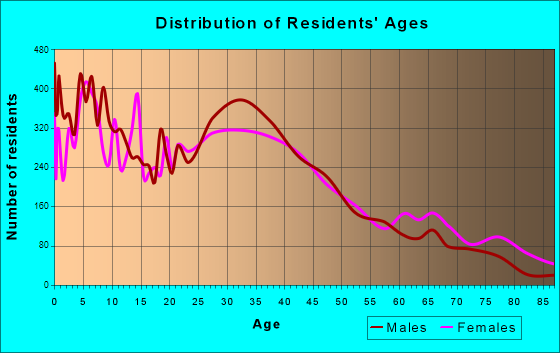
Stanton, CA (California) Houses and Residents
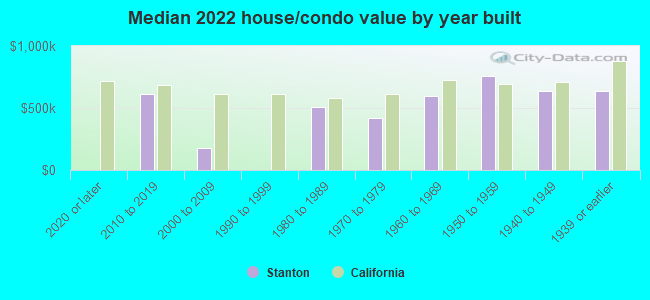
| Stanton: | $550,648 |
| California: | $715,900 |
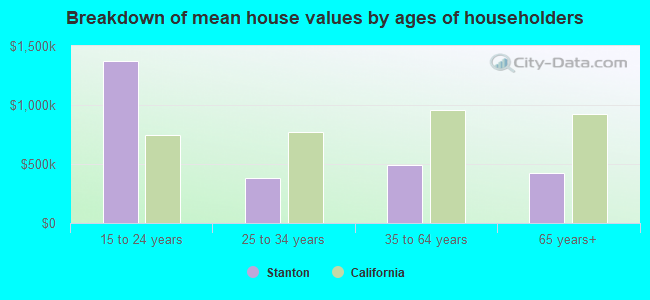
Mean price in 2022:
Detached houses: $591,623
Here: $591,623 State: $988,808 Townhouses or other attached units: $393,019
Here: $393,019 State: $838,546 In 3-to-4-unit structures: $341,265
Here: $341,265 State: $824,253 In 5-or-more-unit structures: $359,619
Here: $359,619 State: $730,996 Mobile homes: $93,400
Here: $93,400 State: $184,506
Total population: 38,719 (Urban population: 36,934, Rural population: 0)
Houses: 12,757 (12,316 occupied: 6,094 owner occupied, 6,269 renter occupied)
| % of renters here: | 51% |
| State: | 44% |
Housing density: 4,083 houses/condos per square mile
Median price asked for vacant for-sale houses and condos in 2022: $235,979.
Median contract rent in 2022: $1,736 (lower quartile is $1,398, upper quartile is over $2,000)
Median rent asked for vacant for-rent units in 2022: $2,097
Median gross rent in Stanton, CA in 2022: $1,832
Housing units in Stanton with a mortgage: 3,246 (144 second mortgage, 9 home equity loan, 107 both second mortgage and home equity loan)
Houses without a mortgage: 8
Median household income for houses/condos with a mortgage: $107,193
Median household income for apartments without a mortgage: $80,543
Median monthly housing costs: $1,754
Compare current foreclosures near Stanton, CA:
| Photo | Address | Area | Beds / Baths | Price | Details |
|---|---|---|---|---|---|

|
#1
Jane Way
Stanton, CA 90680
|
1,078 sq. feet
|
2 baths 3 beds |
show details | |

|
#2
Palais Rd
Stanton, CA 90680
|
1,474 sq. feet
|
2 baths 3 beds |
show details | |

|
#3
Santa Monica Ave
Stanton, CA 90680
|
1,268 sq. feet
|
2 baths 2 beds |
show details | |

|
#4
Sandalwood Way
Stanton, CA 90680
|
724 sq. feet
|
2 baths 3 beds |
show details | |

|
#5
Fulton Way
Stanton, CA 90680
|
850 sq. feet
|
1 baths 2 beds |
show details | |

|
#6
Western Ave
Stanton, CA 90680
|
1,303 sq. feet
|
2 baths 4 beds |
show details | |

|
#7
Meadowbrook Way
Stanton, CA 90680
|
1,260 sq. feet
|
3 baths 3 beds |
show details | |

|
#8
Garrett Rd
Stanton, CA 90680
|
1,202 sq. feet
|
2 baths 3 beds |
show details | |

|
#9
Knott Ave # 3
Stanton, CA 90680
|
1,333 sq. feet
|
- baths 2 beds |
show details | |

|
#10
Main St
Stanton, CA 90680
|
- sq. feet
|
- baths - beds |
show details |
| Photo | Address | Area | Beds / Baths | Price | Details |
|---|---|---|---|---|---|

|
#11
Katella Ave Apt 169
Stanton, CA 90680
|
- sq. feet
|
- baths - beds |
show details | |

|
#12
W Briar Oaks Dr Apt C
Stanton, CA 90680
|
- sq. feet
|
- baths - beds |
show details | |

|
#13
Beach Blvd Ste 100
Stanton, CA 90680
|
- sq. feet
|
- baths - beds |
show details | |

|
#14
Beach Blvd # 141
Stanton, CA 90680
|
- sq. feet
|
- baths - beds |
show details | |

|
#15
Katella Ave Apt 399b
Stanton, CA 90680
|
- sq. feet
|
- baths - beds |
show details | |

|
#16
Eaton Way
Stanton, CA 90680
|
- sq. feet
|
- baths - beds |
show details | |

|
#17
Rose St
Stanton, CA 90680
|
- sq. feet
|
- baths - beds |
show details | |

|
#18
Harmony Ln
Stanton, CA 90680
|
- sq. feet
|
- baths - beds |
show details | |

|
#19
Hawkstone Ave
Whittier, CA 90605
|
1,444 sq. feet
|
2 baths 4 beds |
$674,900
|
show details |

|
#20
Beach Blvd
Stanton, CA 90680
|
- sq. feet
|
- baths - beds |
show details |
| Photo | Address | Area | Beds / Baths | Price | Details |
|---|---|---|---|---|---|

|
#21
Dunrobin Ave
Downey, CA 90242
|
3,000 sq. feet
|
4 baths 8 beds |
show details | |

|
#22
And 6111 Northside Drive
Los Angeles, CA 90022
|
1,329 sq. feet
|
4 baths 3 beds |
show details | |

|
#23
Redondo Avenue, Units 5-8
Long Beach, CA 90804
|
3,360 sq. feet
|
4 baths 8 beds |
show details | |

|
#24
W Arbor St # 57
Long Beach, CA 90805
|
1,585 sq. feet
|
2 baths 3 beds |
show details | |

|
#25
Elburg St Unit A
Paramount, CA 90723
|
1,131 sq. feet
|
2 baths 3 beds |
show details | |

|
#26
E Jackson Ave Unit C
Anaheim, CA 92806
|
1,266 sq. feet
|
2 baths 3 beds |
show details | |

|
#27
Norwalk Blvd Apt
Hawaiian Gardens, CA 90716
|
800 sq. feet
|
2 baths 1 beds |
show details | |

|
#28
Mira Mar Ave
Long Beach, CA 90814
|
1,902 sq. feet
|
2 baths 4 beds |
show details | |

|
#29
Starburst Ct # 8
Newport Beach, CA 92663
|
1,157 sq. feet
|
2 baths 2 beds |
show details | |

|
#30
E Lincoln St
Carson, CA 90745
|
1,422 sq. feet
|
2 baths 5 beds |
show details |
| Photo | Address | Area | Beds / Baths | Price | Details |
|---|---|---|---|---|---|

|
#31
S Wilmington Ave Apt A
Compton, CA 90220
|
1,137 sq. feet
|
2 baths 3 beds |
show details | |

|
#32
Hawaiian Ave
Lakewood, CA 90715
|
1,048 sq. feet
|
1 baths 3 beds |
show details | |

|
#33
Ibbetson Ave
Lakewood, CA 90713
|
1,044 sq. feet
|
1 baths 3 beds |
show details | |

|
#34
Centralia St Unit 94
Lakewood, CA 90715
|
1,056 sq. feet
|
1 baths 2 beds |
show details | |

|
#35
Wagon Train Ln
Diamond Bar, CA 91765
|
3,554 sq. feet
|
3 baths 4 beds |
show details | |

|
#36
E 129th St
Compton, CA 90222
|
1,673 sq. feet
|
1 baths 3 beds |
show details | |

|
#37
Santa Fe Ave
Lynwood, CA 90262
|
1,124 sq. feet
|
2 baths 3 beds |
show details | |

|
#38
Claretta Ave
Lakewood, CA 90715
|
1,074 sq. feet
|
1 baths 3 beds |
show details | |

|
#39
Geranium
Irvine, CA 92618
|
1,344 sq. feet
|
2 baths 2 beds |
show details | |

|
#40
Saint Albans Dr
Los Alamitos, CA 90720
|
- sq. feet
|
5 baths 5 beds |
show details |
| Photo | Address | Area | Beds / Baths | Price | Details |
|---|---|---|---|---|---|

|
#41
Cedar Ave
Lynwood, CA 90262
|
1,092 sq. feet
|
2 baths 3 beds |
show details | |

|
#42
Park Rock Dr
La Puente, CA 91744
|
1,450 sq. feet
|
2 baths 3 beds |
show details | |

|
#43
E Keynote St
Long Beach, CA 90808
|
1,064 sq. feet
|
1 baths 2 beds |
show details | |

|
#44
S Towner St
Santa Ana, CA 92707
|
1,669 sq. feet
|
2 baths 3 beds |
show details | |

|
#45
El Selinda Ave
Bell, CA 90201
|
1,182 sq. feet
|
1 baths 3 beds |
show details | |

|
#46
Myrtle Ave
Long Beach, CA 90807
|
3,563 sq. feet
|
4 baths 6 beds |
show details | |

|
#47
E Turmont St
Carson, CA 90746
|
1,532 sq. feet
|
2 baths 4 beds |
show details | |

|
#48
Dunrobin Ave
Lakewood, CA 90713
|
1,032 sq. feet
|
1 baths 2 beds |
show details | |

|
#49
E 7th St
Long Beach, CA 90813
|
2,456 sq. feet
|
4 baths 6 beds |
show details | |

|
Check over 1 million property listings on Foreclosure.com!
|
browse all offers | |||

Latest news about housing in Stanton, CA collected exclusively by city-data.com from local newspapers, TV, and radio stations

 | Why do people still rent apartments? (79 replies) |
| Orange County Real Estate Trends (206 replies) |
| Looking to move (back) to SoCal but not home to LA (12 replies) |
| Average apartment rent in OC hits an all time high (15 replies) |
| OC housing hits record high:655k (218 replies) |
| Castro Valley - Stanton Ave - Is ambulance noise a concern? (0 replies) |
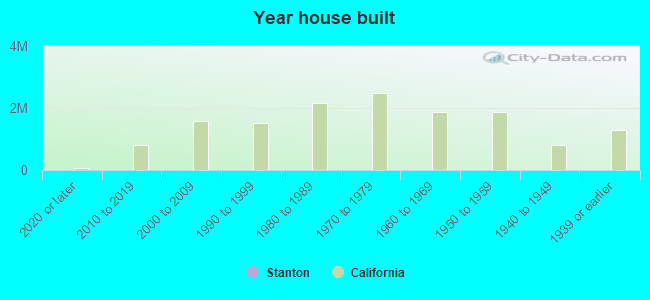
Median year apartment built: 1973
Household type by relationship:
Households: 37,981- Male householders: 6,457 (1,490 living alone), Female householders: 5,598 (1,615 living alone)
5,584 spouses (5,551 opposite-sex spouses), 624 unmarried partners, (559 opposite-sex unmarried partners), 12,629 children (11,819 natural, 454 adopted, 355 stepchildren), 848 grandchildren, 1,438 brothers or sisters, 1,783 parents, 0 foster children, 1,160 other relatives, 1,553 non-relatives
- In group quarters: 303
Size of family households: 2,320 2-persons, 1,925 3-persons, 1,915 4-persons, 1,129 5-persons, 569 6-persons, 675 7-or-more-persons.
Size of nonfamily households: 3,235 1-person, 398 2-persons, 79 3-persons, 55 4-persons, 4 5-persons, 9 6-persons.
4,987 married couples with children.
2,005 single-parent households (681 men, 1,324 women).
31.3% of residents of Stanton speak English at home.
42.7% of residents speak Spanish at home (58% speak English very well, 18% speak English well, 16% speak English not well, 8% don't speak English at all).
1.0% of residents speak other Indo-European language at home (38% speak English very well, 52% speak English well, 10% speak English not well).
23.1% of residents speak Asian or Pacific Island language at home (37% speak English very well, 24% speak English well, 31% speak English not well, 8% don't speak English at all).
2.4% of residents speak other language at home (56% speak English very well, 25% speak English well, 11% speak English not well, 9% don't speak English at all).
Foreign born population: 16,167 (42.6%)
(58.8% of them are naturalized citizens)
| Here: | 5.2 |
| State: | 6.0 |
| Here: | 3.9 |
| State: | 3.9 |
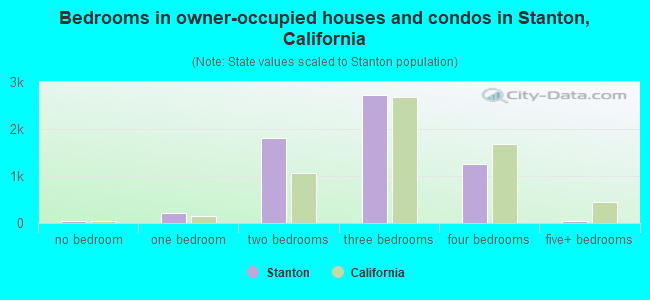
- Bedrooms in owner-occupied houses and condos in Stanton, California
- 51no bedroom
- 2131 bedroom
- 1,8102 bedrooms
- 2,7283 bedrooms
- 1,2464 bedrooms
- 485+ bedrooms
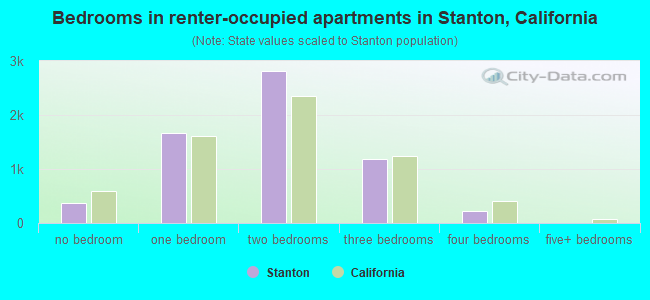
- Bedrooms in renter-occupied apartments in Stanton, California
- 370no bedroom
- 1,6661 bedroom
- 2,8162 bedrooms
- 1,1923 bedrooms
- 2184 bedrooms
- 75+ bedrooms
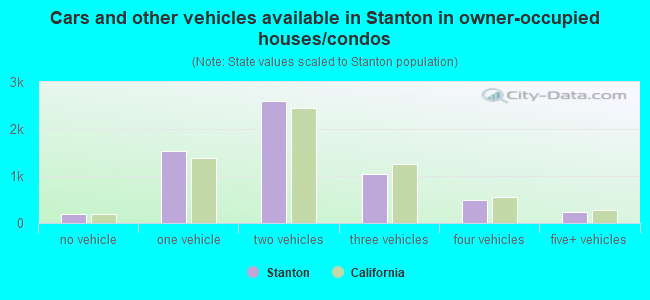
- Cars and other vehicles available in Stanton in owner-occupied houses/condos
- 196no vehicle
- 1,5331 vehicle
- 2,5972 vehicles
- 1,0493 vehicles
- 4854 vehicles
- 2335+ vehicles
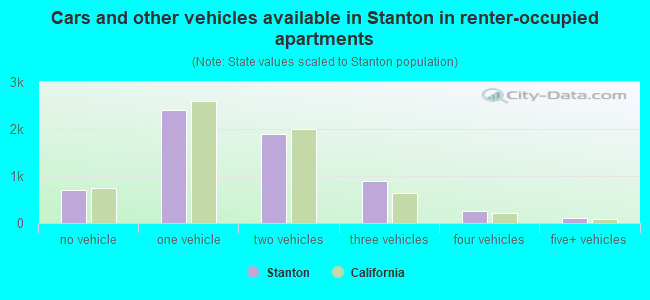
- Cars and other vehicles available in Stanton in renter-occupied apartments
- 709no vehicle
- 2,4111 vehicle
- 1,8882 vehicles
- 9043 vehicles
- 2594 vehicles
- 995+ vehicles
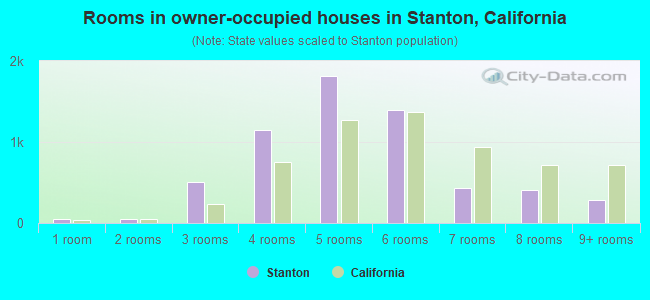
- Rooms in owner-occupied houses in Stanton, California
- 491 room
- 502 rooms
- 5043 rooms
- 1,1464 rooms
- 1,8165 rooms
- 1,4006 rooms
- 4337 rooms
- 4128 rooms
- 2859+ rooms
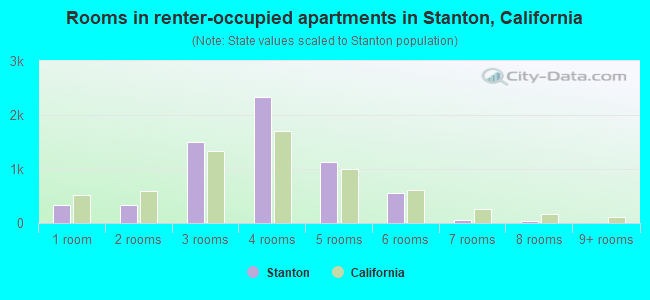
- Rooms in renter-occupied apartments in Stanton, California
- 3311 room
- 3392 rooms
- 1,5063 rooms
- 2,3314 rooms
- 1,1225 rooms
- 5506 rooms
- 517 rooms
- 348 rooms
- 79+ rooms
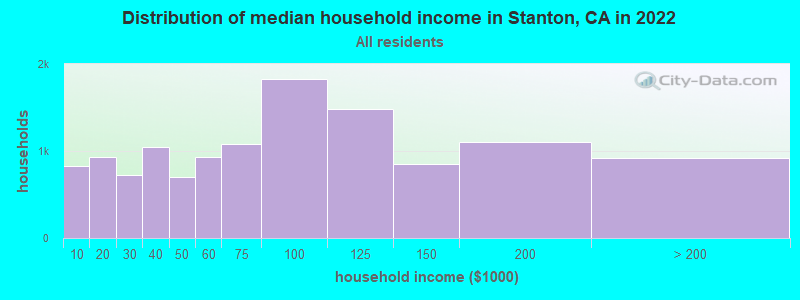
Stanton, CA household income distribution

- 827Less than $10,000
- 928$10,000 to $19,999
- 721$20,000 to $29,999
- 1,046$30,000 to $39,999
- 705$40,000 to $49,999
- 932$50,000 to $59,999
- 1,086$60,000 to $74,999
- 1,832$75,000 to $99,999
- 1,481$100,000 to $124,999
- 848$125,000 to $149,999
- 1,099$150,000 to $199,999
- 918$200,000 or more
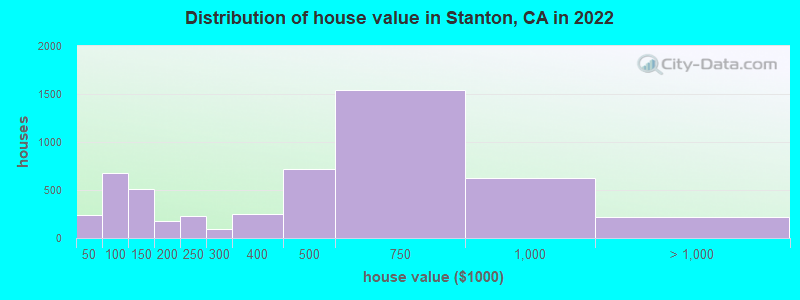
Home value of owner - occupied houses in 2022 in Stanton, CA
-
- 59Less than $10,000
- 10$10,000 to $14,999
- 36$15,000 to $19,999
- 16$25,000 to $29,999
- 11$30,000 to $34,999
- 6$35,000 to $39,999
- 102$40,000 to $49,999
- 119$50,000 to $59,999
- 65$60,000 to $69,999
- 137$70,000 to $79,999
- 193$80,000 to $89,999
- 58$90,000 to $99,999
- 391$100,000 to $124,999
- 114$125,000 to $149,999
- 162$150,000 to $174,999
- 14$175,000 to $199,999
- 233$200,000 to $249,999
- 90$250,000 to $299,999
- 247$300,000 to $399,999
- 717$400,000 to $499,999
- 1,538$500,000 to $749,999
- 619$750,000 to $999,999
- 204$1,000,000 to $1,499,999
- 15$2,000,000 or more
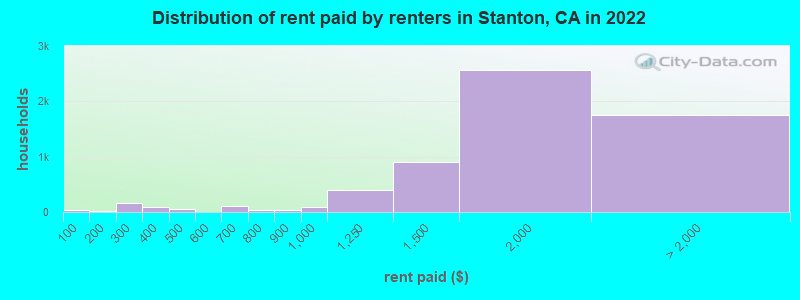
Rent paid by renters in 2022 in Stanton, CA
-
- 34Less than $100
- 12$100 to $149
- 155$200 to $249
- 7$250 to $299
- 77$300 to $349
- 9$350 to $399
- 50$400 to $449
- 8$450 to $499
- 32$600 to $649
- 67$650 to $699
- 8$700 to $749
- 32$750 to $799
- 44$800 to $899
- 91$900 to $999
- 406$1,000 to $1,249
- 897$1,250 to $1,499
- 2,566$1,500 to $1,999
- 1,250$2,000 to $2,499
- 273$2,500 to $2,999
- 38$3,000 to $3,499
- 85$3,500 or more
- 107No cash rent
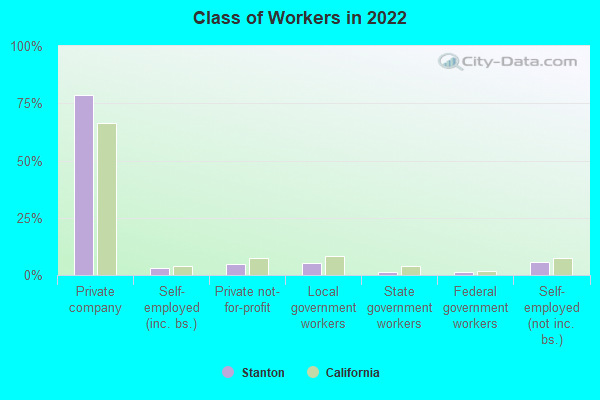
Percentage of workers working in this county: 84.6%
Number of people working at home: 1,485 (8.4% of all workers)
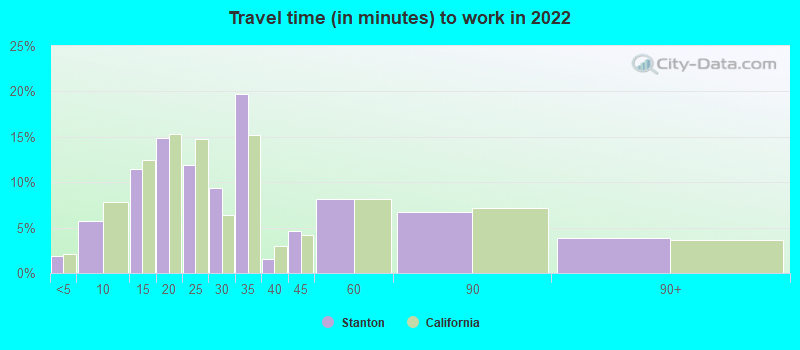
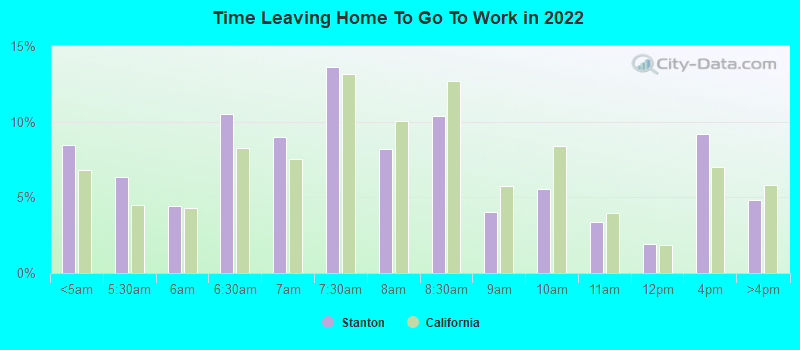
Travel time to work (commute)
- Less than 5 minutes: 76
- 5 to 9 minutes: 792
- 10 to 14 minutes: 1,271
- 15 to 19 minutes: 2,378
- 20 to 24 minutes: 2,594
- 25 to 29 minutes: 1,205
- 30 to 34 minutes: 3,366
- 35 to 39 minutes: 590
- 40 to 44 minutes: 694
- 45 to 59 minutes: 1,653
- 60 to 89 minutes: 927
- 90 or more minutes: 255
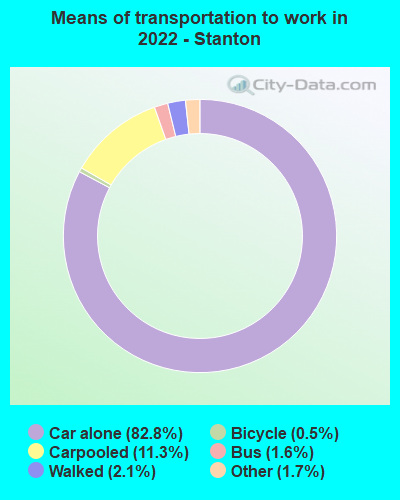
Means of transportation to work:
- Drove a car alone: 5,231 (66.8%)
- Carpooled: 771 (9.8%)
- Bus: 93 (1.2%)
- Taxi: 124 (1.6%)
- Bicycle: 31 (0.4%)
- Walked: 131 (1.7%)
- Worked at home: 1,485 (19.0%)
- Unemployment by race in 2022
- Unemployment rate for White non-Hispanic residents
- 1.6%Males
- 5.1%Females
- Unemployment rate for Black residents
- 19.1%Males
- 14.4%Females
- Unemployment rate for Asian residents
- 6.4%Males
- 4.7%Females
- Unemployment rate for other race residents
- 4.0%Males
- 2.5%Females
- Unemployment rate for two or more race residents
- 13.5%Males
- 18.2%Females
- Unemployment rate for Hispanic or Latino residents
- 6.2%Males
- 6.5%Females
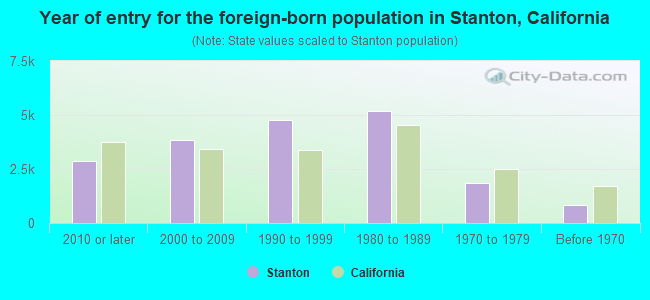
- Year of entry for the foreign-born population in Stanton, California
- 2,8482010 or later
- 3,8492000 to 2009
- 4,7831990 to 1999
- 5,1891980 to 1989
- 1,8601970 to 1979
- 829Before 1970
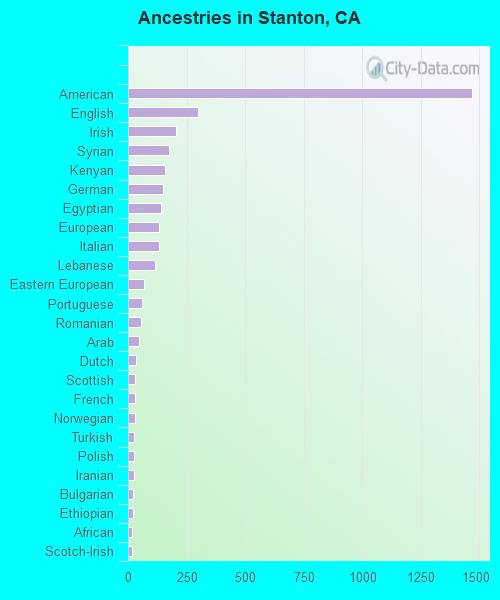
First ancestries reported:
- American: 1,468 (5.7%)
- English: 297 (1.1%)
- Irish: 204 (0.8%)
- Syrian: 174 (0.7%)
- Kenyan: 159 (0.6%)
- German: 148 (0.6%)
- Egyptian: 140 (0.5%)
- European: 132 (0.5%)
- Italian: 131 (0.5%)
- Lebanese: 116 (0.4%)
- Eastern European: 67 (0.3%)
- Portuguese: 60 (0.2%)
- Romanian: 56 (0.2%)
- Arab: 47 (0.2%)
- Dutch: 34 (0.1%)
- Scottish: 32 (0.1%)
- French: 31 (0.1%)
- Norwegian: 29 (0.1%)
- Turkish: 27 (0.1%)
- Polish: 24 (0.09%)
- Iranian: 24 (0.09%)
- Bulgarian: 23 (0.09%)
- Ethiopian: 20 (0.08%)
- African: 17 (0.07%)
- Scotch-Irish: 16 (0.06%)
- Russian: 15 (0.06%)
- Armenian: 12 (0.05%)
- Austrian: 10 (0.04%)
- Canadian: 9 (0.03%)
- Swedish: 9 (0.03%)
- Welsh: 9 (0.03%)
- Danish: 7 (0.03%)
- Scandinavian: 6 (0.02%)
- West Indian: 6 (0.02%)
- British: 5 (0.02%)
- Hungarian: 5 (0.02%)
- Lithuanian: 5 (0.02%)
- Serbian: 3 (0.01%)
Most common places of birth for foreign-born residents (%):
| Stanton: | 39.8% (6,441) |
| California: | 37.2% (3,881,193) |
| Stanton: | 34.3% (5,544) |
| California: | 4.9% (512,335) |
| Stanton: | 5.1% (821) |
| California: | 7.8% (818,297) |
| Stanton: | 2.9% (470) |
| California: | 3.0% (315,248) |
| Stanton: | 2.0% (328) |
| California: | 0.3% (30,949) |
| Stanton: | 1.6% (254) |
| California: | 0.7% (74,025) |
| Stanton: | 1.6% (251) |
| California: | 2.8% (290,436) |
Place of birth for U.S.-born residents:
- This state: 19,300
- Other state: 2,511
- Northeast: 416
- Midwest: 860
- South: 754
- West: 486
93.5% of Stanton residents lived in the same house 1 years ago.
Out of people who lived in different houses, 43.3% lived in this county.
Out of people who lived in different counties, 81.4% lived in California.
| Stanton: | 93.5% |
| State average: | 88.9% |
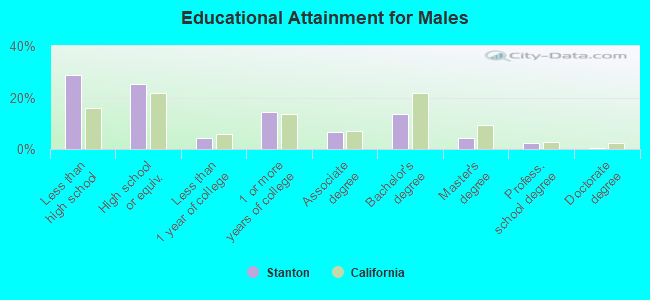
Education attainment for males 25 years and older:
- No schooling: 1,001
- Nursery to 4th grade: 257
- 5th and 6th grade: 542
- 7th and 8th grade: 429
- 9th grade: 431
- 10th grade: 207
- 11th grade: 162
- 12th grade, no diploma: 583
- High school graduate (or equivalency): 3,144
- Less than 1 year of college: 527
- Some college more than 1 year, no degree: 1,815
- Associate degree: 808
- Bachelor's degree: 1,701
- Master's degree: 536
- Professional school degree: 308
- Doctorate degree: 59
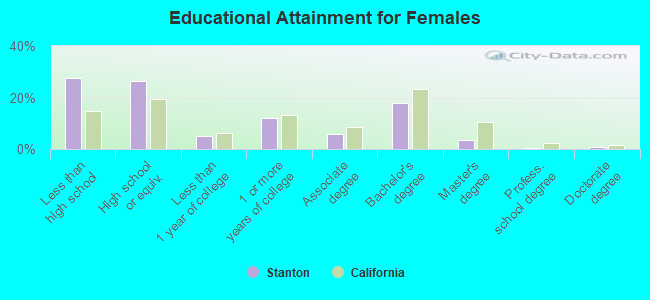
Education attainment for females 25 years and older:
- No schooling: 819
- Nursery to 4th grade: 159
- 5th and 6th grade: 621
- 7th and 8th grade: 241
- 9th grade: 409
- 10th grade: 228
- 11th grade: 260
- 12th grade, no diploma: 926
- High school graduate (or equivalency): 3,489
- Less than 1 year of college: 683
- Some college more than 1 year, no degree: 1,613
- Associate degree: 772
- Bachelor's degree: 2,344
- Master's degree: 481
- Professional school degree: 70
- Doctorate degree: 122
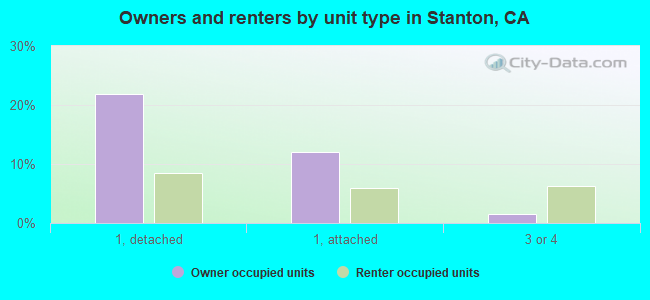
Housing units in structures:
- One, detached: 3,485
- One, attached: 1,865
- Two: 202
- 3 or 4: 1,077
- 5 to 9: 768
- 10 to 19: 813
- 20 to 49: 777
- 50 or more: 1,916
- Mobile homes: 1,847
- Boats, RVs, vans, etc.: 3
Median worth of mobile homes: $131,185
Housing units lacking complete kitchen facilities in 2022: 5.3%
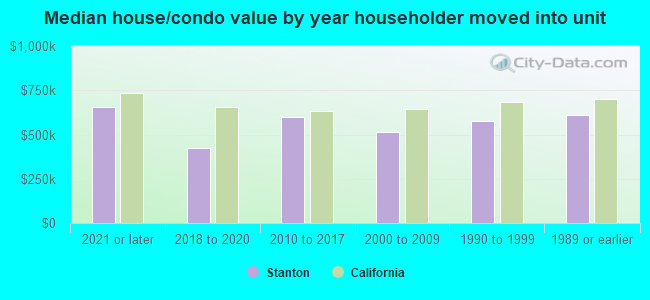
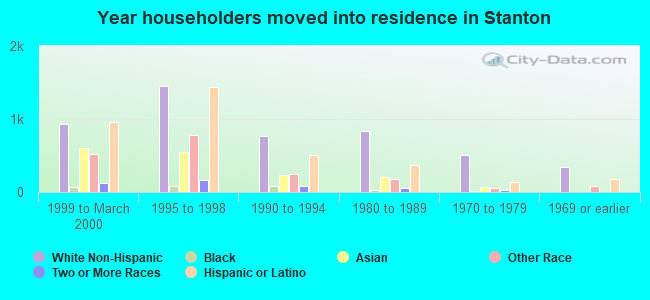
House/condo owner moved in on average 11 years ago
Renter moved in on average 6 years ago
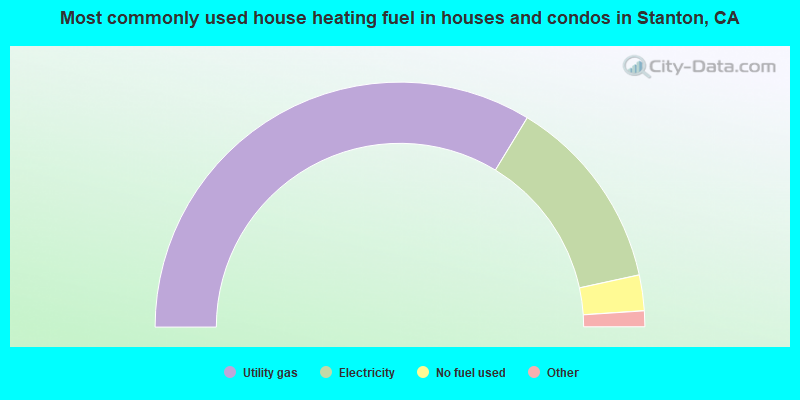
- 67.4%Utility gas
- 25.8%Electricity
- 4.7%No fuel used
- 1.9%Bottled, tank, or LP gas
- 0.2%Solar energy
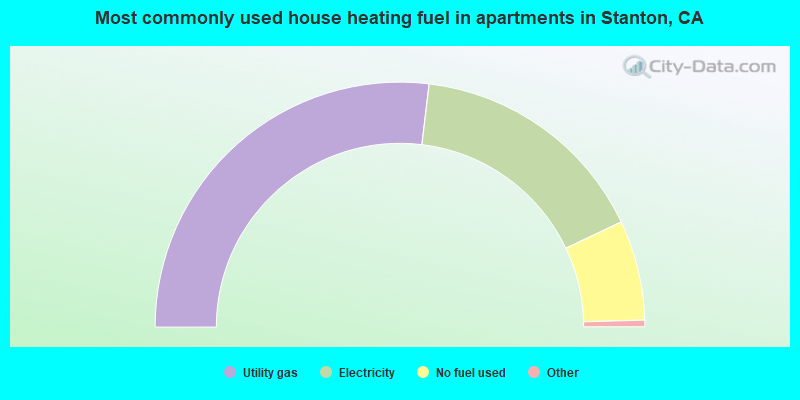
- 53.8%Utility gas
- 32.1%Electricity
- 13.2%No fuel used
- 0.7%Bottled, tank, or LP gas
- 0.1%Solar energy
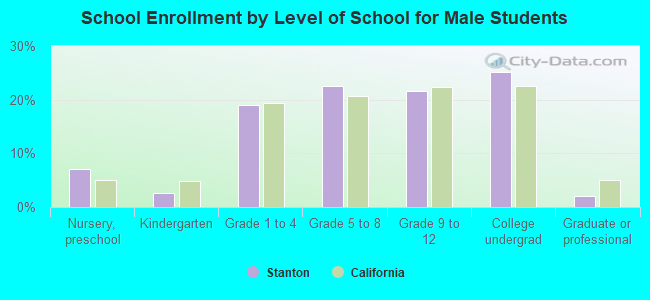
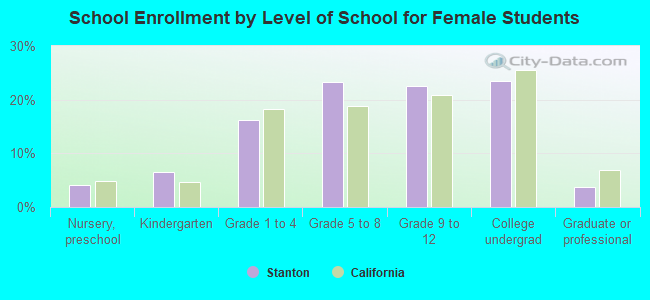
Private vs. public school enrollment:
| Here: | 3.4% |
| California: | 10.5% |
| Here: | 5.2% |
| California: | 8.5% |
| Here: | 8.8% |
| California: | 15.9% |