St. Paul, MN (Minnesota) Houses and Residents
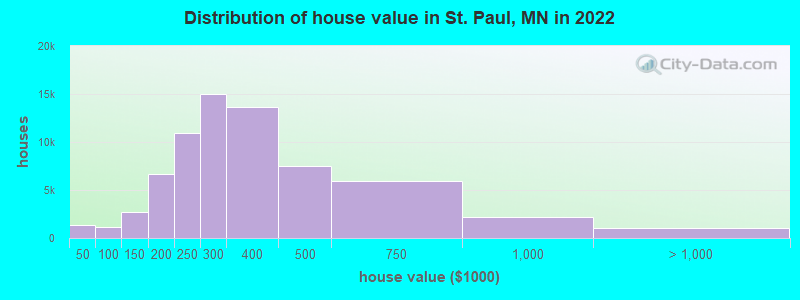
Estimated median house or condo value in 2022: $287,600 (it was $105,000 in 2000 )
St. Paul:
$287,600Minnesota:
$314,600
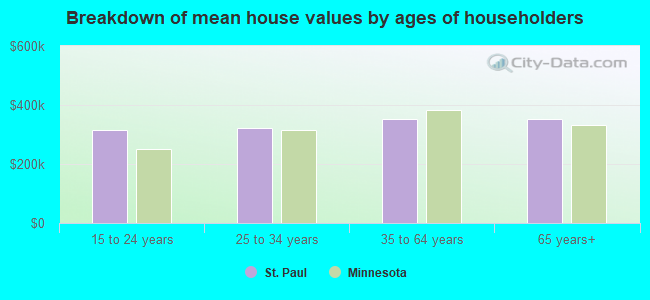
Lower value quartile - upper value quartile: $223,800 - $397,500Mean price in 2022: Detached houses: $354,567 Here:
$354,567State:
$374,552
Townhouses or other attached units: $334,987 Here:
$334,987State:
$312,049
In 2-unit structures: $251,389 Here:
$251,389State:
$323,045
In 3-to-4-unit structures: $343,417 Here:
$343,417State:
$238,971
In 5-or-more-unit structures: $235,089 Here:
$235,089State:
$258,516
Mobile homes: $237,492 Here:
$237,492State:
$94,605
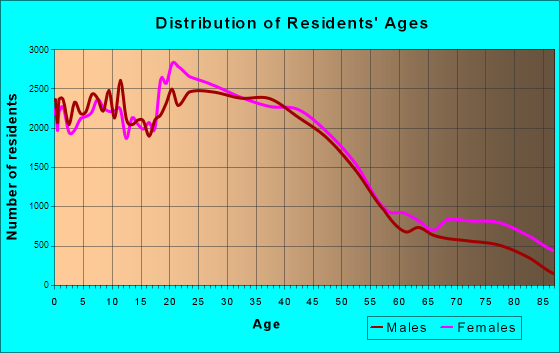
Total population: 297,640 (Urban population: 287,151, Rural population: 0)
Houses: 134,988 (126,654 occupied: 68,098 owner occupied, 58,556 renter occupied )
% of renters here:
46%State:
28%
Housing density: 2,558 houses/condos per square mile
Median price asked for vacant for-sale houses and condos in 2022: $263,295.
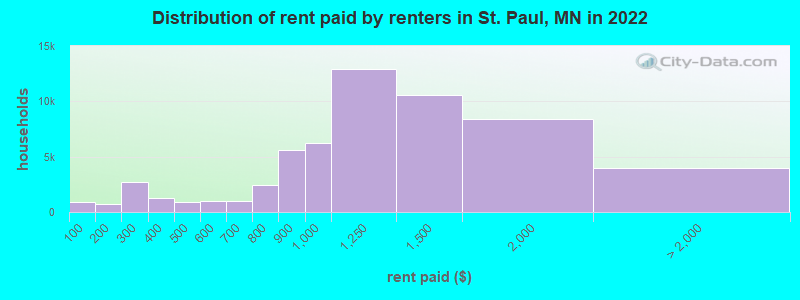
Median contract rent in 2022: $1,120 (lower quartile is $865, upper quartile is $1,432)
Median rent asked for vacant for-rent units in 2022: $1,578
Median gross rent in St. Paul, MN in 2022: $1,216
Housing units in St. Paul with a mortgage: 46,254 (5,643 second mortgage, 62 home equity loan, 4,048 both second mortgage and home equity loan )Houses without a mortgage: 691
Median household income for houses/condos with a mortgage: $103,513
Median household income for apartments without a mortgage: $73,955
Median monthly housing costs: $1,329
Data:
Median house or condo value ($)
Median house or condo value ($ change since 2000)
Median house or condo value ($) - White
Median house or condo value ($) - Black or African American
Median house or condo value ($) - Asian
Median house or condo value ($) - Hispanic or Latino
Median house or condo value ($) - American Indian and Alaska Native
Median house or condo value ($) - Multirace
Median house or condo value ($) - Other Race
Median price asked for mobile homes ($)
Household density (households per square mile)
Mean house or condo value by units in structure - 1, detached ($)
Mean house or condo value by units in structure - 1, attached ($)
Mean house or condo value by units in structure - 2 ($)
Mean house or condo value by units in structure by units in structure - 3 or 4 ($)
Mean house or condo value by units in structure - 5 or more ($)
Mean house or condo value by units in structure - Boat, RV, van, etc. ($)
Mean house or condo value by units in structure - Mobile home ($)
Median contract rent ($)
Median contract rent - Lower quartile ($)
Median contract rent - Upper quartile ($)
Median gross rent ($)
Urban houses (%)
Rural houses (%)
Houses occupied (%)
Houses occupied (% change since 2000)
Houses owner occupied (%)
Houses owner occupied (% change since 2000)
Houses renter occupied (%)
Houses renter occupied (% change since 2000)
Vacant housing units - For rent (%)
Vacant housing units - For rent (% change since 2000)
Vacant housing units - For sale only (%)
Vacant housing units - For sale only (% change since 2000)
Vacant housing units - Rented or sold, not occupied (%)
Vacant housing units - Rented or sold, not occupied (% change since 2000)
Vacant housing units - For seasonal, recreational, or occasional use (%)
Vacant housing units - For seasonal, recreational, or occasional use (% change since 2000)
Vacant housing units - For migrant workers (%)
Vacant housing units - For migrant workers (% change since 2000)
Vacant housing units - Other vacant (%)
Vacant housing units - Other vacant (% change since 2000)
Median monthly housing costs ($)
Median household income for houses/condos with a mortgage ($)
Median household income for houses/condos without a mortgage ($)
Median household income ($)
Median household income ($) - White
Median household income ($) - Black or African American
Median household income ($) - Asian
Median household income ($) - Hispanic or Latino
Median household income ($) - American Indian and Alaska Native
Median household income ($) - Multirace
Median household income ($) - Other Race
Mortgage status - with mortgage (%)
Mortgage status - with second mortgage (%)
Mortgage status - with home equity loan (%)
Mortgage status - with both second mortgage and home equity loan (%)
Mortgage status - without a mortgage (%)
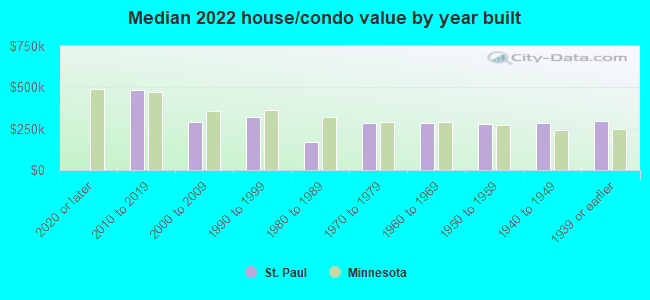
Median year house/condo built
Median year apartment built
Household type by relationship - Male householder living alone (%)
Household type by relationship - Male householder not living alone (%)
Household type by relationship - Female householder living alone (%)
Household type by relationship - Female householder not living alone (%)
Household type by relationship - Opposite-Sex spouse (%)
Household type by relationship - Same-Sex spouse (%)
Household type by relationship - Opposite-Sex unmarried partner (%)
Household type by relationship - Same-Sex unmarried partner (%)
Household type by relationship - In group quarters (%)
Size of family households - 2-person household (%)
Size of family households - 3-person household (%)
Size of family households - 4-person household (%)
Size of family households - 5-person household (%)
Size of family households - 6-person household (%)
Size of family households - 7-or-more-person household (%)
Size of nonfamily households - 1-person household (%)
Size of nonfamily households - 2-person household (%)
Size of nonfamily households - 3-person household (%)
Size of nonfamily households - 4-person household (%)
Size of nonfamily households - 5-person household (%)
Size of nonfamily households - 6-person household (%)
Size of nonfamily households - 7-or-moreperson household (%)
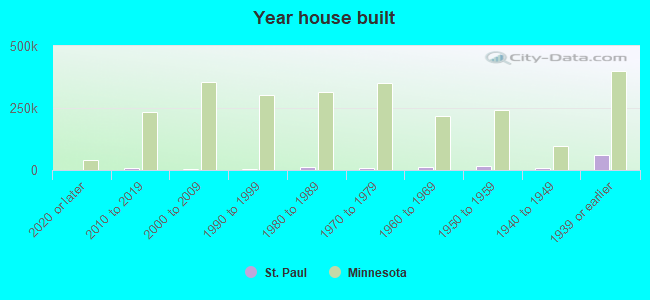
Year house built - Built 2010 or later (%)
Year house built - Built 2000 to 2009 (%)
Year house built - Built 1990 to 1999 (%)
Year house built - Built 1980 to 1989 (%)
Year house built - Built 1970 to 1979 (%)
Year house built - Built 1960 to 1969 (%)
Year house built - Built 1950 to 1959 (%)
Year house built - Built 1940 to 1949 (%)
Year house built - Built 1939 or earlier (%)
Median number of rooms in houses and condos
Median number of rooms in apartments
Median number of bedrooms in owner occupied houses
Mean number of bedrooms in owner occupied houses
Median number of bedrooms in renter occupied houses
Mean number of bedrooms in renter occupied houses
Median number of vehichles in owner occupied houses
Mean number of vehichles in owner occupied houses
Median number of vehichles in renter occupied houses
Mean number of vehichles in renter occupied houses
Rooms in owner-occupied houses - 1 room (%)
Rooms in owner-occupied houses - 2 rooms (%)
Rooms in owner-occupied houses - 3 rooms (%)
Rooms in owner-occupied houses - 4 rooms (%)
Rooms in owner-occupied houses - 5 rooms (%)
Rooms in owner-occupied houses - 6 rooms (%)
Rooms in owner-occupied houses - 7 rooms (%)
Rooms in owner-occupied houses - 8 rooms (%)
Rooms in owner-occupied houses - 9+ rooms (%)
Rooms in renter-occupied houses - 1 room (%)
Rooms in renter-occupied houses - 2 rooms (%)
Rooms in renter-occupied houses - 3 rooms (%)
Rooms in renter-occupied houses - 4 rooms (%)
Rooms in renter-occupied houses - 5 rooms (%)
Rooms in renter-occupied houses - 6 rooms (%)
Rooms in renter-occupied houses - 7 rooms (%)
Rooms in renter-occupied houses - 8 rooms (%)
Rooms in renter-occupied houses - 9+ rooms (%)
Bedrooms in owner-occupied houses - no bedrooms (%)
Bedrooms in owner-occupied houses - 1 bedroom (%)
Bedrooms in owner-occupied houses - 2 bedrooms (%)
Bedrooms in owner-occupied houses - 3 bedrooms (%)
Bedrooms in owner-occupied houses - 4 bedrooms (%)
Bedrooms in owner-occupied houses - 5+ bedrooms (%)
Bedrooms in renter-occupied houses - no bedrooms (%)
Bedrooms in renter-occupied houses - 1 bedroom (%)
Bedrooms in renter-occupied houses - 2 bedrooms (%)
Bedrooms in renter-occupied houses - 3 bedrooms (%)
Bedrooms in renter-occupied houses - 4 bedrooms (%)
Bedrooms in renter-occupied houses - 5+ bedrooms (%)
Vehicles available in owner-occupied houses - no vehicle available (%)
Vehicles available in owner-occupied houses - 1 vehicle available(%)
Vehicles available in owner-occupied houses - 2 Vehicles available (%)
Vehicles available in owner-occupied houses - 3 Vehicles available (%)
Vehicles available in owner-occupied houses - 4 Vehicles available (%)
Vehicles available in owner-occupied houses - 5+ Vehicles available (%)
Vehicles available in renter-occupied houses - no vehicle available (%)
Vehicles available in renter-occupied houses - 1 vehicle available (%)
Vehicles available in renter-occupied houses - 2 Vehicles available (%)
Vehicles available in renter-occupied houses - 3 Vehicles available (%)
Vehicles available in renter-occupied houses - 4 Vehicles available (%)
Vehicles available in renter-occupied houses - 5+ Vehicles available (%)
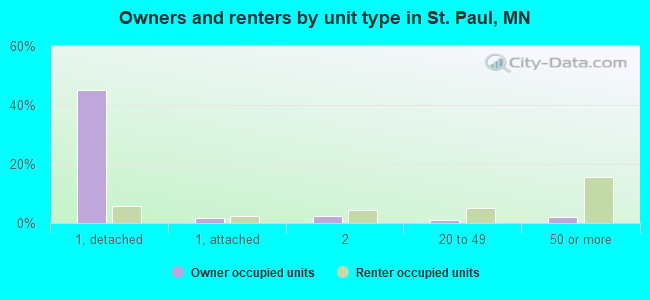
Housing units in structures - 1, detached (%)
Housing units in structures - 1, attached (%)
Housing units in structures - 2 (%)
Housing units in structures - 3 or 4 (%)
Housing units in structures - 5 to 9 (%)
Housing units in structures - 10 to 19 (%)
Housing units in structures - 20 to 49 (%)
Housing units in structures - 50 or more (%)
Housing units in structures - Mobile home (%)
Housing units in structures - Boat, RV, van, etc. (%)
Housing units in structures - Owners - 1, detached (%)
Housing units in structures - Owners - 1, attached (%)
Housing units in structures - Owners - 2 (%)
Housing units in structures - Owners - 3 or 4 (%)
Housing units in structures - Owners - 5 to 9 (%)
Housing units in structures - Owners - 10 to 19 (%)
Housing units in structures - Owners - 20 to 49 (%)
Housing units in structures - Owners - 50 or more (%)
Housing units in structures - Owners - Mobile home (%)
Housing units in structures - Owners - Boat, RV, van, etc. (%)
Housing units in structures - Renters - 1, detached (%)
Housing units in structures - Renters - 1, attached (%)
Housing units in structures - Renters - 2 (%)
Housing units in structures - Renters - 3 or 4 (%)
Housing units in structures - Renters - 5 to 9 (%)
Housing units in structures - Renters - 10 to 19 (%)
Housing units in structures - Renters - 20 to 49 (%)
Housing units in structures - Renters - 50 or more (%)
Housing units in structures - Renters - Mobile home (%)
Housing units in structures - Renters - Boat, RV, van, etc. (%)
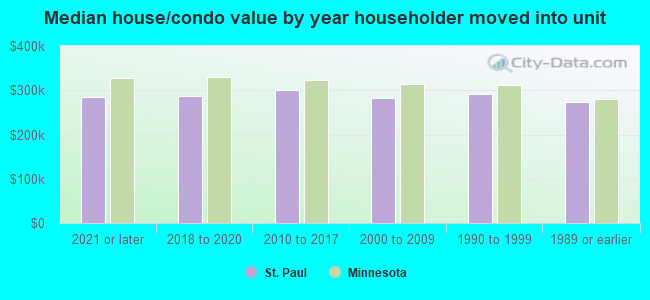
House/condo owner moved in on average (years ago)
Renter moved in on average (years ago)
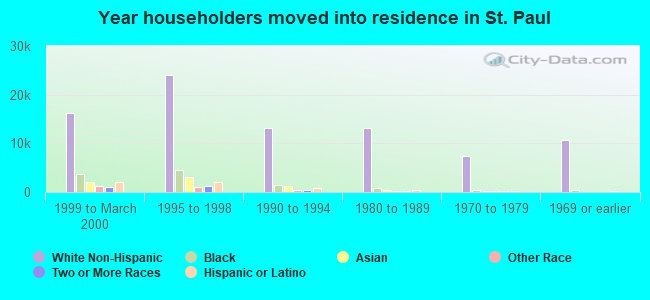
Year householder moved into unit - Moved in 1999 to March 2000 (%)
Year householder moved into unit - Moved in 1999 to March 2000 (%) - White
Year householder moved into unit - Moved in 1999 to March 2000 (%) - Black or African American
Year householder moved into unit - Moved in 1999 to March 2000 (%) - Asian
Year householder moved into unit - Moved in 1999 to March 2000 (%) - Hispanic or Latino
Year householder moved into unit - Moved in 1999 to March 2000 (%) - American Indian and Alaska Native
Year householder moved into unit - Moved in 1999 to March 2000 (%) - Multirace
Year householder moved into unit - Moved in 1999 to March 2000 (%) - Other Race
Year householder moved into unit - Moved in 1995 to 1998 (%)
Year householder moved into unit - Moved in 1995 to 1998 (%) - White
Year householder moved into unit - Moved in 1995 to 1998 (%) - Black or African American
Year householder moved into unit - Moved in 1995 to 1998 (%) - Asian
Year householder moved into unit - Moved in 1995 to 1998 (%) - Hispanic or Latino
Year householder moved into unit - Moved in 1995 to 1998 (%) - American Indian and Alaska Native
Year householder moved into unit - Moved in 1995 to 1998 (%) - Multirace
Year householder moved into unit - Moved in 1995 to 1998 (%) - Other Race
Year householder moved into unit - Moved in 1990 to 1994 (%)
Year householder moved into unit - Moved in 1990 to 1994 (%) - White
Year householder moved into unit - Moved in 1990 to 1994 (%) - Black or African American
Year householder moved into unit - Moved in 1990 to 1994 (%) - Asian
Year householder moved into unit - Moved in 1990 to 1994 (%) - Hispanic or Latino
Year householder moved into unit - Moved in 1990 to 1994 (%) - American Indian and Alaska Native
Year householder moved into unit - Moved in 1990 to 1994 (%) - Multirace
Year householder moved into unit - Moved in 1990 to 1994 (%) - Other Race
Year householder moved into unit - Moved in 1980 to 1989 (%)
Year householder moved into unit - Moved in 1980 to 1989 (%) - White
Year householder moved into unit - Moved in 1980 to 1989 (%) - Black or African American
Year householder moved into unit - Moved in 1980 to 1989 (%) - Asian
Year householder moved into unit - Moved in 1980 to 1989 (%) - Hispanic or Latino
Year householder moved into unit - Moved in 1980 to 1989 (%) - American Indian and Alaska Native
Year householder moved into unit - Moved in 1980 to 1989 (%) - Multirace
Year householder moved into unit - Moved in 1980 to 1989 (%) - Other Race
Year householder moved into unit - Moved in 1970 to 1979 (%)
Year householder moved into unit - Moved in 1970 to 1979 (%) - White
Year householder moved into unit - Moved in 1970 to 1979 (%) - Black or African American
Year householder moved into unit - Moved in 1970 to 1979 (%) - Asian
Year householder moved into unit - Moved in 1970 to 1979 (%) - Hispanic or Latino
Year householder moved into unit - Moved in 1970 to 1979 (%) - American Indian and Alaska Native
Year householder moved into unit - Moved in 1970 to 1979 (%) - Multirace
Year householder moved into unit - Moved in 1970 to 1979 (%) - Other Race
Year householder moved into unit - Moved in 1969 or earlier (%)
Year householder moved into unit - Moved in 1969 or earlier (%) - White
Year householder moved into unit - Moved in 1969 or earlier (%) - Black or African American
Year householder moved into unit - Moved in 1969 or earlier (%) - Asian
Year householder moved into unit - Moved in 1969 or earlier (%) - Hispanic or Latino
Year householder moved into unit - Moved in 1969 or earlier (%) - American Indian and Alaska Native
Year householder moved into unit - Moved in 1969 or earlier (%) - Multirace
Year householder moved into unit - Moved in 1969 or earlier (%) - Other Race
Housing units lacking complete plumbing facilities (%)
Housing units lacking complete kitchen facilities (%)
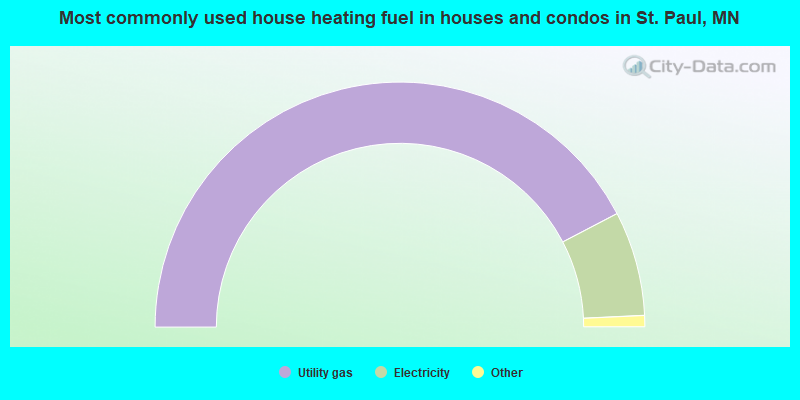
House heating fuel used in houses and condos - Utility gas (%)
House heating fuel used in houses and condos - Bottled, tank, or LP gas (%)
House heating fuel used in houses and condos - Electricity (%)
House heating fuel used in houses and condos - Fuel oil, kerosene, etc. (%)
House heating fuel used in houses and condos - Coal or coke (%)
House heating fuel used in houses and condos - Wood (%)
House heating fuel used in houses and condos - Solar energy (%)
House heating fuel used in houses and condos - Other fuel (%)
House heating fuel used in houses and condos - No fuel used (%)
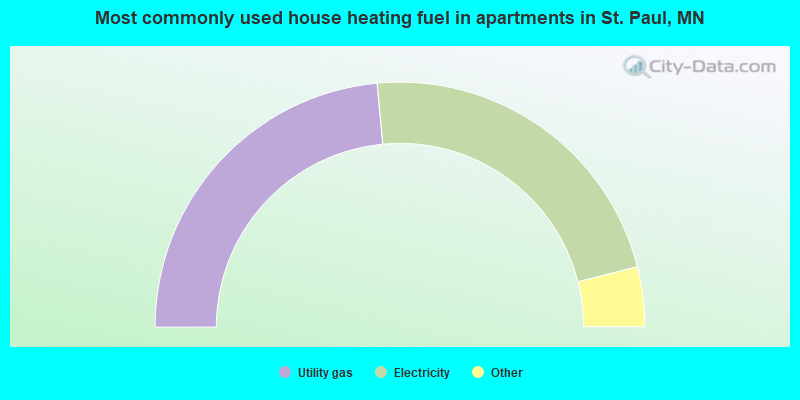
House heating fuel used in apartments - Utility gas (%)
House heating fuel used in apartments - Bottled, tank, or LP gas (%)
House heating fuel used in apartments - Electricity (%)
House heating fuel used in apartments - Fuel oil, kerosene, etc. (%)
House heating fuel used in apartments - Coal or coke (%)
House heating fuel used in apartments - Wood (%)
House heating fuel used in apartments - Solar energy (%)
House heating fuel used in apartments - Other fuel (%)
House heating fuel used in apartments - No fuel used (%)
Median year house/condo built: 1938Median year apartment built: 1962Household type by relationship:
Households: 303,160
Male householders: 56,977 (21,309 living alone ), Female householders: 69,677 (24,544 living alone )43,105 spouses (41,389 opposite-sex spouses ), 13,922 unmarried partners , (12,596 opposite-sex unmarried partners ), 77,028 children (73,185 natural , 740 adopted , 3,103 stepchildren ), 3,535 grandchildren , 4,430 brothers or sisters , 3,433 parents , 154 foster children , 5,932 other relatives , 13,928 non-relatives In group quarters: 11,039
Size of family households: 28,884 2-persons , 13,081 3-persons , 10,374 4-persons , 6,500 5-persons , 3,668 6-persons , 2,980 7-or-more-persons .
Size of nonfamily households: 45,853 1-person , 12,903 2-persons , 1,317 3-persons , 481 4-persons , 422 5-persons , 126 6-persons , 65 7-or-more-persons .
33,570 married couples with children. single-parent households (5,029 men , 20,501 women ).
73.5% of residents of St. Paul speak English at home. of residents speak Spanish at home (60% speak English very well , 17% speak English well , 18% speak English not well , 4% don't speak English at all ).of residents speak other Indo-European language at home (67% speak English very well , 16% speak English well , 15% speak English not well , 2% don't speak English at all ).of residents speak Asian or Pacific Island language at home (41% speak English very well , 29% speak English well , 19% speak English not well , 10% don't speak English at all ).of residents speak other language at home (62% speak English very well , 25% speak English well , 12% speak English not well , 2% don't speak English at all ).
Foreign born population: 54,750 (18.1%)of them are naturalized citizens )
Median number of rooms in houses and condos:
Median number of rooms in apartments
Owner-occupied Renter-occupied
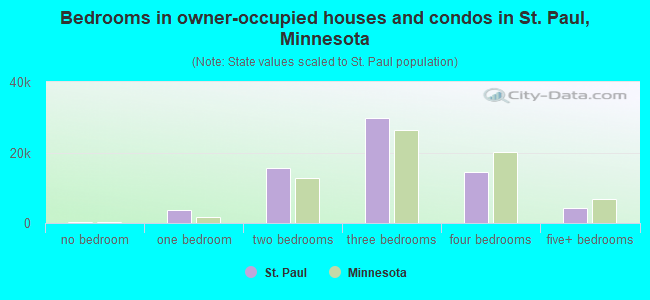
Bedrooms in owner-occupied houses and condos in St. Paul, Minnesota
296 no bedroom 3,687 1 bedroom 15,615 2 bedrooms 29,684 3 bedrooms 14,457 4 bedrooms 4,359 5+ bedrooms
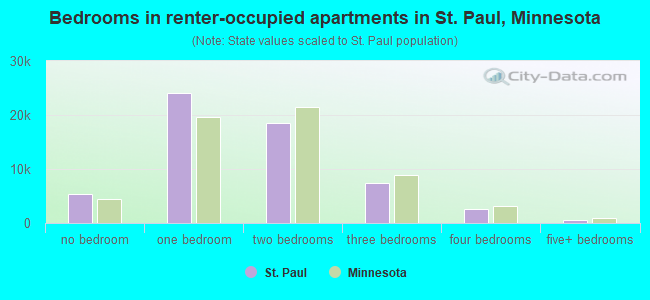
Bedrooms in renter-occupied apartments in St. Paul, Minnesota
5,383 no bedroom 24,033 1 bedroom 18,463 2 bedrooms 7,465 3 bedrooms 2,599 4 bedrooms 613 5+ bedrooms
Owner-occupied Renter-occupied
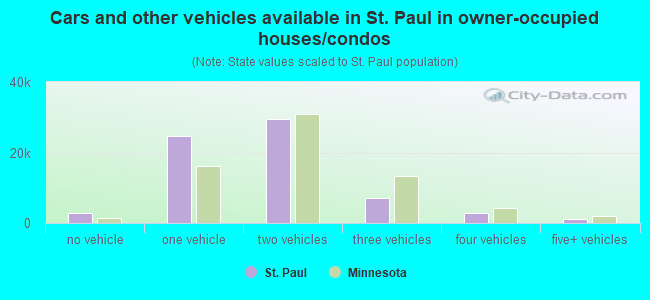
Cars and other vehicles available in St. Paul in owner-occupied houses/condos
2,898 no vehicle 24,606 1 vehicle 29,610 2 vehicles 7,006 3 vehicles 2,931 4 vehicles 1,047 5+ vehicles
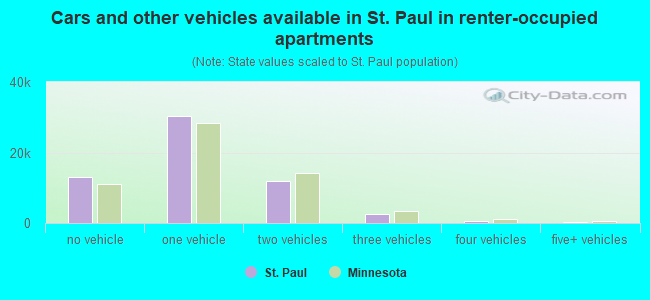
Cars and other vehicles available in St. Paul in renter-occupied apartments
13,101 no vehicle 30,267 1 vehicle 11,814 2 vehicles 2,592 3 vehicles 511 4 vehicles 271 5+ vehicles
Owner-occupied Renter-occupied
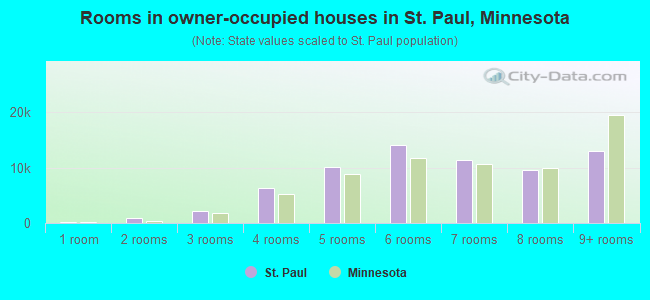
Rooms in owner-occupied houses in St. Paul, Minnesota
236 1 room 958 2 rooms 2,252 3 rooms 6,311 4 rooms 10,142 5 rooms 14,185 6 rooms 11,398 7 rooms 9,515 8 rooms 13,101 9+ rooms
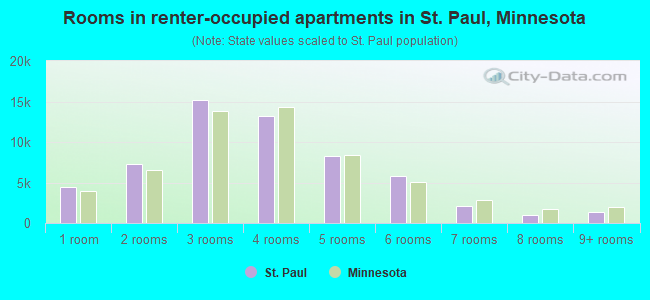
Rooms in renter-occupied apartments in St. Paul, Minnesota
4,394 1 room 7,231 2 rooms 15,204 3 rooms 13,199 4 rooms 8,281 5 rooms 5,800 6 rooms 2,085 7 rooms 982 8 rooms 1,380 9+ rooms
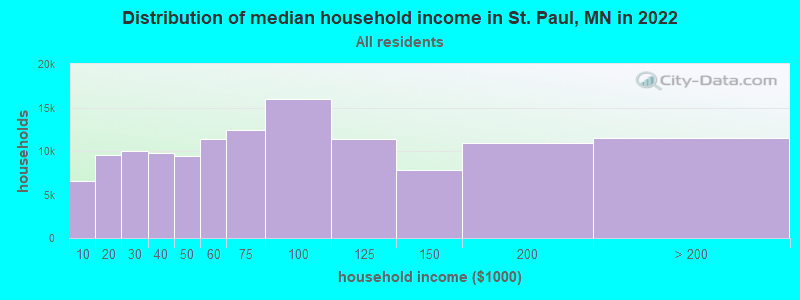
St. Paul, MN household income distribution 6,526 Less than $10,0009,558 $10,000 to $19,9999,967 $20,000 to $29,9999,751 $30,000 to $39,9999,405 $40,000 to $49,99911,325 $50,000 to $59,99912,395 $60,000 to $74,99916,031 $75,000 to $99,99911,415 $100,000 to $124,9997,858 $125,000 to $149,99910,877 $150,000 to $199,99911,546 $200,000 or more
Home value of owner - occupied houses in 2022 in St. Paul, MN 565 Less than $10,00043 $10,000 to $14,99971 $15,000 to $19,999336 $20,000 to $24,99987 $25,000 to $29,999181 $30,000 to $34,99992 $40,000 to $49,99998 $50,000 to $59,999376 $60,000 to $69,999193 $70,000 to $79,999213 $80,000 to $89,999160 $90,000 to $99,999472 $100,000 to $124,9992,252 $125,000 to $149,9993,386 $150,000 to $174,9993,310 $175,000 to $199,99910,904 $200,000 to $249,99915,046 $250,000 to $299,99913,629 $300,000 to $399,9997,469 $400,000 to $499,9995,936 $500,000 to $749,9992,191 $750,000 to $999,999276 $1,000,000 to $1,499,999209 $1,500,000 to $1,999,999603 $2,000,000 or moreRent paid by renters in 2022 in St. Paul, MN 874 Less than $100691 $150 to $1991,572 $200 to $2491,120 $250 to $299461 $300 to $349764 $350 to $399772 $400 to $449114 $450 to $499540 $500 to $549423 $550 to $599588 $600 to $649443 $650 to $699523 $700 to $7491,911 $750 to $7995,632 $800 to $8996,213 $900 to $99912,917 $1,000 to $1,24910,593 $1,250 to $1,4998,415 $1,500 to $1,9991,882 $2,000 to $2,499409 $2,500 to $2,999371 $3,000 to $3,499489 $3,500 or more839 No cash rent
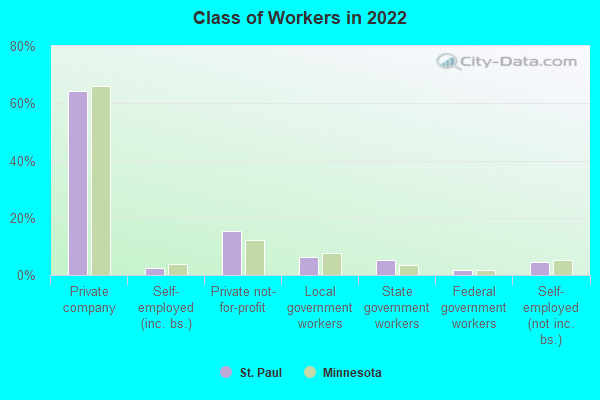
Percentage of workers working in this county: 62.3%Number of people working at home: 29,896 (18.8% of all workers )
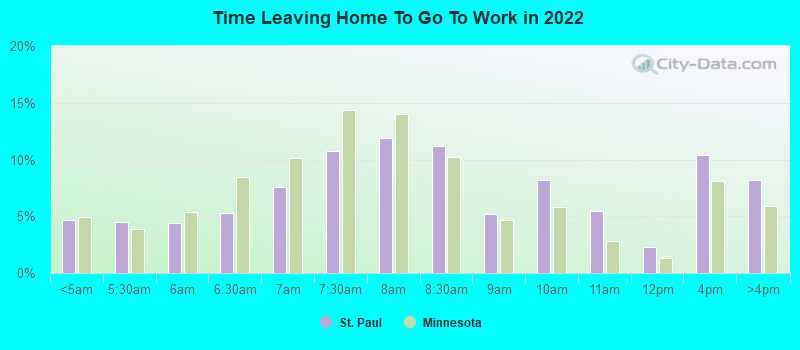
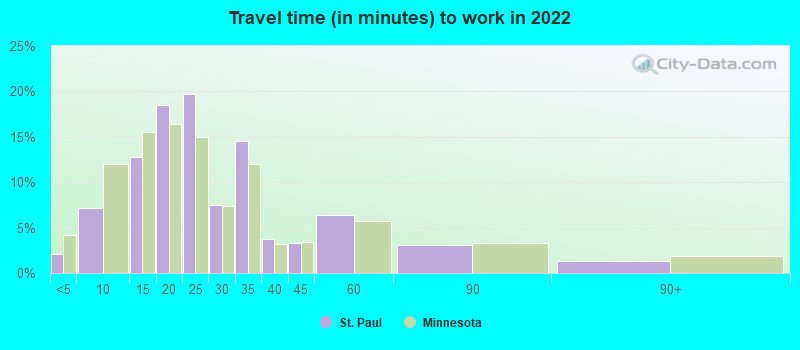
Travel time to work (commute)
Less than 5 minutes: 3,2355 to 9 minutes: 9,24410 to 14 minutes: 23,35315 to 19 minutes: 29,32520 to 24 minutes: 25,76425 to 29 minutes: 10,49930 to 34 minutes: 14,49535 to 39 minutes: 3,03840 to 44 minutes: 2,88145 to 59 minutes: 3,83960 to 89 minutes: 2,33890 or more minutes: 823
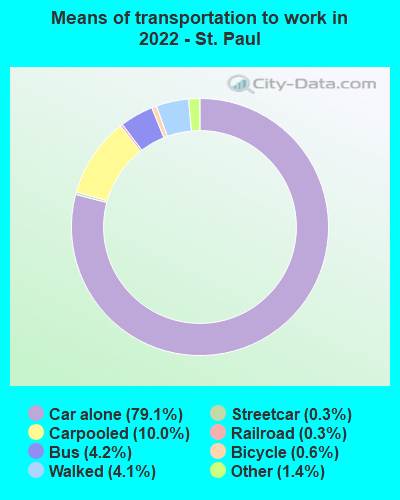
Means of transportation to work:
Drove a car alone: 113,455 (65.4%)Carpooled: 14,415 (8.3%)Bus : 5,962 (3.4%)Subway or elevated rail : 384 (0.2%)Light rail, streetcar or trolley : 404 (0.2%)Taxi: 2,065 (1.2%)Bicycle: 870 (0.5%)Walked: 5,905 (3.4%)Worked at home: 29,896 (17.2%)
Unemployment by race in 2022
Unemployment rate for White non-Hispanic residents 5.0% Males3.7% FemalesUnemployment rate for Black residents 5.1% Males1.1% FemalesUnemployment rate for American Indian and Alaska Native residents 11.4% Males12.6% FemalesUnemployment rate for Asian residents 8.1% Males1.2% FemalesUnemployment rate for other race residents 2.9% Males2.4% FemalesUnemployment rate for two or more race residents 7.6% Males4.2% FemalesUnemployment rate for Hispanic or Latino residents 4.9% Males4.2% Females
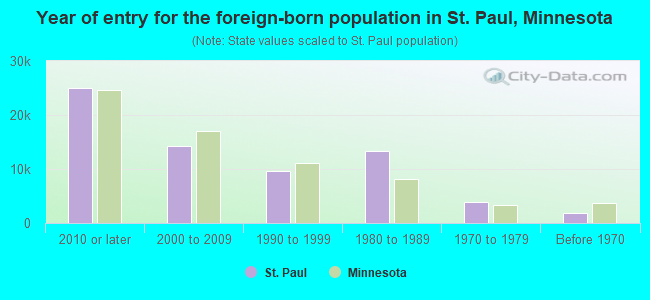
Year of entry for the foreign-born population in St. Paul, Minnesota
24,978 2010 or later 14,188 2000 to 2009 9,637 1990 to 1999 13,268 1980 to 1989 3,899 1970 to 1979 1,901 Before 1970
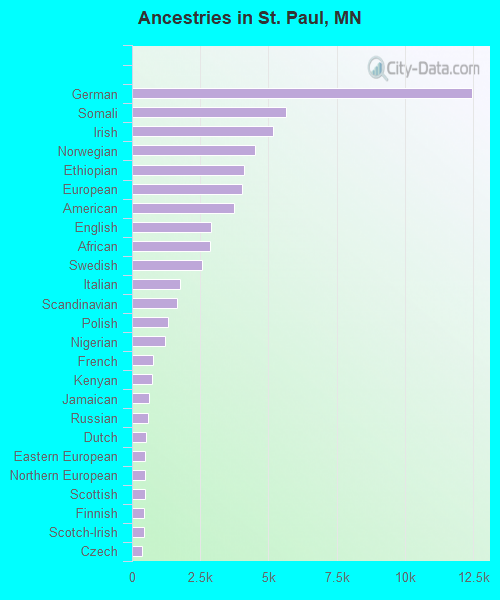
First ancestries reported:
German: 12,458 (8.5%)
Somali: 5,655 (3.9%)
Irish: 5,156 (3.5%)
Norwegian: 4,506 (3.1%)
Ethiopian: 4,116 (2.8%)
European: 4,019 (2.7%)
American: 3,720 (2.5%)
English: 2,888 (2.0%)
African: 2,845 (1.9%)
Swedish: 2,548 (1.7%)
Italian: 1,751 (1.2%)
Scandinavian: 1,643 (1.1%)
Polish: 1,331 (0.9%)
Nigerian: 1,197 (0.8%)
French: 781 (0.5%)
Kenyan: 732 (0.5%)
Jamaican: 614 (0.4%)
Russian: 568 (0.4%)
Dutch: 499 (0.3%)
Eastern European: 480 (0.3%)
Northern European: 469 (0.3%)
Scottish: 467 (0.3%)
Finnish: 457 (0.3%)
Scotch-Irish: 423 (0.3%)
Czech: 366 (0.2%)
Danish: 355 (0.2%)
British: 353 (0.2%)
Liberian: 309 (0.2%)
Hungarian: 251 (0.2%)
French Canadian: 249 (0.2%)
Ukrainian: 239 (0.2%)
Austrian: 217 (0.1%)
Iranian: 185 (0.1%)
Slovak: 147 (0.1%)
Lebanese: 144 (0.10%)
Afghan: 131 (0.09%)
Egyptian: 117 (0.08%)
Swiss: 114 (0.08%)
Greek: 109 (0.07%)
Luxembourger: 100 (0.07%)
Romanian: 93 (0.06%)
Canadian: 89 (0.06%)
Lithuanian: 69 (0.05%)
Turkish: 68 (0.05%)
Slovene: 53 (0.04%)
Czechoslovakian: 53 (0.04%)
Haitian: 50 (0.03%)
Welsh: 48 (0.03%)
West Indian: 48 (0.03%)
Croatian: 45 (0.03%)
Brazilian: 45 (0.03%)
Guyanese: 43 (0.03%)
Moroccan: 41 (0.03%)
Armenian: 39 (0.03%)
Albanian: 39 (0.03%)
Bulgarian: 38 (0.03%)
Latvian: 38 (0.03%)
Israeli: 38 (0.03%)
Ghanaian: 34 (0.02%)
Trinidadian and Tobagonian: 31 (0.02%)
Palestinian: 30 (0.02%)
Zimbabwean: 30 (0.02%)
Sudanese: 29 (0.02%)
Belgian: 27 (0.02%)
Arab: 22 (0.02%)
Basque: 21 (0.01%)
German Russian: 19 (0.01%)
Yugoslavian: 19 (0.01%)
Estonian: 18 (0.01%)
Maltese: 16 (0.01%)
Serbian: 15 (0.01%)
Barbadian: 15 (0.01%)
Iraqi: 12 (0.01%)
Pennsylvania German: 12 (0.01%)
Syrian: 10 (0.01%)
Macedonian: 10 (0.01%)
Jordanian: 9 (0.01%)
Slavic: 8 (0.01%)
Most common places of birth for foreign-born residents (%): Thailand St. Paul:
13.6% (8,213)Minnesota:
4.0% (19,333)
Laos St. Paul:
13.1% (7,912)Minnesota:
5.1% (24,591)
Burma (Myanmar) St. Paul:
13.1% (7,898)Minnesota:
1.8% (8,637)
Mexico St. Paul:
9.1% (5,490)Minnesota:
12.1% (58,312)
Ethiopia St. Paul:
7.7% (4,609)Minnesota:
5.1% (24,630)
Somalia St. Paul:
7.1% (4,298)Minnesota:
8.0% (38,461)
El Salvador St. Paul:
3.2% (1,947)Minnesota:
1.4% (6,841)
Vietnam St. Paul:
3.2% (1,931)Minnesota:
3.8% (18,442)
Kenya St. Paul:
2.7% (1,606)Minnesota:
3.3% (15,701)
China, excluding Hong Kong and Taiwan St. Paul:
1.9% (1,156)Minnesota:
3.6% (17,119)
Nigeria St. Paul:
1.7% (1,015)Minnesota:
1.7% (8,263)
Eritrea St. Paul:
1.6% (969)Minnesota:
0.6% (2,993)
Korea St. Paul:
1.6% (953)Minnesota:
2.4% (11,675)
Canada St. Paul:
1.5% (903)Minnesota:
2.5% (11,939)
Place of birth for U.S.-born residents:
This state: 166,943Other state: 77,758Northeast: 8,212Midwest: 42,035South: 13,923West: 13,588 82.1% of St. Paul residents lived in the same house 1 years ago.
Out of people who lived in different houses, 32.1% lived in this county.
Out of people who lived in different counties, 63.5% lived in Minnesota.
St. Paul:
82.1%State average:
87.4%
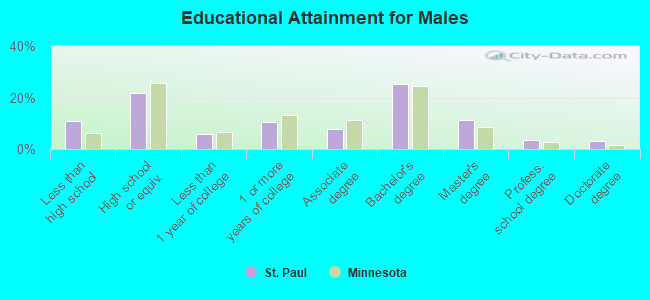
Education attainment for males 25 years and older:
No schooling: 5,005Nursery to 4th grade: 4915th and 6th grade: 2907th and 8th grade: 2309th grade: 28810th grade: 1,07711th grade: 1,56312th grade, no diploma: 1,791High school graduate (or equivalency): 21,730Less than 1 year of college: 5,901Some college more than 1 year, no degree: 10,378Associate degree: 7,874Bachelor's degree: 25,190Master's degree: 11,084Professional school degree: 3,418Doctorate degree: 2,950
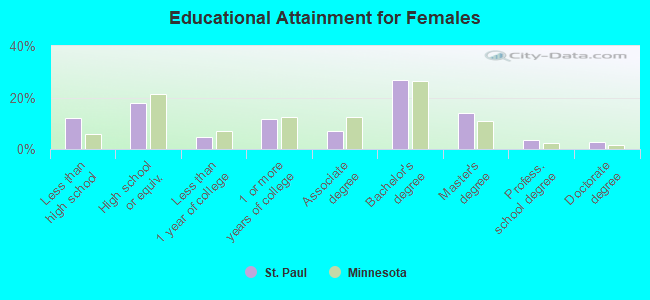
Education attainment for females 25 years and older:
No schooling: 5,904Nursery to 4th grade: 3475th and 6th grade: 1,3247th and 8th grade: 5729th grade: 94710th grade: 79511th grade: 43912th grade, no diploma: 1,891High school graduate (or equivalency): 18,016Less than 1 year of college: 4,756Some college more than 1 year, no degree: 11,732Associate degree: 7,291Bachelor's degree: 27,424Master's degree: 14,208Professional school degree: 3,632Doctorate degree: 2,686
Housing units in structures:
One, detached: 66,427One, attached: 5,216Two: 8,5653 or 4: 4,9225 to 9: 5,83710 to 19: 9,37020 to 49: 9,39450 or more: 25,046Mobile homes: 211Housing units lacking complete plumbing facilities in 2022: 0.7%Housing units lacking complete kitchen facilities in 2022: 1.6%House/condo owner moved in on average 11 years ago
Renter moved in on average 2 years ago
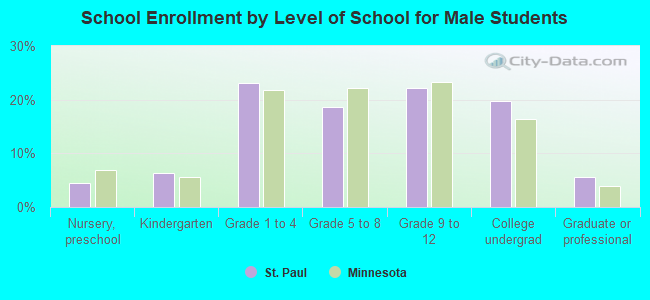
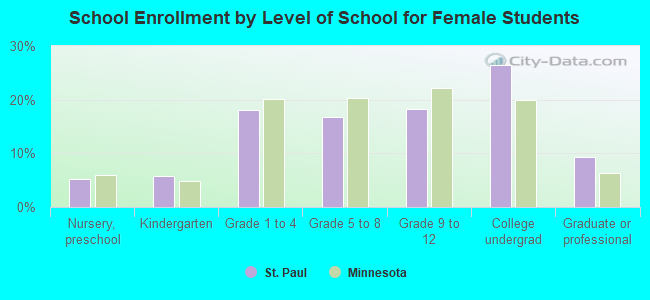
Private vs. public school enrollment:
Students in private schools in grades 1 to 8 (elementary and middle school): 3,601 Here:
12.1%Minnesota:
12.9%
Students in private schools in grades 9 to 12 (high school): 1,809 Students in private undergraduate colleges: 9,857 Here:
55.2%Minnesota:
26.2%