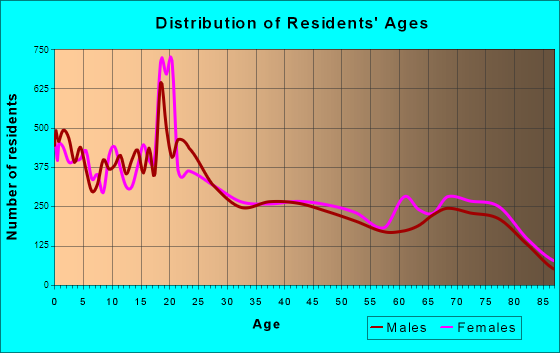
St. George, UT (Utah) Houses and Residents
| St. George: | $512,700 |
| Utah: | $499,500 |
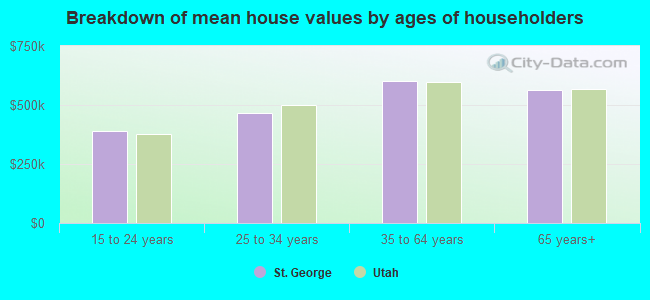
Mean price in 2022:
Detached houses: $497,608
Here: $497,608 State: $607,750 Townhouses or other attached units: $305,581
Here: $305,581 State: $444,505 In 2-unit structures: $309,540
Here: $309,540 State: $433,540 In 3-to-4-unit structures: $318,943
Here: $318,943 State: $362,850 In 5-or-more-unit structures: $276,109
Here: $276,109 State: $412,810 Mobile homes: $164,038
Here: $164,038 State: $113,475 Occupied boats, RVs, vans, etc.: $98,251
Here: $98,251 State: $321,189
Total population: 78,505 (Urban population: 47,954, Rural population: 1,667 (80 farm, 1,587 nonfarm))
Houses: 44,029 (37,515 occupied: 26,828 owner occupied, 10,687 renter occupied)
| % of renters here: | 28% |
| State: | 29% |
Housing density: 684 houses/condos per square mile
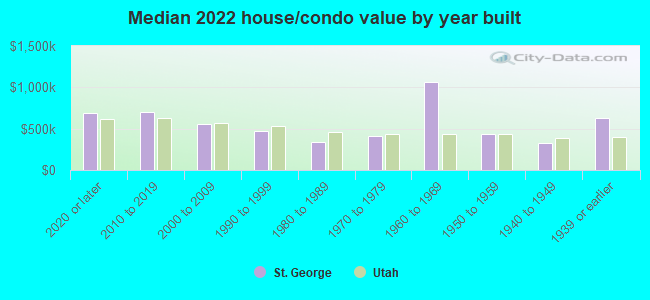
Median price asked for vacant for-sale houses and condos in 2022: $1,053,670.
Median contract rent in 2022: $1,378 (lower quartile is $1,071, upper quartile is $1,804)
Median rent asked for vacant for-rent units in 2022: $1,333
Median gross rent in St. George, UT in 2022: $1,495
Housing units in St. George with a mortgage: 15,183 (2,513 second mortgage, 0 home equity loan, 2,154 both second mortgage and home equity loan)
Houses without a mortgage: 446
Median household income for houses/condos with a mortgage: $106,363
Median household income for apartments without a mortgage: $56,424
Median monthly housing costs: $1,303
Compare current foreclosures near St. George, UT:
| Photo | Address | Area | Beds / Baths | Price | Details |
|---|---|---|---|---|---|

|
#1
1060 E
Saint George, UT 84770
|
1,128 sq. feet
|
2 baths 3 beds |
show details | |

|
#2
W 2440 S
Hurricane, UT 84737
|
2,513 sq. feet
|
3 baths 5 beds |
show details | |

|
#3
W 310 N
Hurricane, UT 84737
|
1,396 sq. feet
|
2 baths 3 beds |
show details | |

|
#4
E Fourteen Fairway Dr
Washington, UT 84780
|
1,284 sq. feet
|
2 baths 2 beds |
show details | |

|
#5
E 700 S, Apt 55
Saint George, UT 84770
|
1,443 sq. feet
|
2 baths 3 beds |
show details | |

|
#6
E 60 S
Ivins, UT 84738
|
1,503 sq. feet
|
2 baths 3 beds |
show details | |

|
#7
E 710 S
Ivins, UT 84738
|
1,415 sq. feet
|
2 baths 3 beds |
show details | |

|
#8
S 320 E
Ivins, UT 84738
|
1,108 sq. feet
|
2 baths 3 beds |
show details | |

|
#9
W 1020 N # 60
Saint George, UT 84770
|
1,079 sq. feet
|
1 baths 2 beds |
show details | |

|
#10
Tuacahn Dr Unit 36
Ivins, UT 84738
|
2,936 sq. feet
|
3 baths 7 beds |
show details |
| Photo | Address | Area | Beds / Baths | Price | Details |
|---|---|---|---|---|---|

|
#11
E 700 N
Saint George, UT 84790
|
1,424 sq. feet
|
2 baths 3 beds |
show details | |

|
#12
S Hidden Valley Dr Unit 203
Saint George, UT 84790
|
1,430 sq. feet
|
2 baths 3 beds |
show details | |

|
#13
Alamosa Dr
Washington, UT 84780
|
1,749 sq. feet
|
3 baths 5 beds |
show details | |

|
#14
N 1300 W Apt 85
Saint George, UT 84770
|
1,079 sq. feet
|
2 baths 3 beds |
show details | |

|
#15
S Hidden Valley Dr Unit 174
Saint George, UT 84790
|
1,430 sq. feet
|
2 baths 3 beds |
show details | |

|
#16
S River Rd # 9
Saint George, UT 84790
|
2,309 sq. feet
|
2 baths 3 beds |
show details | |

|
#17
Crestview Dr
Santa Clara, UT 84765
|
2,992 sq. feet
|
3 baths 3 beds |
show details | |

|
#18
Escalante Dr
Saint George, UT 84790
|
3,592 sq. feet
|
3 baths 6 beds |
show details | |

|
#19
S 2300 E
Saint George, UT 84790
|
4,732 sq. feet
|
4 baths 7 beds |
show details | |

|
#20
E 100 N
Ivins, UT 84738
|
1,137 sq. feet
|
2 baths 3 beds |
show details |
| Photo | Address | Area | Beds / Baths | Price | Details |
|---|---|---|---|---|---|

|
#21
N Great Basin Dr
Saint George, UT 84770
|
1,966 sq. feet
|
2 baths 3 beds |
show details | |

|
#22
W Washington Palms Way
Washington, UT 84780
|
1,733 sq. feet
|
2 baths 3 beds |
show details | |

|
#23
W 975 N
Saint George, UT 84770
|
1,396 sq. feet
|
2 baths 4 beds |
show details | |

|
#24
Jacob Dr
Santa Clara, UT 84765
|
2,893 sq. feet
|
2 baths 5 beds |
show details | |

|
#25
S White Sands Dr
Washington, UT 84780
|
2,330 sq. feet
|
2 baths 3 beds |
show details | |

|
#26
E Telegraph St Lot 64
Washington, UT 84780
|
408 sq. feet
|
1 baths 1 beds |
show details | |

|
#27
Bluff View Dr Unit 96
Washington, UT 84780
|
1,868 sq. feet
|
3 baths 3 beds |
show details | |

|
#28
Santa Clara Pkwy
Santa Clara, UT 84765
|
3,152 sq. feet
|
3 baths 4 beds |
show details | |

|
#29
Quail Ridge Dr
Washington, UT 84780
|
1,354 sq. feet
|
2 baths 3 beds |
show details | |

|
#30
Alpine Dr
Santa Clara, UT 84765
|
1,760 sq. feet
|
2 baths 3 beds |
show details |
| Photo | Address | Area | Beds / Baths | Price | Details |
|---|---|---|---|---|---|

|
#31
N 1950 W
Saint George, UT 84770
|
1,808 sq. feet
|
2 baths 3 beds |
show details | |

|
#32
N Cascade Canyon Dr
Saint George, UT 84770
|
3,596 sq. feet
|
3 baths 3 beds |
show details | |

|
#33
S River Rd Unit 8
Saint George, UT 84790
|
1,460 sq. feet
|
2 baths 3 beds |
show details | |

|
#34
N 2200 W
Saint George, UT 84770
|
1,568 sq. feet
|
2 baths 3 beds |
show details | |

|
#35
W 1350 N
Saint George, UT 84770
|
1,907 sq. feet
|
2 baths 4 beds |
show details | |

|
#36
Latonia Cir
Saint George, UT 84790
|
1,952 sq. feet
|
2 baths 3 beds |
show details | |

|
#37
Manzanita Rd Apt 8
Saint George, UT 84790
|
4,508 sq. feet
|
3 baths 2 beds |
show details | |

|
#38
Covey Ln
Santa Clara, UT 84765
|
5,457 sq. feet
|
5 baths 4 beds |
show details | |

|
#39
Goldenrod Cir
Saint George, UT 84790
|
2,644 sq. feet
|
2 baths 2 beds |
show details | |

|
#40
W 1200 N
Saint George, UT 84770
|
1,275 sq. feet
|
2 baths 3 beds |
show details |
| Photo | Address | Area | Beds / Baths | Price | Details |
|---|---|---|---|---|---|

|
#41
N Ocotillo Dr
Washington, UT 84780
|
2,120 sq. feet
|
3 baths 5 beds |
show details | |

|
#42
Escalante Dr
Saint George, UT 84790
|
1,794 sq. feet
|
2 baths 3 beds |
show details | |

|
#43
W Blue Mountain Rd
Washington, UT 84780
|
4,177 sq. feet
|
3 baths 4 beds |
show details | |

|
#44
W 175 N
Hurricane, UT 84737
|
1,357 sq. feet
|
2 baths 3 beds |
show details | |

|
#45
E 100 S
Saint George, UT 84770
|
2,046 sq. feet
|
3 baths 4 beds |
show details | |

|
#46
W Indian Hills Dr Unit 38
Saint George, UT 84770
|
1,482 sq. feet
|
2 baths 3 beds |
show details | |

|
#47
Ridge Rim Way
Saint George, UT 84770
|
1,200 sq. feet
|
2 baths 3 beds |
show details | |

|
#48
E 400 S, Unit 31
Saint George, UT 84790
|
1,382 sq. feet
|
2 baths 3 beds |
show details | |

|
#49
E Sweetwater Springs Dr
Washington, UT 84780
|
1,442 sq. feet
|
2 baths 3 beds |
show details | |

|
Check over 1 million property listings on Foreclosure.com!
|
browse all offers | |||


 | Apartment/Rental recommendations in St. George (0 replies) |
| Places to rent (12 replies) |
| 55+ Communities In or Near St. George (18 replies) |
| Reputable Real Estate Agent St. George area (10 replies) |
| Moving to St. George - advice needed (40 replies) |
| Floods in St. George (3 replies) |
Median year apartment built: 1995
Household type by relationship:
Households: 102,523- Male householders: 19,930 (3,262 living alone), Female householders: 17,585 (5,561 living alone)
22,411 spouses (22,323 opposite-sex spouses), 2,138 unmarried partners, (1,688 opposite-sex unmarried partners), 31,385 children (30,201 natural, 347 adopted, 837 stepchildren), 1,484 grandchildren, 494 brothers or sisters, 765 parents, 0 foster children, 1,281 other relatives, 3,117 non-relatives
- In group quarters: 1,933
Size of family households: 11,449 2-persons, 5,687 3-persons, 4,041 4-persons, 3,176 5-persons, 1,316 6-persons, 849 7-or-more-persons.
Size of nonfamily households: 8,823 1-person, 1,615 2-persons, 373 3-persons, 186 4-persons.
19,597 married couples with children.
5,089 single-parent households (2,288 men, 2,801 women).
87.3% of residents of St. George speak English at home.
9.6% of residents speak Spanish at home (66% speak English very well, 18% speak English well, 13% speak English not well, 2% don't speak English at all).
1.3% of residents speak other Indo-European language at home (93% speak English very well, 3% speak English well, 4% don't speak English at all).
1.7% of residents speak Asian or Pacific Island language at home (64% speak English very well, 17% speak English well, 18% speak English not well, 1% don't speak English at all).
0.3% of residents speak other language at home (50% speak English very well, 23% speak English well, 28% speak English not well).
Foreign born population: 7,104 (6.9%)
(33.8% of them are naturalized citizens)
| Here: | 6.6 |
| State: | 7.6 |
| Here: | 4.8 |
| State: | 4.3 |
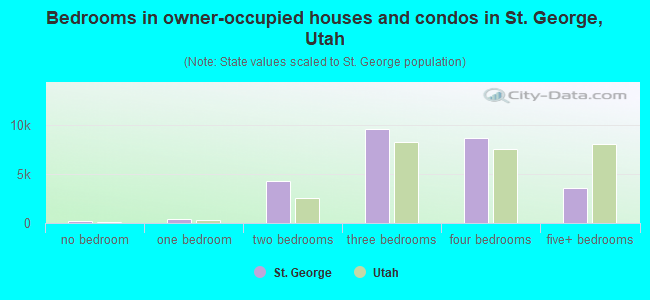
- Bedrooms in owner-occupied houses and condos in St. George, Utah
- 180no bedroom
- 4311 bedroom
- 4,2812 bedrooms
- 9,6083 bedrooms
- 8,7354 bedrooms
- 3,5935+ bedrooms
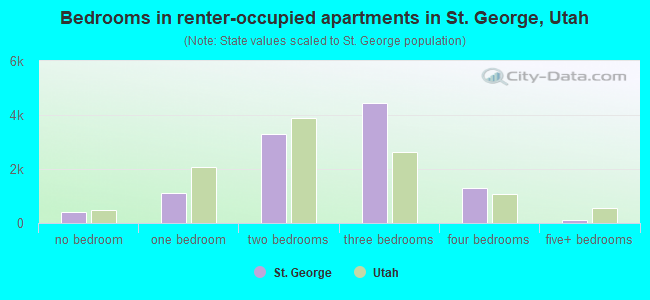
- Bedrooms in renter-occupied apartments in St. George, Utah
- 418no bedroom
- 1,1161 bedroom
- 3,3052 bedrooms
- 4,4313 bedrooms
- 1,2954 bedrooms
- 1225+ bedrooms
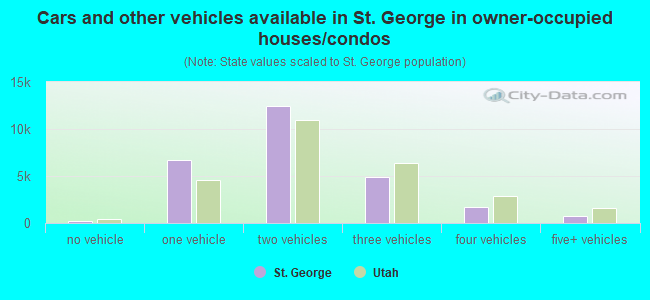
- Cars and other vehicles available in St. George in owner-occupied houses/condos
- 251no vehicle
- 6,6731 vehicle
- 12,4672 vehicles
- 4,9443 vehicles
- 1,7064 vehicles
- 7875+ vehicles
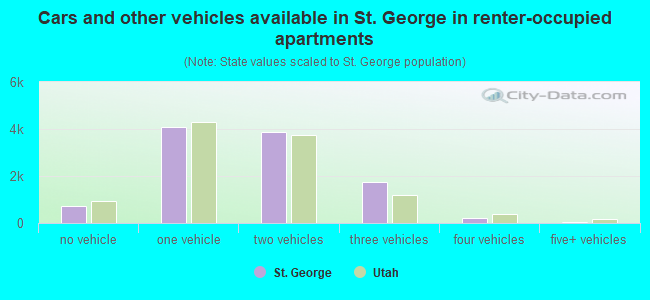
- Cars and other vehicles available in St. George in renter-occupied apartments
- 710no vehicle
- 4,0981 vehicle
- 3,8592 vehicles
- 1,7563 vehicles
- 2104 vehicles
- 545+ vehicles
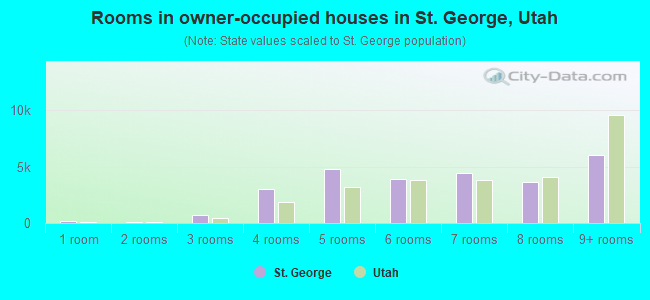
- Rooms in owner-occupied houses in St. George, Utah
- 1801 room
- 822 rooms
- 7293 rooms
- 3,0234 rooms
- 4,8305 rooms
- 3,9066 rooms
- 4,4407 rooms
- 3,6058 rooms
- 6,0339+ rooms
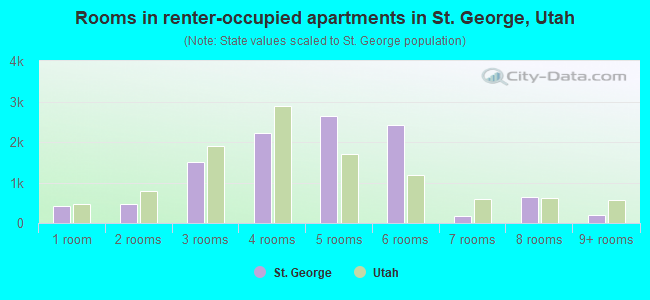
- Rooms in renter-occupied apartments in St. George, Utah
- 4181 room
- 4782 rooms
- 1,4953 rooms
- 2,2284 rooms
- 2,6385 rooms
- 2,4186 rooms
- 1847 rooms
- 6368 rooms
- 1929+ rooms
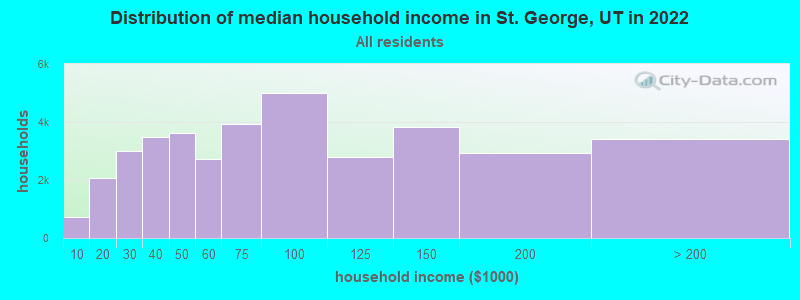
St. George, UT household income distribution

- 731Less than $10,000
- 2,086$10,000 to $19,999
- 2,987$20,000 to $29,999
- 3,484$30,000 to $39,999
- 3,621$40,000 to $49,999
- 2,730$50,000 to $59,999
- 3,933$60,000 to $74,999
- 4,988$75,000 to $99,999
- 2,792$100,000 to $124,999
- 3,830$125,000 to $149,999
- 2,933$150,000 to $199,999
- 3,400$200,000 or more
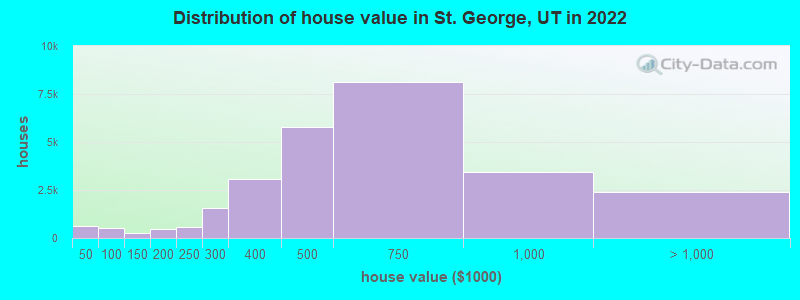
Home value of owner - occupied houses in 2022 in St. George, UT
-
- 167Less than $10,000
- 39$10,000 to $14,999
- 45$15,000 to $19,999
- 103$20,000 to $24,999
- 54$25,000 to $29,999
- 130$30,000 to $34,999
- 4$35,000 to $39,999
- 96$40,000 to $49,999
- 216$50,000 to $59,999
- 120$60,000 to $69,999
- 58$70,000 to $79,999
- 18$90,000 to $99,999
- 159$100,000 to $124,999
- 101$125,000 to $149,999
- 268$150,000 to $174,999
- 210$175,000 to $199,999
- 562$200,000 to $249,999
- 1,560$250,000 to $299,999
- 3,070$300,000 to $399,999
- 5,760$400,000 to $499,999
- 8,099$500,000 to $749,999
- 3,425$750,000 to $999,999
- 1,712$1,000,000 to $1,499,999
- 232$1,500,000 to $1,999,999
- 447$2,000,000 or more
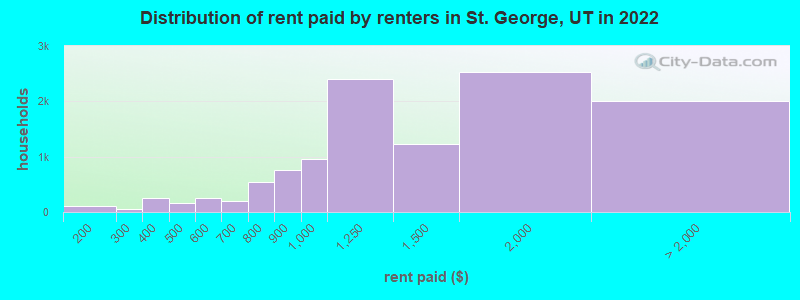
Rent paid by renters in 2022 in St. George, UT
-
- 9Less than $100
- 116$150 to $199
- 17$200 to $249
- 44$250 to $299
- 47$300 to $349
- 212$350 to $399
- 54$400 to $449
- 115$450 to $499
- 152$500 to $549
- 97$550 to $599
- 110$600 to $649
- 89$650 to $699
- 247$700 to $749
- 296$750 to $799
- 761$800 to $899
- 950$900 to $999
- 2,405$1,000 to $1,249
- 1,231$1,250 to $1,499
- 2,524$1,500 to $1,999
- 885$2,000 to $2,499
- 273$2,500 to $2,999
- 64$3,000 to $3,499
- 246$3,500 or more
- 544No cash rent
Percentage of workers working in this county: 96.9%
Number of people working at home: 7,180 (16.1% of all workers)
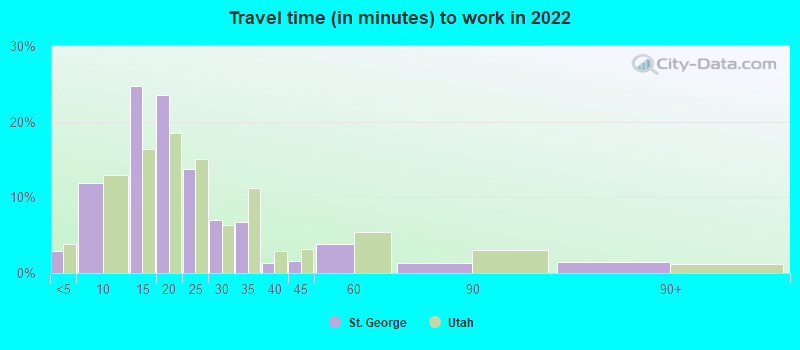
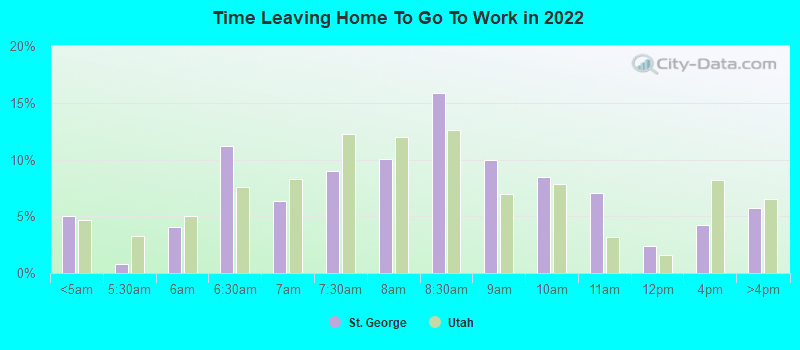
Travel time to work (commute)
- Less than 5 minutes: 1,265
- 5 to 9 minutes: 5,234
- 10 to 14 minutes: 10,302
- 15 to 19 minutes: 10,601
- 20 to 24 minutes: 3,891
- 25 to 29 minutes: 1,363
- 30 to 34 minutes: 1,380
- 35 to 39 minutes: 553
- 40 to 44 minutes: 663
- 45 to 59 minutes: 573
- 60 to 89 minutes: 53
- 90 or more minutes: 845
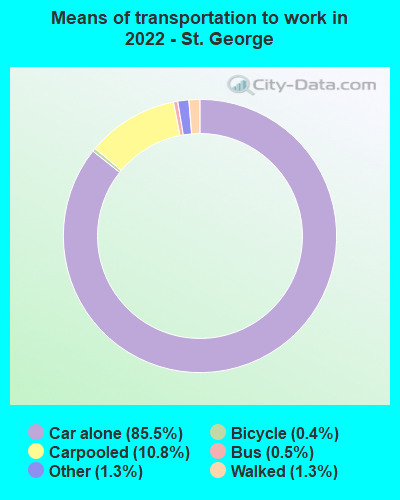
Means of transportation to work:
- Drove a car alone: 45,589 (73.8%)
- Carpooled: 6,176 (10.0%)
- Bus: 243 (0.4%)
- Subway or elevated rail: 12 (0.0%)
- Ferryboat: 35 (0.1%)
- Taxi: 609 (1.0%)
- Bicycle: 238 (0.4%)
- Walked: 897 (1.5%)
- Worked at home: 7,180 (11.6%)
- Unemployment by race in 2022
- Unemployment rate for White non-Hispanic residents
- 1.1%Males
- 3.2%Females
- Unemployment rate for Asian residents
- 19.7%Males
- Unemployment rate for other race residents
- 4.0%Males
- 7.9%Females
- Unemployment rate for two or more race residents
- 6.4%Males
- 3.3%Females
- Unemployment rate for Hispanic or Latino residents
- 2.6%Males
- 8.5%Females
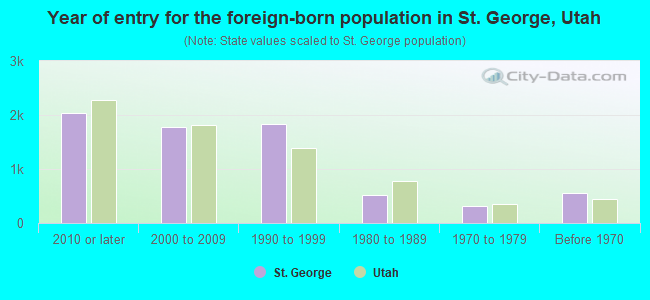
- Year of entry for the foreign-born population in St. George, Utah
- 2,0432010 or later
- 1,7692000 to 2009
- 1,8271990 to 1999
- 5231980 to 1989
- 3071970 to 1979
- 554Before 1970
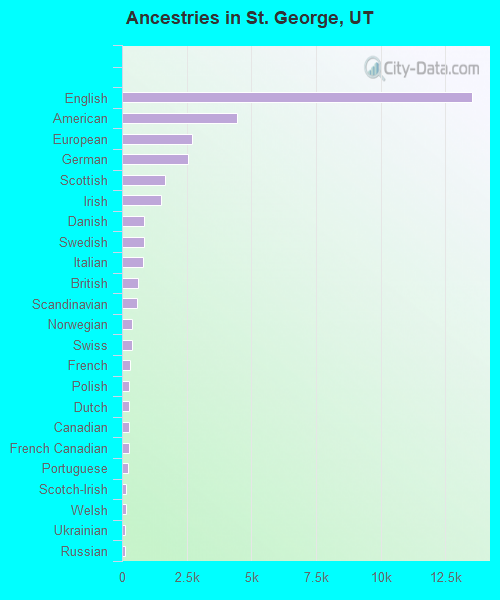
First ancestries reported:
- English: 13,507 (27.5%)
- American: 4,433 (9.0%)
- European: 2,689 (5.5%)
- German: 2,552 (5.2%)
- Scottish: 1,646 (3.3%)
- Irish: 1,511 (3.1%)
- Danish: 865 (1.8%)
- Swedish: 836 (1.7%)
- Italian: 830 (1.7%)
- British: 602 (1.2%)
- Scandinavian: 597 (1.2%)
- Norwegian: 378 (0.8%)
- Swiss: 368 (0.7%)
- French: 293 (0.6%)
- Polish: 278 (0.6%)
- Dutch: 274 (0.6%)
- Canadian: 265 (0.5%)
- French Canadian: 252 (0.5%)
- Portuguese: 240 (0.5%)
- Scotch-Irish: 156 (0.3%)
- Welsh: 144 (0.3%)
- Ukrainian: 135 (0.3%)
- Russian: 130 (0.3%)
- Egyptian: 119 (0.2%)
- Northern European: 102 (0.2%)
- Eastern European: 98 (0.2%)
- Ethiopian: 78 (0.2%)
- Brazilian: 66 (0.1%)
- Finnish: 56 (0.1%)
- Czech: 39 (0.08%)
- Jamaican: 37 (0.08%)
- Slovak: 34 (0.07%)
- Pennsylvania German: 33 (0.07%)
- Hungarian: 32 (0.07%)
- Austrian: 30 (0.06%)
- Greek: 24 (0.05%)
- Romanian: 21 (0.04%)
- African: 20 (0.04%)
- Turkish: 20 (0.04%)
- Croatian: 16 (0.03%)
- Australian: 6 (0.01%)
Most common places of birth for foreign-born residents (%):
| St. George: | 37.7% (2,697) |
| Utah: | 36.1% (99,740) |
| St. George: | 6.8% (488) |
| Utah: | 3.2% (8,804) |
| St. George: | 6.6% (474) |
| Utah: | 2.6% (7,062) |
| St. George: | 5.6% (402) |
| Utah: | 3.0% (8,341) |
| St. George: | 5.3% (381) |
| Utah: | 2.1% (5,902) |
| St. George: | 5.0% (359) |
| Utah: | 2.8% (7,644) |
| St. George: | 4.4% (313) |
| Utah: | 2.6% (7,211) |
| St. George: | 4.0% (289) |
| Utah: | 2.3% (6,468) |
| St. George: | 3.5% (249) |
| Utah: | 2.7% (7,472) |
| St. George: | 2.2% (156) |
| Utah: | 0.3% (808) |
| St. George: | 1.8% (127) |
| Utah: | 1.3% (3,570) |
Place of birth for U.S.-born residents:
- This state: 51,596
- Other state: 43,400
- Northeast: 2,871
- Midwest: 7,274
- South: 3,851
- West: 29,404
81.0% of St. George residents lived in the same house 1 years ago.
Out of people who lived in different houses, 29.6% lived in this county.
Out of people who lived in different counties, 49.2% lived in Utah.
| St. George: | 81.0% |
| State average: | 85.7% |
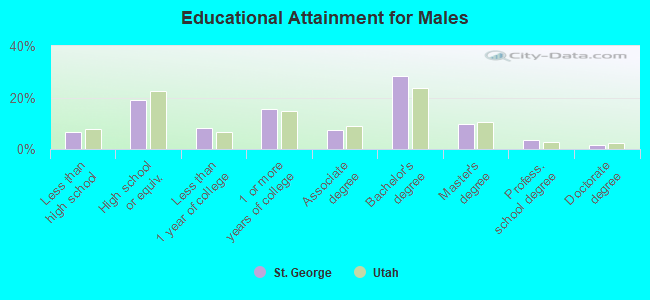
Education attainment for males 25 years and older:
- No schooling: 531
- Nursery to 4th grade: 283
- 5th and 6th grade: 144
- 7th and 8th grade: 0
- 9th grade: 422
- 10th grade: 0
- 11th grade: 0
- 12th grade, no diploma: 660
- High school graduate (or equivalency): 5,827
- Less than 1 year of college: 2,491
- Some college more than 1 year, no degree: 4,806
- Associate degree: 2,334
- Bachelor's degree: 8,735
- Master's degree: 3,048
- Professional school degree: 1,067
- Doctorate degree: 485
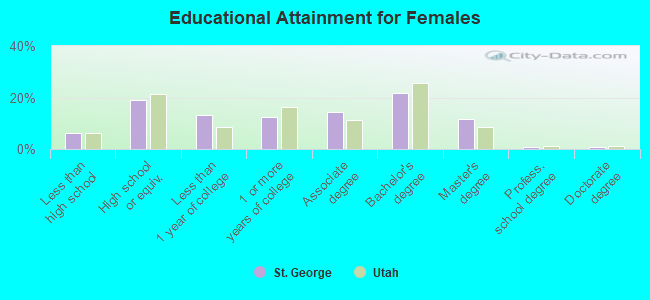
Education attainment for females 25 years and older:
- No schooling: 723
- Nursery to 4th grade: 164
- 5th and 6th grade: 227
- 7th and 8th grade: 105
- 9th grade: 0
- 10th grade: 159
- 11th grade: 308
- 12th grade, no diploma: 376
- High school graduate (or equivalency): 6,496
- Less than 1 year of college: 4,536
- Some college more than 1 year, no degree: 4,228
- Associate degree: 4,834
- Bachelor's degree: 7,409
- Master's degree: 3,925
- Professional school degree: 315
- Doctorate degree: 285
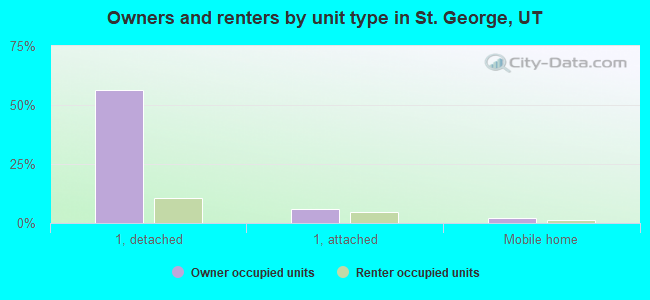
Housing units in structures:
- One, detached: 31,920
- One, attached: 3,929
- Two: 318
- 3 or 4: 1,228
- 5 to 9: 1,390
- 10 to 19: 1,393
- 20 to 49: 1,019
- 50 or more: 1,511
- Mobile homes: 1,239
- Boats, RVs, vans, etc.: 82
Median worth of mobile homes: $59,700
Housing units lacking complete kitchen facilities in 2022: 1.4%
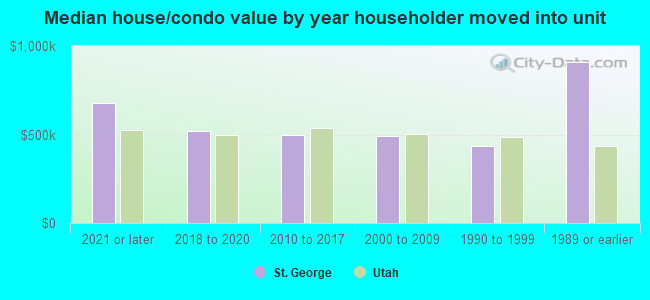
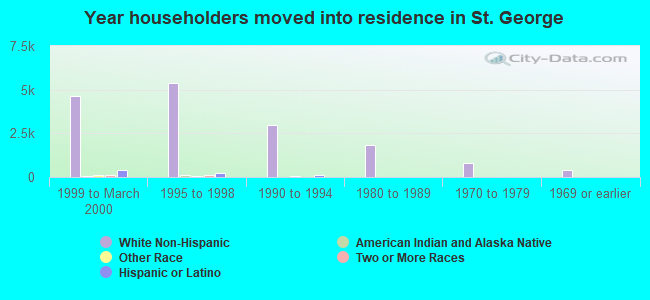
House/condo owner moved in on average 7 years ago
Renter moved in on average 2 years ago
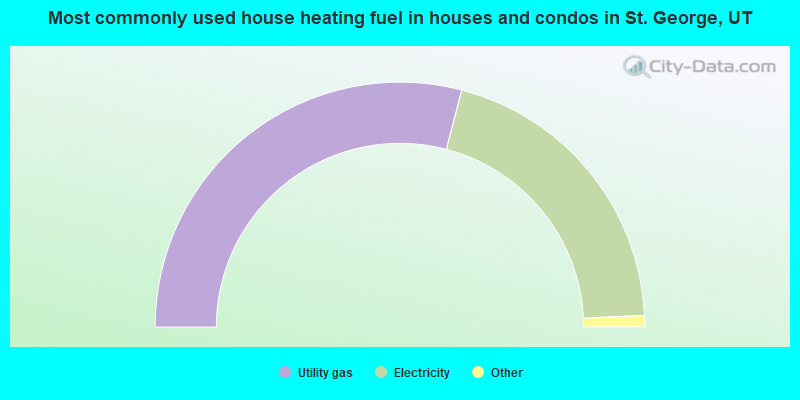
- 58.2%Utility gas
- 40.4%Electricity
- 1.0%Bottled, tank, or LP gas
- 0.1%Solar energy
- 0.1%No fuel used
- 0.1%Other fuel
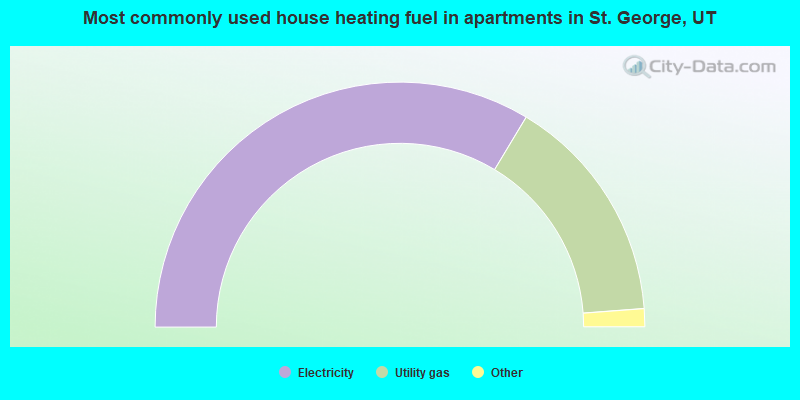
- 67.3%Electricity
- 30.4%Utility gas
- 1.1%No fuel used
- 1.0%Bottled, tank, or LP gas
- 0.3%Coal or coke
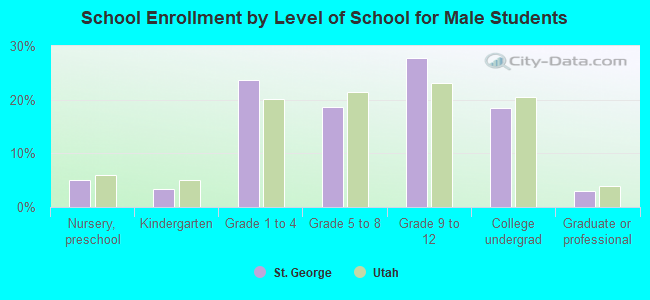
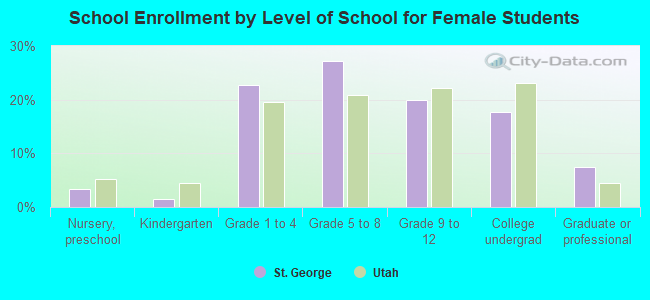
Private vs. public school enrollment:
| Here: | 4.8% |
| Utah: | 7.2% |
| Here: | 1.0% |
| Utah: | 5.3% |
| Here: | 14.2% |
| Utah: | 26.7% |