Springfield, MO (Missouri) Houses and Residents
Estimated median house or condo value in 2022: $166,400 (it was $78,700 in 2000 )
Springfield:
$166,400Missouri:
$221,200
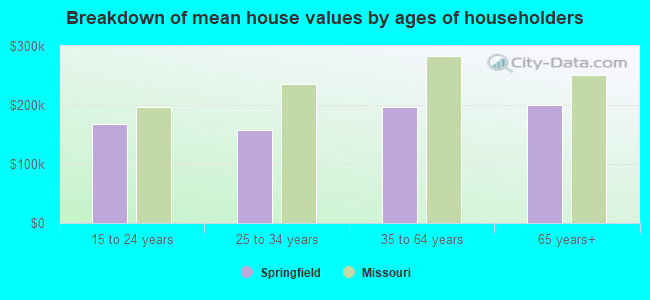
Lower value quartile - upper value quartile: $105,900 - $242,700Mean price in 2022: Detached houses: $197,421 Here:
$197,421State:
$278,068
Townhouses or other attached units: $229,458 Here:
$229,458State:
$260,773
In 2-unit structures: $156,478 Here:
$156,478State:
$172,667
In 3-to-4-unit structures: $168,898 Here:
$168,898State:
$181,162
In 5-or-more-unit structures: $262,280 Here:
$262,280State:
$263,082
Mobile homes: $48,270 Here:
$48,270State:
$95,912
Occupied boats, RVs, vans, etc.: $94,807 Here:
$94,807State:
$113,560
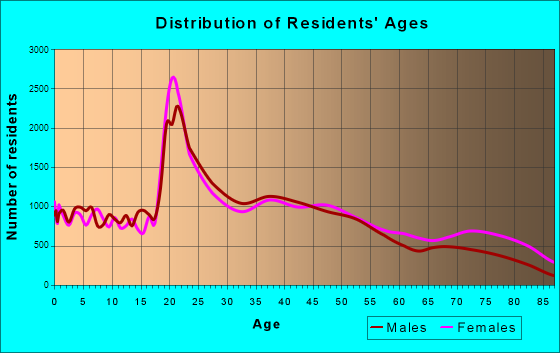
Total population: 165,378 (Urban population: 151,247, Rural population: 576 (25 farm, 551 nonfarm ))
Houses: 84,329 (77,278 occupied: 31,464 owner occupied, 45,814 renter occupied )
% of renters here:
59%State:
32%
Housing density: 1,153 houses/condos per square mile
Median price asked for vacant for-sale houses and condos in 2022: $294,575.
Median contract rent in 2022: $736 (lower quartile is $569, upper quartile is $926)
Median rent asked for vacant for-rent units in 2022: $1,478
Median gross rent in Springfield, MO in 2022: $900
Housing units in Springfield with a mortgage: 18,438 (1,039 second mortgage, 0 home equity loan, 870 both second mortgage and home equity loan )Houses without a mortgage: 270
Median household income for houses/condos with a mortgage: $65,038
Median household income for apartments without a mortgage: $48,721
Median monthly housing costs: $864
Data:
Median house or condo value ($)
Median house or condo value ($ change since 2000)
Median house or condo value ($) - White
Median house or condo value ($) - Black or African American
Median house or condo value ($) - Asian
Median house or condo value ($) - Hispanic or Latino
Median house or condo value ($) - American Indian and Alaska Native
Median house or condo value ($) - Multirace
Median house or condo value ($) - Other Race
Median price asked for mobile homes ($)
Household density (households per square mile)
Mean house or condo value by units in structure - 1, detached ($)
Mean house or condo value by units in structure - 1, attached ($)
Mean house or condo value by units in structure - 2 ($)
Mean house or condo value by units in structure by units in structure - 3 or 4 ($)
Mean house or condo value by units in structure - 5 or more ($)
Mean house or condo value by units in structure - Boat, RV, van, etc. ($)
Mean house or condo value by units in structure - Mobile home ($)
Median contract rent ($)
Median contract rent - Lower quartile ($)
Median contract rent - Upper quartile ($)
Median gross rent ($)
Urban houses (%)
Rural houses (%)
Houses occupied (%)
Houses occupied (% change since 2000)
Houses owner occupied (%)
Houses owner occupied (% change since 2000)
Houses renter occupied (%)
Houses renter occupied (% change since 2000)
Vacant housing units - For rent (%)
Vacant housing units - For rent (% change since 2000)
Vacant housing units - For sale only (%)
Vacant housing units - For sale only (% change since 2000)
Vacant housing units - Rented or sold, not occupied (%)
Vacant housing units - Rented or sold, not occupied (% change since 2000)
Vacant housing units - For seasonal, recreational, or occasional use (%)
Vacant housing units - For seasonal, recreational, or occasional use (% change since 2000)
Vacant housing units - For migrant workers (%)
Vacant housing units - For migrant workers (% change since 2000)
Vacant housing units - Other vacant (%)
Vacant housing units - Other vacant (% change since 2000)
Median monthly housing costs ($)
Median household income for houses/condos with a mortgage ($)
Median household income for houses/condos without a mortgage ($)
Median household income ($)
Median household income ($) - White
Median household income ($) - Black or African American
Median household income ($) - Asian
Median household income ($) - Hispanic or Latino
Median household income ($) - American Indian and Alaska Native
Median household income ($) - Multirace
Median household income ($) - Other Race
Mortgage status - with mortgage (%)
Mortgage status - with second mortgage (%)
Mortgage status - with home equity loan (%)
Mortgage status - with both second mortgage and home equity loan (%)
Mortgage status - without a mortgage (%)
Median year house/condo built
Median year apartment built
Household type by relationship - Male householder living alone (%)
Household type by relationship - Male householder not living alone (%)
Household type by relationship - Female householder living alone (%)
Household type by relationship - Female householder not living alone (%)
Household type by relationship - Opposite-Sex spouse (%)
Household type by relationship - Same-Sex spouse (%)
Household type by relationship - Opposite-Sex unmarried partner (%)
Household type by relationship - Same-Sex unmarried partner (%)
Household type by relationship - In group quarters (%)
Size of family households - 2-person household (%)
Size of family households - 3-person household (%)
Size of family households - 4-person household (%)
Size of family households - 5-person household (%)
Size of family households - 6-person household (%)
Size of family households - 7-or-more-person household (%)
Size of nonfamily households - 1-person household (%)
Size of nonfamily households - 2-person household (%)
Size of nonfamily households - 3-person household (%)
Size of nonfamily households - 4-person household (%)
Size of nonfamily households - 5-person household (%)
Size of nonfamily households - 6-person household (%)
Size of nonfamily households - 7-or-moreperson household (%)
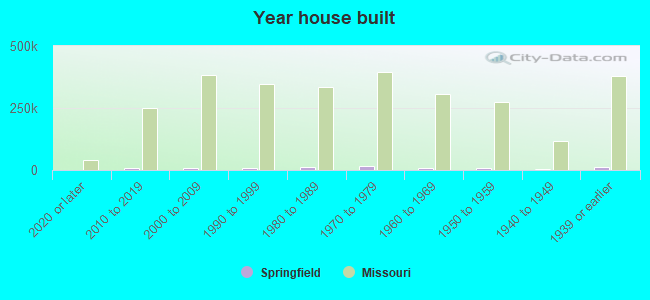
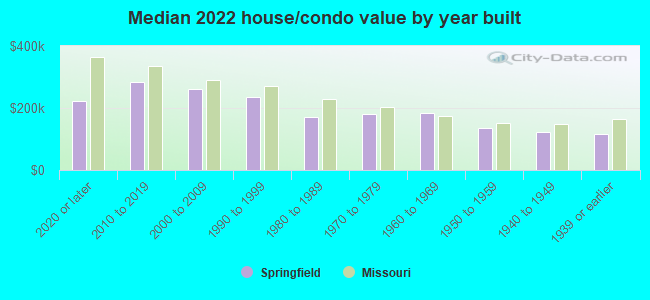
Year house built - Built 2010 or later (%)
Year house built - Built 2000 to 2009 (%)
Year house built - Built 1990 to 1999 (%)
Year house built - Built 1980 to 1989 (%)
Year house built - Built 1970 to 1979 (%)
Year house built - Built 1960 to 1969 (%)
Year house built - Built 1950 to 1959 (%)
Year house built - Built 1940 to 1949 (%)
Year house built - Built 1939 or earlier (%)
Median number of rooms in houses and condos
Median number of rooms in apartments
Median number of bedrooms in owner occupied houses
Mean number of bedrooms in owner occupied houses
Median number of bedrooms in renter occupied houses
Mean number of bedrooms in renter occupied houses
Median number of vehichles in owner occupied houses
Mean number of vehichles in owner occupied houses
Median number of vehichles in renter occupied houses
Mean number of vehichles in renter occupied houses
Rooms in owner-occupied houses - 1 room (%)
Rooms in owner-occupied houses - 2 rooms (%)
Rooms in owner-occupied houses - 3 rooms (%)
Rooms in owner-occupied houses - 4 rooms (%)
Rooms in owner-occupied houses - 5 rooms (%)
Rooms in owner-occupied houses - 6 rooms (%)
Rooms in owner-occupied houses - 7 rooms (%)
Rooms in owner-occupied houses - 8 rooms (%)
Rooms in owner-occupied houses - 9+ rooms (%)
Rooms in renter-occupied houses - 1 room (%)
Rooms in renter-occupied houses - 2 rooms (%)
Rooms in renter-occupied houses - 3 rooms (%)
Rooms in renter-occupied houses - 4 rooms (%)
Rooms in renter-occupied houses - 5 rooms (%)
Rooms in renter-occupied houses - 6 rooms (%)
Rooms in renter-occupied houses - 7 rooms (%)
Rooms in renter-occupied houses - 8 rooms (%)
Rooms in renter-occupied houses - 9+ rooms (%)
Bedrooms in owner-occupied houses - no bedrooms (%)
Bedrooms in owner-occupied houses - 1 bedroom (%)
Bedrooms in owner-occupied houses - 2 bedrooms (%)
Bedrooms in owner-occupied houses - 3 bedrooms (%)
Bedrooms in owner-occupied houses - 4 bedrooms (%)
Bedrooms in owner-occupied houses - 5+ bedrooms (%)
Bedrooms in renter-occupied houses - no bedrooms (%)
Bedrooms in renter-occupied houses - 1 bedroom (%)
Bedrooms in renter-occupied houses - 2 bedrooms (%)
Bedrooms in renter-occupied houses - 3 bedrooms (%)
Bedrooms in renter-occupied houses - 4 bedrooms (%)
Bedrooms in renter-occupied houses - 5+ bedrooms (%)
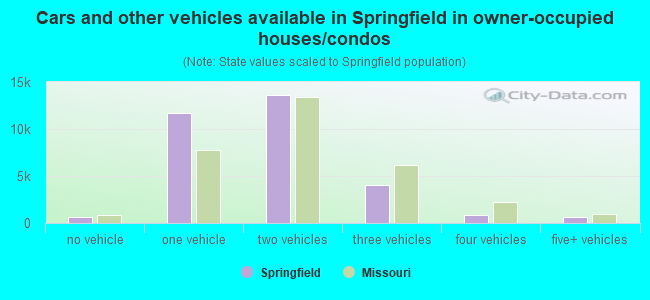
Vehicles available in owner-occupied houses - no vehicle available (%)
Vehicles available in owner-occupied houses - 1 vehicle available(%)
Vehicles available in owner-occupied houses - 2 Vehicles available (%)
Vehicles available in owner-occupied houses - 3 Vehicles available (%)
Vehicles available in owner-occupied houses - 4 Vehicles available (%)
Vehicles available in owner-occupied houses - 5+ Vehicles available (%)
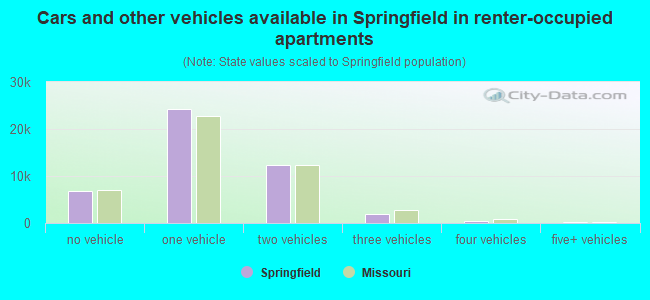
Vehicles available in renter-occupied houses - no vehicle available (%)
Vehicles available in renter-occupied houses - 1 vehicle available (%)
Vehicles available in renter-occupied houses - 2 Vehicles available (%)
Vehicles available in renter-occupied houses - 3 Vehicles available (%)
Vehicles available in renter-occupied houses - 4 Vehicles available (%)
Vehicles available in renter-occupied houses - 5+ Vehicles available (%)
Housing units in structures - 1, detached (%)
Housing units in structures - 1, attached (%)
Housing units in structures - 2 (%)
Housing units in structures - 3 or 4 (%)
Housing units in structures - 5 to 9 (%)
Housing units in structures - 10 to 19 (%)
Housing units in structures - 20 to 49 (%)
Housing units in structures - 50 or more (%)
Housing units in structures - Mobile home (%)
Housing units in structures - Boat, RV, van, etc. (%)
Housing units in structures - Owners - 1, detached (%)
Housing units in structures - Owners - 1, attached (%)
Housing units in structures - Owners - 2 (%)
Housing units in structures - Owners - 3 or 4 (%)
Housing units in structures - Owners - 5 to 9 (%)
Housing units in structures - Owners - 10 to 19 (%)
Housing units in structures - Owners - 20 to 49 (%)
Housing units in structures - Owners - 50 or more (%)
Housing units in structures - Owners - Mobile home (%)
Housing units in structures - Owners - Boat, RV, van, etc. (%)
Housing units in structures - Renters - 1, detached (%)
Housing units in structures - Renters - 1, attached (%)
Housing units in structures - Renters - 2 (%)
Housing units in structures - Renters - 3 or 4 (%)
Housing units in structures - Renters - 5 to 9 (%)
Housing units in structures - Renters - 10 to 19 (%)
Housing units in structures - Renters - 20 to 49 (%)
Housing units in structures - Renters - 50 or more (%)
Housing units in structures - Renters - Mobile home (%)
Housing units in structures - Renters - Boat, RV, van, etc. (%)
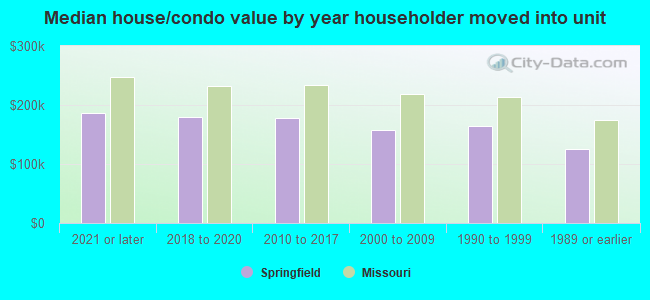
House/condo owner moved in on average (years ago)
Renter moved in on average (years ago)
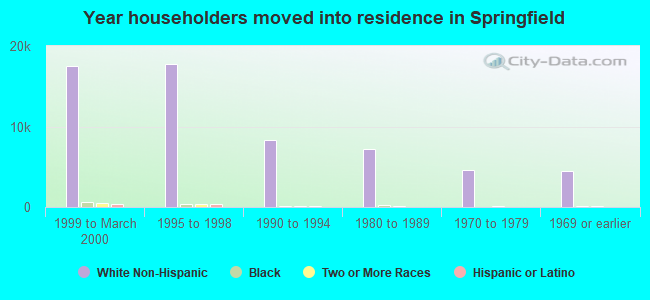
Year householder moved into unit - Moved in 1999 to March 2000 (%)
Year householder moved into unit - Moved in 1999 to March 2000 (%) - White
Year householder moved into unit - Moved in 1999 to March 2000 (%) - Black or African American
Year householder moved into unit - Moved in 1999 to March 2000 (%) - Asian
Year householder moved into unit - Moved in 1999 to March 2000 (%) - Hispanic or Latino
Year householder moved into unit - Moved in 1999 to March 2000 (%) - American Indian and Alaska Native
Year householder moved into unit - Moved in 1999 to March 2000 (%) - Multirace
Year householder moved into unit - Moved in 1999 to March 2000 (%) - Other Race
Year householder moved into unit - Moved in 1995 to 1998 (%)
Year householder moved into unit - Moved in 1995 to 1998 (%) - White
Year householder moved into unit - Moved in 1995 to 1998 (%) - Black or African American
Year householder moved into unit - Moved in 1995 to 1998 (%) - Asian
Year householder moved into unit - Moved in 1995 to 1998 (%) - Hispanic or Latino
Year householder moved into unit - Moved in 1995 to 1998 (%) - American Indian and Alaska Native
Year householder moved into unit - Moved in 1995 to 1998 (%) - Multirace
Year householder moved into unit - Moved in 1995 to 1998 (%) - Other Race
Year householder moved into unit - Moved in 1990 to 1994 (%)
Year householder moved into unit - Moved in 1990 to 1994 (%) - White
Year householder moved into unit - Moved in 1990 to 1994 (%) - Black or African American
Year householder moved into unit - Moved in 1990 to 1994 (%) - Asian
Year householder moved into unit - Moved in 1990 to 1994 (%) - Hispanic or Latino
Year householder moved into unit - Moved in 1990 to 1994 (%) - American Indian and Alaska Native
Year householder moved into unit - Moved in 1990 to 1994 (%) - Multirace
Year householder moved into unit - Moved in 1990 to 1994 (%) - Other Race
Year householder moved into unit - Moved in 1980 to 1989 (%)
Year householder moved into unit - Moved in 1980 to 1989 (%) - White
Year householder moved into unit - Moved in 1980 to 1989 (%) - Black or African American
Year householder moved into unit - Moved in 1980 to 1989 (%) - Asian
Year householder moved into unit - Moved in 1980 to 1989 (%) - Hispanic or Latino
Year householder moved into unit - Moved in 1980 to 1989 (%) - American Indian and Alaska Native
Year householder moved into unit - Moved in 1980 to 1989 (%) - Multirace
Year householder moved into unit - Moved in 1980 to 1989 (%) - Other Race
Year householder moved into unit - Moved in 1970 to 1979 (%)
Year householder moved into unit - Moved in 1970 to 1979 (%) - White
Year householder moved into unit - Moved in 1970 to 1979 (%) - Black or African American
Year householder moved into unit - Moved in 1970 to 1979 (%) - Asian
Year householder moved into unit - Moved in 1970 to 1979 (%) - Hispanic or Latino
Year householder moved into unit - Moved in 1970 to 1979 (%) - American Indian and Alaska Native
Year householder moved into unit - Moved in 1970 to 1979 (%) - Multirace
Year householder moved into unit - Moved in 1970 to 1979 (%) - Other Race
Year householder moved into unit - Moved in 1969 or earlier (%)
Year householder moved into unit - Moved in 1969 or earlier (%) - White
Year householder moved into unit - Moved in 1969 or earlier (%) - Black or African American
Year householder moved into unit - Moved in 1969 or earlier (%) - Asian
Year householder moved into unit - Moved in 1969 or earlier (%) - Hispanic or Latino
Year householder moved into unit - Moved in 1969 or earlier (%) - American Indian and Alaska Native
Year householder moved into unit - Moved in 1969 or earlier (%) - Multirace
Year householder moved into unit - Moved in 1969 or earlier (%) - Other Race
Housing units lacking complete plumbing facilities (%)
Housing units lacking complete kitchen facilities (%)
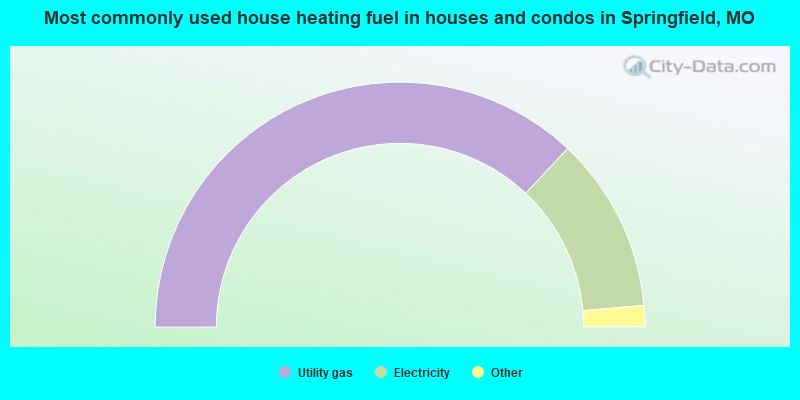
House heating fuel used in houses and condos - Utility gas (%)
House heating fuel used in houses and condos - Bottled, tank, or LP gas (%)
House heating fuel used in houses and condos - Electricity (%)
House heating fuel used in houses and condos - Fuel oil, kerosene, etc. (%)
House heating fuel used in houses and condos - Coal or coke (%)
House heating fuel used in houses and condos - Wood (%)
House heating fuel used in houses and condos - Solar energy (%)
House heating fuel used in houses and condos - Other fuel (%)
House heating fuel used in houses and condos - No fuel used (%)
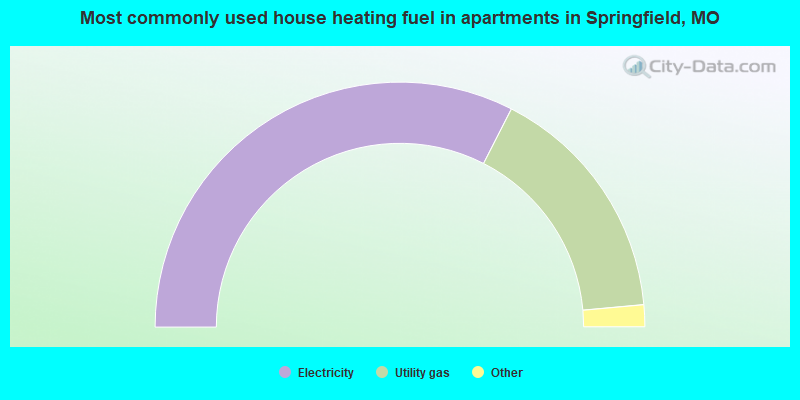
House heating fuel used in apartments - Utility gas (%)
House heating fuel used in apartments - Bottled, tank, or LP gas (%)
House heating fuel used in apartments - Electricity (%)
House heating fuel used in apartments - Fuel oil, kerosene, etc. (%)
House heating fuel used in apartments - Coal or coke (%)
House heating fuel used in apartments - Wood (%)
House heating fuel used in apartments - Solar energy (%)
House heating fuel used in apartments - Other fuel (%)
House heating fuel used in apartments - No fuel used (%)
Latest news about housing in Springfield, MO collected exclusively by city-data.com from local newspapers, TV, and radio stations
Median year house/condo built: 1968Median year apartment built: 1981Household type by relationship:
Households: 170,062
Male householders: 36,293 (13,320 living alone ), Female householders: 40,985 (17,060 living alone )25,195 spouses (24,923 opposite-sex spouses ), 8,343 unmarried partners , (7,507 opposite-sex unmarried partners ), 32,593 children (30,087 natural , 893 adopted , 1,613 stepchildren ), 2,875 grandchildren , 2,292 brothers or sisters , 1,884 parents , 53 foster children , 867 other relatives , 9,627 non-relatives In group quarters: 9,055
Size of family households: 20,900 2-persons , 8,210 3-persons , 3,989 4-persons , 2,444 5-persons , 537 6-persons , 597 7-or-more-persons .
Size of nonfamily households: 30,380 1-person , 8,336 2-persons , 888 3-persons , 997 4-persons .
12,552 married couples with children. single-parent households (2,464 men , 10,752 women ).
94.0% of residents of Springfield speak English at home. of residents speak Spanish at home (73% speak English very well , 14% speak English well , 11% speak English not well , 2% don't speak English at all ).of residents speak other Indo-European language at home (80% speak English very well , 13% speak English well , 7% speak English not well ).of residents speak Asian or Pacific Island language at home (43% speak English very well , 42% speak English well , 15% speak English not well ).of residents speak other language at home (75% speak English very well , 20% speak English well , 4% speak English not well , 1% don't speak English at all ).
Foreign born population: 8,921 (5.2%)of them are naturalized citizens )
Median number of rooms in houses and condos:
Median number of rooms in apartments
Owner-occupied Renter-occupied
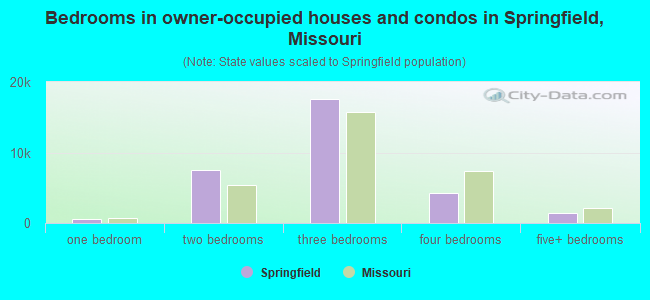
Bedrooms in owner-occupied houses and condos in Springfield, Missouri
41 no bedroom 596 1 bedroom 7,505 2 bedrooms 17,586 3 bedrooms 4,303 4 bedrooms 1,433 5+ bedrooms
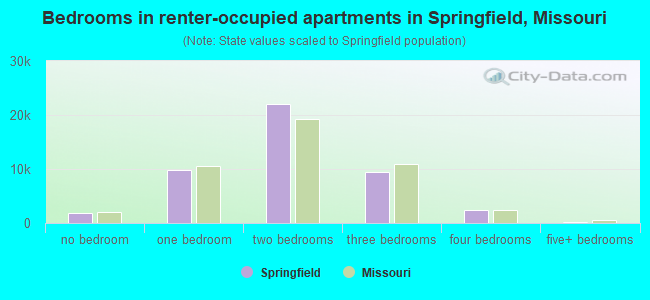
Bedrooms in renter-occupied apartments in Springfield, Missouri
1,792 no bedroom 9,730 1 bedroom 22,022 2 bedrooms 9,517 3 bedrooms 2,482 4 bedrooms 271 5+ bedrooms
Owner-occupied Renter-occupied
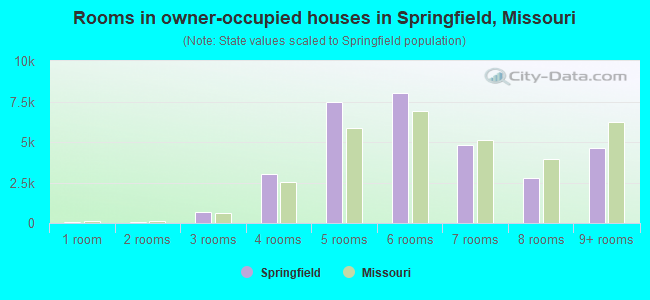
Rooms in owner-occupied houses in Springfield, Missouri
41 1 room 81 2 rooms 677 3 rooms 3,004 4 rooms 7,475 5 rooms 8,001 6 rooms 4,797 7 rooms 2,754 8 rooms 4,634 9+ rooms
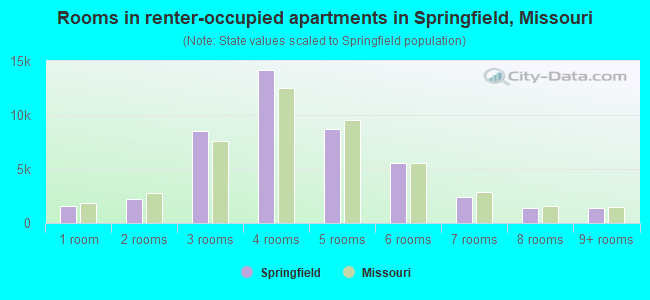
Rooms in renter-occupied apartments in Springfield, Missouri
1,616 1 room 2,190 2 rooms 8,500 3 rooms 14,134 4 rooms 8,705 5 rooms 5,533 6 rooms 2,390 7 rooms 1,373 8 rooms 1,373 9+ rooms
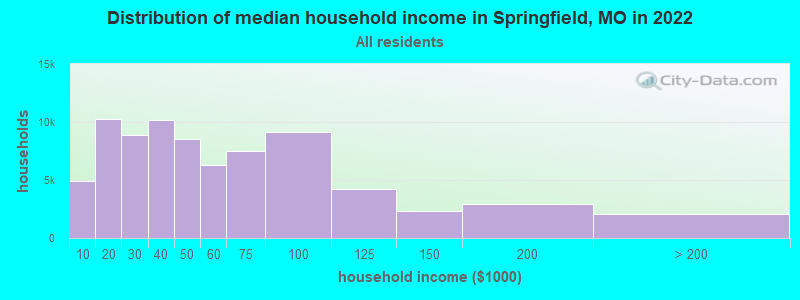
Springfield, MO household income distribution 4,872 Less than $10,00010,284 $10,000 to $19,9998,859 $20,000 to $29,99910,186 $30,000 to $39,9998,526 $40,000 to $49,9996,296 $50,000 to $59,9997,504 $60,000 to $74,9999,174 $75,000 to $99,9994,240 $100,000 to $124,9992,354 $125,000 to $149,9992,957 $150,000 to $199,9992,026 $200,000 or more
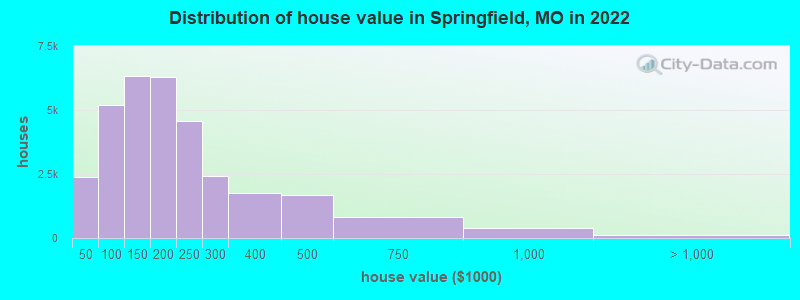
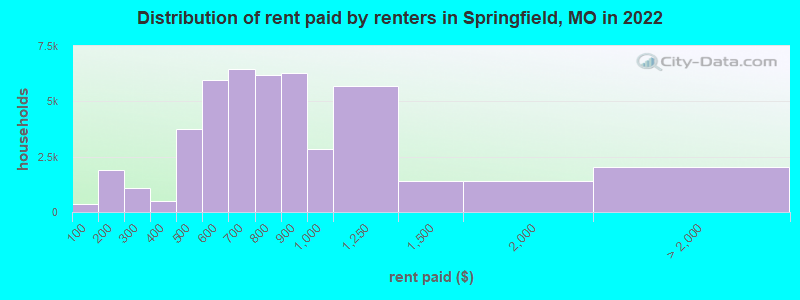
Home value of owner - occupied houses in 2022 in Springfield, MO 336 Less than $10,000715 $10,000 to $14,999412 $15,000 to $19,999209 $20,000 to $24,99946 $25,000 to $29,999137 $30,000 to $34,99946 $35,000 to $39,999469 $40,000 to $49,999804 $50,000 to $59,999511 $60,000 to $69,999535 $70,000 to $79,9991,406 $80,000 to $89,9991,476 $90,000 to $99,9993,219 $100,000 to $124,9993,090 $125,000 to $149,9993,535 $150,000 to $174,9992,757 $175,000 to $199,9994,561 $200,000 to $249,9992,439 $250,000 to $299,9991,767 $300,000 to $399,9991,667 $400,000 to $499,999831 $500,000 to $749,999376 $750,000 to $999,999120 $1,000,000 to $1,499,999Rent paid by renters in 2022 in Springfield, MO 354 Less than $100443 $100 to $1491,447 $150 to $199416 $200 to $249648 $250 to $299326 $300 to $349151 $350 to $3991,684 $400 to $4492,082 $450 to $4992,017 $500 to $5493,944 $550 to $5992,894 $600 to $6493,574 $650 to $6992,984 $700 to $7493,215 $750 to $7996,295 $800 to $8992,833 $900 to $9995,708 $1,000 to $1,2491,398 $1,250 to $1,4991,379 $1,500 to $1,999148 $2,000 to $2,49974 $2,500 to $2,999278 $3,500 or more1,522 No cash rent
Percentage of workers working in this county: 93.2%Number of people working at home: 8,821 (10.8% of all workers )
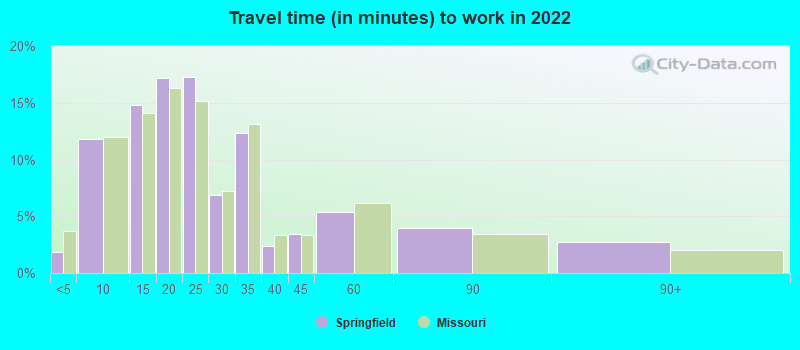
Travel time to work (commute)
Less than 5 minutes: 2,1865 to 9 minutes: 14,20510 to 14 minutes: 14,36415 to 19 minutes: 17,56320 to 24 minutes: 11,34125 to 29 minutes: 3,37230 to 34 minutes: 4,67735 to 39 minutes: 6940 to 44 minutes: 80045 to 59 minutes: 1,56260 to 89 minutes: 1,23090 or more minutes: 1,613
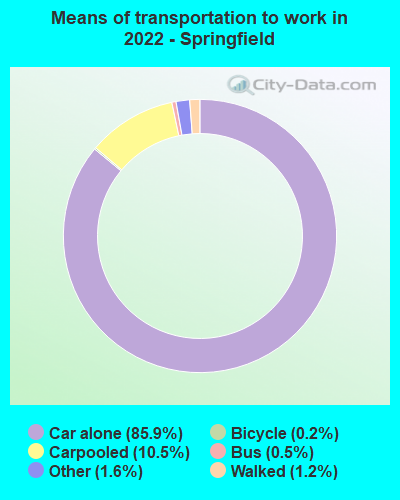
Means of transportation to work:
Drove a car alone: 123,571 (81.0%)Carpooled: 15,086 (9.9%)Bus : 752 (0.5%)Ferryboat: 38 (0.0%)Taxi: 2,293 (1.5%)Bicycle: 307 (0.2%)Walked: 1,736 (1.1%)Worked at home: 8,821 (5.8%)
Unemployment by race in 2022
Unemployment rate for White non-Hispanic residents 4.5% Males3.3% FemalesUnemployment rate for Black residents 6.0% Males11.8% FemalesUnemployment rate for Asian residents 5.8% Males8.0% FemalesUnemployment rate for two or more race residents 4.3% Males5.7% FemalesUnemployment rate for Hispanic or Latino residents 3.9% Males2.3% Females
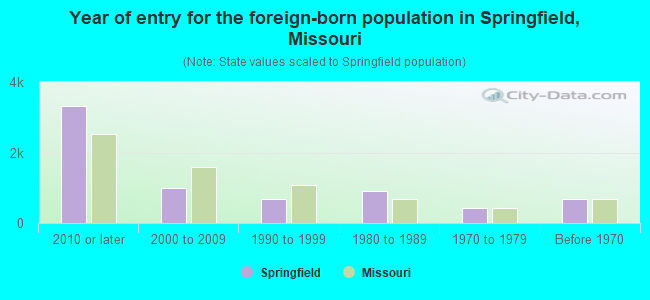
Year of entry for the foreign-born population in Springfield, Missouri
3,319 2010 or later 992 2000 to 2009 688 1990 to 1999 897 1980 to 1989 420 1970 to 1979 684 Before 1970
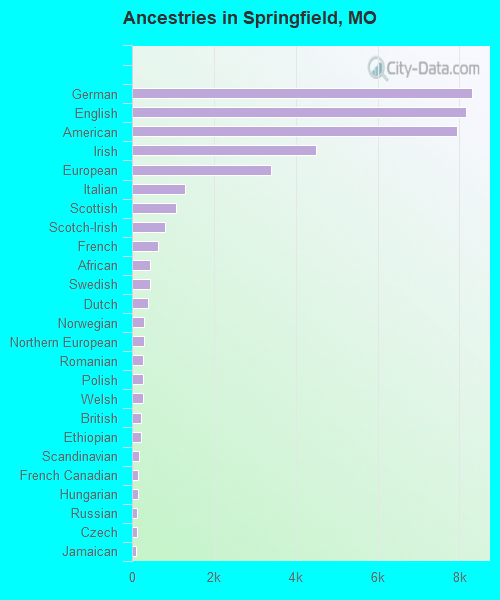
First ancestries reported:
German: 8,308 (10.7%)
English: 8,159 (10.5%)
American: 7,953 (10.2%)
Irish: 4,504 (5.8%)
European: 3,403 (4.4%)
Italian: 1,301 (1.7%)
Scottish: 1,075 (1.4%)
Scotch-Irish: 798 (1.0%)
French: 633 (0.8%)
African: 438 (0.6%)
Swedish: 429 (0.6%)
Dutch: 400 (0.5%)
Norwegian: 305 (0.4%)
Northern European: 288 (0.4%)
Romanian: 268 (0.3%)
Polish: 265 (0.3%)
Welsh: 265 (0.3%)
British: 218 (0.3%)
Ethiopian: 216 (0.3%)
Scandinavian: 171 (0.2%)
French Canadian: 143 (0.2%)
Hungarian: 138 (0.2%)
Russian: 134 (0.2%)
Czech: 117 (0.2%)
Jamaican: 106 (0.1%)
Kenyan: 98 (0.1%)
Nigerian: 96 (0.1%)
Bulgarian: 93 (0.1%)
Danish: 89 (0.1%)
Yugoslavian: 82 (0.1%)
Ukrainian: 79 (0.1%)
Eastern European: 78 (0.1%)
Arab: 71 (0.09%)
Lithuanian: 68 (0.09%)
South African: 63 (0.08%)
Lebanese: 61 (0.08%)
Greek: 56 (0.07%)
Canadian: 54 (0.07%)
Ghanaian: 52 (0.07%)
Austrian: 49 (0.06%)
Croatian: 44 (0.06%)
New Zealander: 40 (0.05%)
Portuguese: 35 (0.05%)
Swiss: 33 (0.04%)
Albanian: 33 (0.04%)
Brazilian: 31 (0.04%)
Icelander: 31 (0.04%)
Czechoslovakian: 30 (0.04%)
Slovak: 24 (0.03%)
Haitian: 21 (0.03%)
Iraqi: 15 (0.02%)
Egyptian: 15 (0.02%)
Ugandan: 14 (0.02%)
Australian: 10 (0.01%)
Finnish: 8 (0.01%)
Celtic: 7 (0.01%)
Pennsylvania German: 6 (0.01%)
Iranian: 5 (0.01%)
Armenian: 4 (0.01%)
Most common places of birth for foreign-born residents (%): Mexico Springfield:
10.7% (635)Missouri:
14.9% (38,568)
China, excluding Hong Kong and Taiwan Springfield:
9.3% (553)Missouri:
6.6% (17,002)
Philippines Springfield:
9.3% (551)Missouri:
4.2% (10,873)
Korea Springfield:
7.5% (444)Missouri:
2.9% (7,525)
Kuwait Springfield:
4.6% (274)Missouri:
0.2% (406)
Germany Springfield:
4.2% (250)Missouri:
3.0% (7,803)
Romania Springfield:
4.1% (242)Missouri:
0.6% (1,481)
Nigeria Springfield:
4.1% (241)Missouri:
1.4% (3,640)
Saudi Arabia Springfield:
3.5% (210)Missouri:
0.5% (1,233)
India Springfield:
3.3% (195)Missouri:
8.9% (22,932)
Vietnam Springfield:
3.1% (185)Missouri:
4.1% (10,700)
Kenya Springfield:
2.8% (167)Missouri:
1.7% (4,518)
Canada Springfield:
2.8% (166)Missouri:
1.9% (4,806)
Ukraine Springfield:
2.6% (156)Missouri:
1.1% (2,895)
Thailand Springfield:
2.4% (145)Missouri:
1.0% (2,597)
Cambodia Springfield:
2.4% (145)Missouri:
0.3% (764)
Russia Springfield:
1.9% (112)Missouri:
1.5% (3,767)
El Salvador Springfield:
1.6% (96)Missouri:
1.5% (3,926)
Cuba Springfield:
1.5% (89)Missouri:
1.1% (2,867)
Place of birth for U.S.-born residents:
This state: 98,113Other state: 61,332Northeast: 4,512Midwest: 21,800South: 21,192West: 13,828 78.1% of Springfield residents lived in the same house 1 years ago.
Out of people who lived in different houses, 32.4% lived in this county.
Out of people who lived in different counties, 51.9% lived in Missouri.
Springfield:
78.1%State average:
87.1%
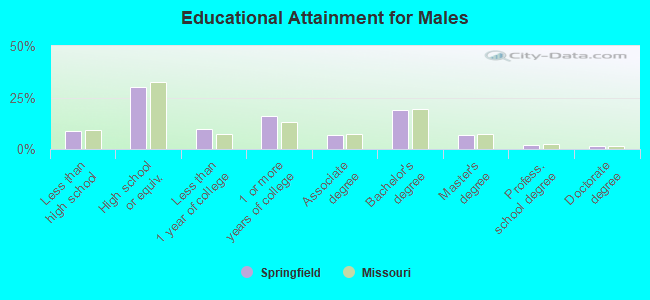
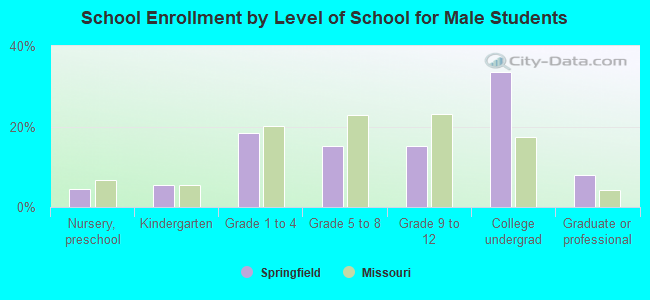
Education attainment for males 25 years and older:
No schooling: 568Nursery to 4th grade: 05th and 6th grade: 1317th and 8th grade: 5499th grade: 67310th grade: 1,04311th grade: 96812th grade, no diploma: 649High school graduate (or equivalency): 16,024Less than 1 year of college: 5,081Some college more than 1 year, no degree: 8,464Associate degree: 3,753Bachelor's degree: 10,262Master's degree: 3,565Professional school degree: 1,069Doctorate degree: 743
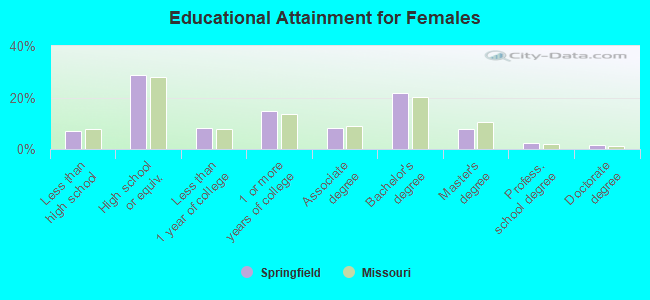
Education attainment for females 25 years and older:
No schooling: 764Nursery to 4th grade: 05th and 6th grade: 1797th and 8th grade: 2069th grade: 48510th grade: 34011th grade: 1,06112th grade, no diploma: 885High school graduate (or equivalency): 16,357Less than 1 year of college: 4,700Some college more than 1 year, no degree: 8,382Associate degree: 4,666Bachelor's degree: 12,315Master's degree: 4,336Professional school degree: 1,268Doctorate degree: 883
Housing units in structures:
One, detached: 48,761One, attached: 2,427Two: 3,2923 or 4: 1,8635 to 9: 4,03110 to 19: 7,88420 to 49: 8,69050 or more: 6,000Mobile homes: 1,208Boats, RVs, vans, etc.: 173Median worth of mobile homes: $12,600
Housing units lacking complete plumbing facilities in 2022: 0.5%Housing units lacking complete kitchen facilities in 2022: 0.9%House/condo owner moved in on average 11 years ago
Renter moved in on average 2 years ago
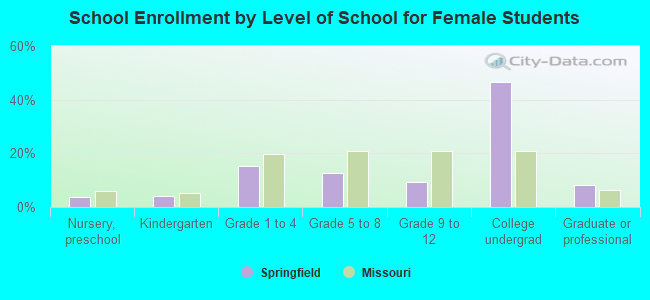
Private vs. public school enrollment:
Students in private schools in grades 1 to 8 (elementary and middle school): 2,029 Students in private schools in grades 9 to 12 (high school): 397 Students in private undergraduate colleges: 2,263