Spokane, WA (Washington) Houses and Residents
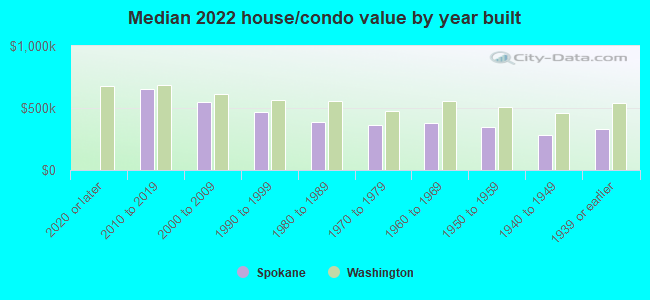
Estimated median house or condo value in 2022: $368,500 (it was $96,100 in 2000 )
Spokane:
$368,500Washington:
$569,500
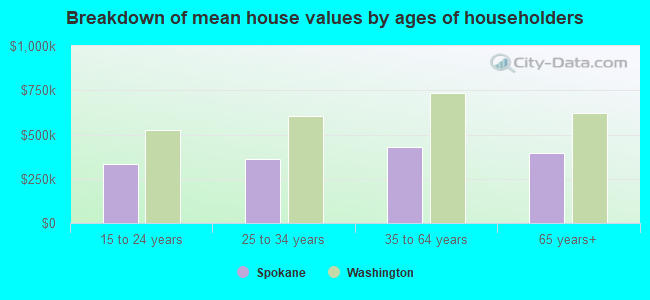
Lower value quartile - upper value quartile: $271,500 - $487,100Mean price in 2022: Detached houses: $415,140 Here:
$415,140State:
$734,307
Townhouses or other attached units: $499,737 Here:
$499,737State:
$657,697
In 2-unit structures: $311,126 Here:
$311,126State:
$534,634
In 3-to-4-unit structures: $385,032 Here:
$385,032State:
$510,239
In 5-or-more-unit structures: $386,557 Here:
$386,557State:
$503,183
Mobile homes: $56,517 Here:
$56,517State:
$218,362
Total population: 212,052 (Urban population: 195,206, Rural population: 937 (54 farm, 883 nonfarm ))
Houses: 105,002 (101,130 occupied: 60,431 owner occupied, 40,699 renter occupied )
% of renters here:
40%State:
36%
Housing density: 1,818 houses/condos per square mile
Median price asked for vacant for-sale houses and condos in 2022: $279,476.
Median contract rent in 2022: $980 (lower quartile is $768, upper quartile is $1,341)
Median rent asked for vacant for-rent units in 2022: $759
Median gross rent in Spokane, WA in 2022: $1,127
Housing units in Spokane with a mortgage: 38,561 (3,587 second mortgage, 415 home equity loan, 3,027 both second mortgage and home equity loan )Houses without a mortgage: 2,011
Median household income for houses/condos with a mortgage: $94,682
Median household income for apartments without a mortgage: $60,857
Median monthly housing costs: $1,164
Data:
Median house or condo value ($)
Median house or condo value ($ change since 2000)
Median house or condo value ($) - White
Median house or condo value ($) - Black or African American
Median house or condo value ($) - Asian
Median house or condo value ($) - Hispanic or Latino
Median house or condo value ($) - American Indian and Alaska Native
Median house or condo value ($) - Multirace
Median house or condo value ($) - Other Race
Median price asked for mobile homes ($)
Household density (households per square mile)
Mean house or condo value by units in structure - 1, detached ($)
Mean house or condo value by units in structure - 1, attached ($)
Mean house or condo value by units in structure - 2 ($)
Mean house or condo value by units in structure by units in structure - 3 or 4 ($)
Mean house or condo value by units in structure - 5 or more ($)
Mean house or condo value by units in structure - Boat, RV, van, etc. ($)
Mean house or condo value by units in structure - Mobile home ($)
Median contract rent ($)
Median contract rent - Lower quartile ($)
Median contract rent - Upper quartile ($)
Median gross rent ($)
Urban houses (%)
Rural houses (%)
Houses occupied (%)
Houses occupied (% change since 2000)
Houses owner occupied (%)
Houses owner occupied (% change since 2000)
Houses renter occupied (%)
Houses renter occupied (% change since 2000)
Vacant housing units - For rent (%)
Vacant housing units - For rent (% change since 2000)
Vacant housing units - For sale only (%)
Vacant housing units - For sale only (% change since 2000)
Vacant housing units - Rented or sold, not occupied (%)
Vacant housing units - Rented or sold, not occupied (% change since 2000)
Vacant housing units - For seasonal, recreational, or occasional use (%)
Vacant housing units - For seasonal, recreational, or occasional use (% change since 2000)
Vacant housing units - For migrant workers (%)
Vacant housing units - For migrant workers (% change since 2000)
Vacant housing units - Other vacant (%)
Vacant housing units - Other vacant (% change since 2000)
Median monthly housing costs ($)
Median household income for houses/condos with a mortgage ($)
Median household income for houses/condos without a mortgage ($)
Median household income ($)
Median household income ($) - White
Median household income ($) - Black or African American
Median household income ($) - Asian
Median household income ($) - Hispanic or Latino
Median household income ($) - American Indian and Alaska Native
Median household income ($) - Multirace
Median household income ($) - Other Race
Mortgage status - with mortgage (%)
Mortgage status - with second mortgage (%)
Mortgage status - with home equity loan (%)
Mortgage status - with both second mortgage and home equity loan (%)
Mortgage status - without a mortgage (%)
Median year house/condo built
Median year apartment built
Household type by relationship - Male householder living alone (%)
Household type by relationship - Male householder not living alone (%)
Household type by relationship - Female householder living alone (%)
Household type by relationship - Female householder not living alone (%)
Household type by relationship - Opposite-Sex spouse (%)
Household type by relationship - Same-Sex spouse (%)
Household type by relationship - Opposite-Sex unmarried partner (%)
Household type by relationship - Same-Sex unmarried partner (%)
Household type by relationship - In group quarters (%)
Size of family households - 2-person household (%)
Size of family households - 3-person household (%)
Size of family households - 4-person household (%)
Size of family households - 5-person household (%)
Size of family households - 6-person household (%)
Size of family households - 7-or-more-person household (%)
Size of nonfamily households - 1-person household (%)
Size of nonfamily households - 2-person household (%)
Size of nonfamily households - 3-person household (%)
Size of nonfamily households - 4-person household (%)
Size of nonfamily households - 5-person household (%)
Size of nonfamily households - 6-person household (%)
Size of nonfamily households - 7-or-moreperson household (%)
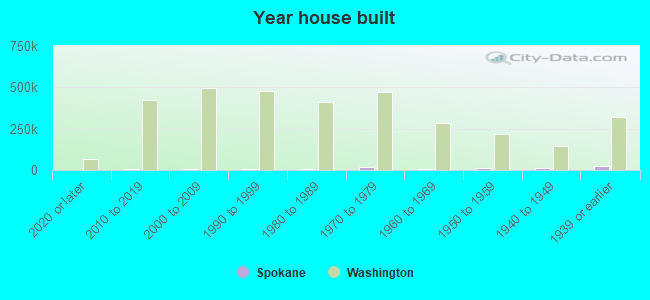
Year house built - Built 2010 or later (%)
Year house built - Built 2000 to 2009 (%)
Year house built - Built 1990 to 1999 (%)
Year house built - Built 1980 to 1989 (%)
Year house built - Built 1970 to 1979 (%)
Year house built - Built 1960 to 1969 (%)
Year house built - Built 1950 to 1959 (%)
Year house built - Built 1940 to 1949 (%)
Year house built - Built 1939 or earlier (%)
Median number of rooms in houses and condos
Median number of rooms in apartments
Median number of bedrooms in owner occupied houses
Mean number of bedrooms in owner occupied houses
Median number of bedrooms in renter occupied houses
Mean number of bedrooms in renter occupied houses
Median number of vehichles in owner occupied houses
Mean number of vehichles in owner occupied houses
Median number of vehichles in renter occupied houses
Mean number of vehichles in renter occupied houses
Rooms in owner-occupied houses - 1 room (%)
Rooms in owner-occupied houses - 2 rooms (%)
Rooms in owner-occupied houses - 3 rooms (%)
Rooms in owner-occupied houses - 4 rooms (%)
Rooms in owner-occupied houses - 5 rooms (%)
Rooms in owner-occupied houses - 6 rooms (%)
Rooms in owner-occupied houses - 7 rooms (%)
Rooms in owner-occupied houses - 8 rooms (%)
Rooms in owner-occupied houses - 9+ rooms (%)
Rooms in renter-occupied houses - 1 room (%)
Rooms in renter-occupied houses - 2 rooms (%)
Rooms in renter-occupied houses - 3 rooms (%)
Rooms in renter-occupied houses - 4 rooms (%)
Rooms in renter-occupied houses - 5 rooms (%)
Rooms in renter-occupied houses - 6 rooms (%)
Rooms in renter-occupied houses - 7 rooms (%)
Rooms in renter-occupied houses - 8 rooms (%)
Rooms in renter-occupied houses - 9+ rooms (%)
Bedrooms in owner-occupied houses - no bedrooms (%)
Bedrooms in owner-occupied houses - 1 bedroom (%)
Bedrooms in owner-occupied houses - 2 bedrooms (%)
Bedrooms in owner-occupied houses - 3 bedrooms (%)
Bedrooms in owner-occupied houses - 4 bedrooms (%)
Bedrooms in owner-occupied houses - 5+ bedrooms (%)
Bedrooms in renter-occupied houses - no bedrooms (%)
Bedrooms in renter-occupied houses - 1 bedroom (%)
Bedrooms in renter-occupied houses - 2 bedrooms (%)
Bedrooms in renter-occupied houses - 3 bedrooms (%)
Bedrooms in renter-occupied houses - 4 bedrooms (%)
Bedrooms in renter-occupied houses - 5+ bedrooms (%)
Vehicles available in owner-occupied houses - no vehicle available (%)
Vehicles available in owner-occupied houses - 1 vehicle available(%)
Vehicles available in owner-occupied houses - 2 Vehicles available (%)
Vehicles available in owner-occupied houses - 3 Vehicles available (%)
Vehicles available in owner-occupied houses - 4 Vehicles available (%)
Vehicles available in owner-occupied houses - 5+ Vehicles available (%)
Vehicles available in renter-occupied houses - no vehicle available (%)
Vehicles available in renter-occupied houses - 1 vehicle available (%)
Vehicles available in renter-occupied houses - 2 Vehicles available (%)
Vehicles available in renter-occupied houses - 3 Vehicles available (%)
Vehicles available in renter-occupied houses - 4 Vehicles available (%)
Vehicles available in renter-occupied houses - 5+ Vehicles available (%)
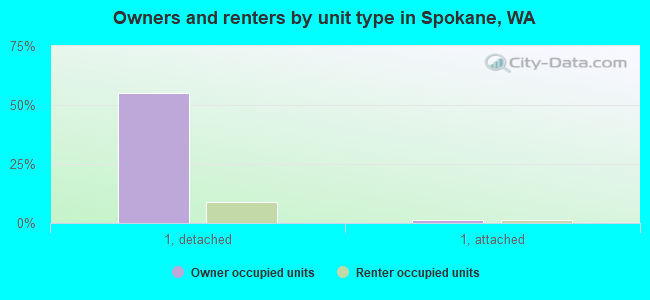
Housing units in structures - 1, detached (%)
Housing units in structures - 1, attached (%)
Housing units in structures - 2 (%)
Housing units in structures - 3 or 4 (%)
Housing units in structures - 5 to 9 (%)
Housing units in structures - 10 to 19 (%)
Housing units in structures - 20 to 49 (%)
Housing units in structures - 50 or more (%)
Housing units in structures - Mobile home (%)
Housing units in structures - Boat, RV, van, etc. (%)
Housing units in structures - Owners - 1, detached (%)
Housing units in structures - Owners - 1, attached (%)
Housing units in structures - Owners - 2 (%)
Housing units in structures - Owners - 3 or 4 (%)
Housing units in structures - Owners - 5 to 9 (%)
Housing units in structures - Owners - 10 to 19 (%)
Housing units in structures - Owners - 20 to 49 (%)
Housing units in structures - Owners - 50 or more (%)
Housing units in structures - Owners - Mobile home (%)
Housing units in structures - Owners - Boat, RV, van, etc. (%)
Housing units in structures - Renters - 1, detached (%)
Housing units in structures - Renters - 1, attached (%)
Housing units in structures - Renters - 2 (%)
Housing units in structures - Renters - 3 or 4 (%)
Housing units in structures - Renters - 5 to 9 (%)
Housing units in structures - Renters - 10 to 19 (%)
Housing units in structures - Renters - 20 to 49 (%)
Housing units in structures - Renters - 50 or more (%)
Housing units in structures - Renters - Mobile home (%)
Housing units in structures - Renters - Boat, RV, van, etc. (%)
House/condo owner moved in on average (years ago)
Renter moved in on average (years ago)
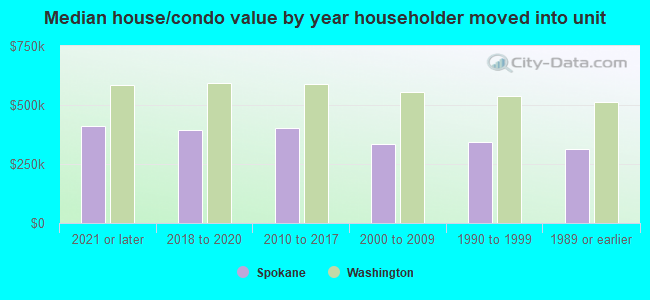
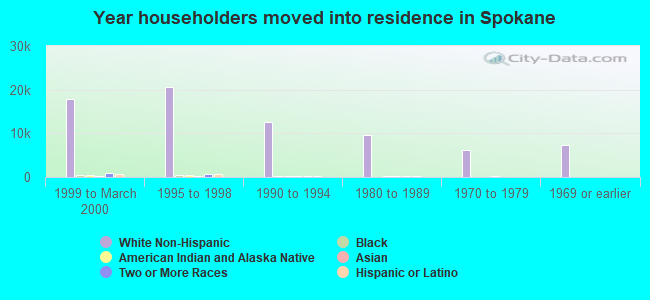
Year householder moved into unit - Moved in 1999 to March 2000 (%)
Year householder moved into unit - Moved in 1999 to March 2000 (%) - White
Year householder moved into unit - Moved in 1999 to March 2000 (%) - Black or African American
Year householder moved into unit - Moved in 1999 to March 2000 (%) - Asian
Year householder moved into unit - Moved in 1999 to March 2000 (%) - Hispanic or Latino
Year householder moved into unit - Moved in 1999 to March 2000 (%) - American Indian and Alaska Native
Year householder moved into unit - Moved in 1999 to March 2000 (%) - Multirace
Year householder moved into unit - Moved in 1999 to March 2000 (%) - Other Race
Year householder moved into unit - Moved in 1995 to 1998 (%)
Year householder moved into unit - Moved in 1995 to 1998 (%) - White
Year householder moved into unit - Moved in 1995 to 1998 (%) - Black or African American
Year householder moved into unit - Moved in 1995 to 1998 (%) - Asian
Year householder moved into unit - Moved in 1995 to 1998 (%) - Hispanic or Latino
Year householder moved into unit - Moved in 1995 to 1998 (%) - American Indian and Alaska Native
Year householder moved into unit - Moved in 1995 to 1998 (%) - Multirace
Year householder moved into unit - Moved in 1995 to 1998 (%) - Other Race
Year householder moved into unit - Moved in 1990 to 1994 (%)
Year householder moved into unit - Moved in 1990 to 1994 (%) - White
Year householder moved into unit - Moved in 1990 to 1994 (%) - Black or African American
Year householder moved into unit - Moved in 1990 to 1994 (%) - Asian
Year householder moved into unit - Moved in 1990 to 1994 (%) - Hispanic or Latino
Year householder moved into unit - Moved in 1990 to 1994 (%) - American Indian and Alaska Native
Year householder moved into unit - Moved in 1990 to 1994 (%) - Multirace
Year householder moved into unit - Moved in 1990 to 1994 (%) - Other Race
Year householder moved into unit - Moved in 1980 to 1989 (%)
Year householder moved into unit - Moved in 1980 to 1989 (%) - White
Year householder moved into unit - Moved in 1980 to 1989 (%) - Black or African American
Year householder moved into unit - Moved in 1980 to 1989 (%) - Asian
Year householder moved into unit - Moved in 1980 to 1989 (%) - Hispanic or Latino
Year householder moved into unit - Moved in 1980 to 1989 (%) - American Indian and Alaska Native
Year householder moved into unit - Moved in 1980 to 1989 (%) - Multirace
Year householder moved into unit - Moved in 1980 to 1989 (%) - Other Race
Year householder moved into unit - Moved in 1970 to 1979 (%)
Year householder moved into unit - Moved in 1970 to 1979 (%) - White
Year householder moved into unit - Moved in 1970 to 1979 (%) - Black or African American
Year householder moved into unit - Moved in 1970 to 1979 (%) - Asian
Year householder moved into unit - Moved in 1970 to 1979 (%) - Hispanic or Latino
Year householder moved into unit - Moved in 1970 to 1979 (%) - American Indian and Alaska Native
Year householder moved into unit - Moved in 1970 to 1979 (%) - Multirace
Year householder moved into unit - Moved in 1970 to 1979 (%) - Other Race
Year householder moved into unit - Moved in 1969 or earlier (%)
Year householder moved into unit - Moved in 1969 or earlier (%) - White
Year householder moved into unit - Moved in 1969 or earlier (%) - Black or African American
Year householder moved into unit - Moved in 1969 or earlier (%) - Asian
Year householder moved into unit - Moved in 1969 or earlier (%) - Hispanic or Latino
Year householder moved into unit - Moved in 1969 or earlier (%) - American Indian and Alaska Native
Year householder moved into unit - Moved in 1969 or earlier (%) - Multirace
Year householder moved into unit - Moved in 1969 or earlier (%) - Other Race
Housing units lacking complete plumbing facilities (%)
Housing units lacking complete kitchen facilities (%)
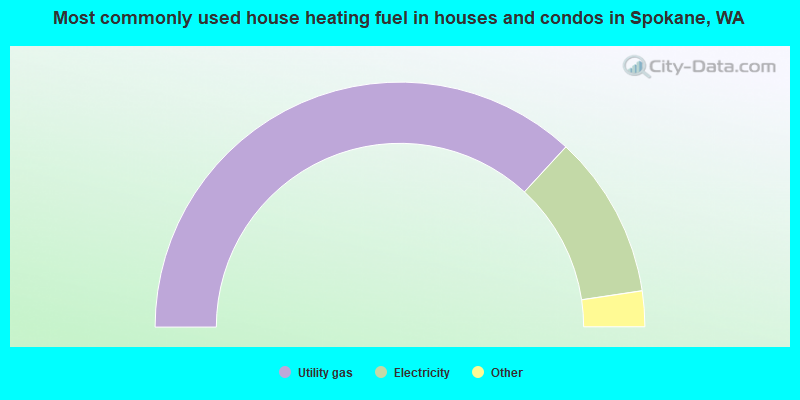
House heating fuel used in houses and condos - Utility gas (%)
House heating fuel used in houses and condos - Bottled, tank, or LP gas (%)
House heating fuel used in houses and condos - Electricity (%)
House heating fuel used in houses and condos - Fuel oil, kerosene, etc. (%)
House heating fuel used in houses and condos - Coal or coke (%)
House heating fuel used in houses and condos - Wood (%)
House heating fuel used in houses and condos - Solar energy (%)
House heating fuel used in houses and condos - Other fuel (%)
House heating fuel used in houses and condos - No fuel used (%)
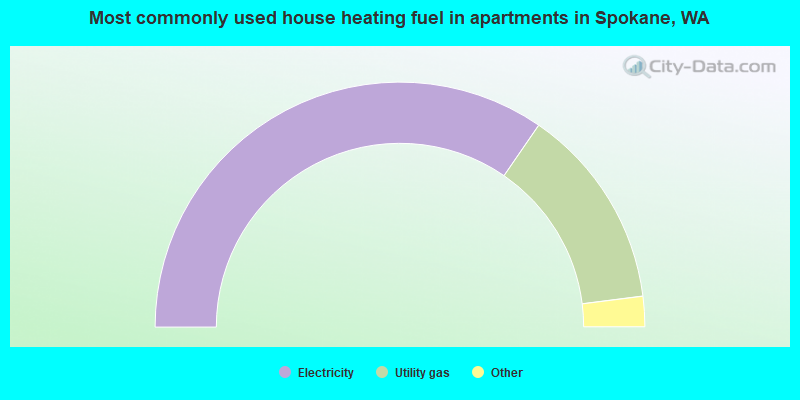
House heating fuel used in apartments - Utility gas (%)
House heating fuel used in apartments - Bottled, tank, or LP gas (%)
House heating fuel used in apartments - Electricity (%)
House heating fuel used in apartments - Fuel oil, kerosene, etc. (%)
House heating fuel used in apartments - Coal or coke (%)
House heating fuel used in apartments - Wood (%)
House heating fuel used in apartments - Solar energy (%)
House heating fuel used in apartments - Other fuel (%)
House heating fuel used in apartments - No fuel used (%)
Latest news about housing in Spokane, WA collected exclusively by city-data.com from local newspapers, TV, and radio stations
Median year house/condo built: 1956Median year apartment built: 1975Household type by relationship:
Households: 230,176
Male householders: 48,361 (19,581 living alone ), Female householders: 52,769 (19,449 living alone )36,737 spouses (35,668 opposite-sex spouses ), 7,882 unmarried partners , (7,565 opposite-sex unmarried partners ), 54,413 children (48,239 natural , 1,978 adopted , 4,196 stepchildren ), 3,592 grandchildren , 4,935 brothers or sisters , 3,879 parents , 119 foster children , 2,028 other relatives , 9,211 non-relatives In group quarters: 6,250
Size of family households: 23,889 2-persons , 14,936 3-persons , 8,742 4-persons , 3,598 5-persons , 1,709 6-persons , 859 7-or-more-persons .
Size of nonfamily households: 39,030 1-person , 7,073 2-persons , 733 3-persons , 337 4-persons , 197 5-persons , 27 6-persons .
25,723 married couples with children. single-parent households (4,113 men , 9,535 women ).
91.1% of residents of Spokane speak English at home. of residents speak Spanish at home (72% speak English very well , 16% speak English well , 11% speak English not well , 1% don't speak English at all ).of residents speak other Indo-European language at home (63% speak English very well , 17% speak English well , 16% speak English not well , 4% don't speak English at all ).of residents speak Asian or Pacific Island language at home (47% speak English very well , 32% speak English well , 19% speak English not well , 1% don't speak English at all ).of residents speak other language at home (56% speak English very well , 19% speak English well , 16% speak English not well , 8% don't speak English at all ).
Foreign born population: 11,409 (5.0%)of them are naturalized citizens )
Median number of rooms in houses and condos:
Median number of rooms in apartments
Owner-occupied Renter-occupied
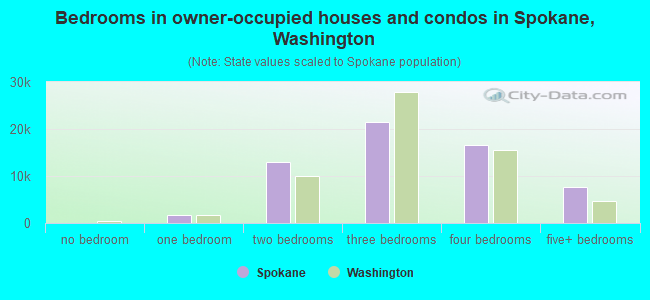
Bedrooms in owner-occupied houses and condos in Spokane, Washington
51 no bedroom 1,688 1 bedroom 12,919 2 bedrooms 21,587 3 bedrooms 16,608 4 bedrooms 7,578 5+ bedrooms
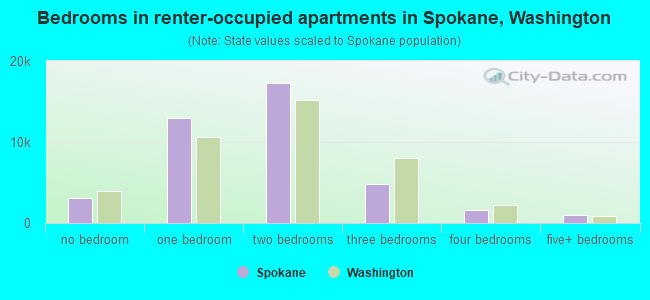
Bedrooms in renter-occupied apartments in Spokane, Washington
3,091 no bedroom 12,934 1 bedroom 17,322 2 bedrooms 4,771 3 bedrooms 1,604 4 bedrooms 977 5+ bedrooms
Owner-occupied Renter-occupied
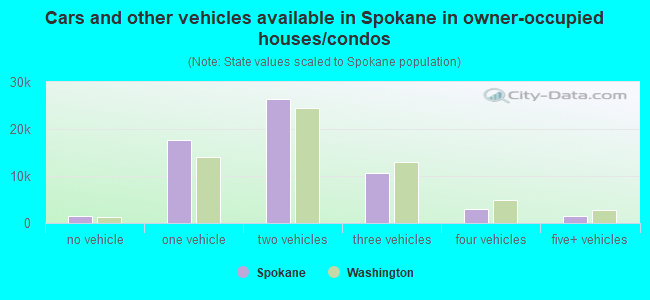
Cars and other vehicles available in Spokane in owner-occupied houses/condos
1,410 no vehicle 17,671 1 vehicle 26,282 2 vehicles 10,669 3 vehicles 2,969 4 vehicles 1,430 5+ vehicles
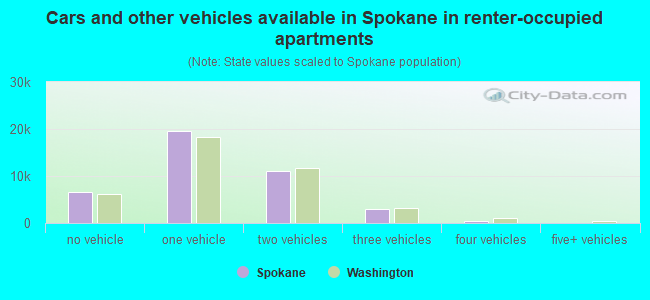
Cars and other vehicles available in Spokane in renter-occupied apartments
6,580 no vehicle 19,669 1 vehicle 10,961 2 vehicles 2,983 3 vehicles 404 4 vehicles 102 5+ vehicles
Owner-occupied Renter-occupied
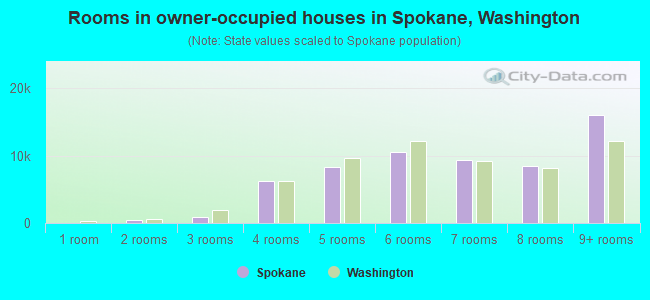
Rooms in owner-occupied houses in Spokane, Washington
51 1 room 410 2 rooms 876 3 rooms 6,291 4 rooms 8,275 5 rooms 10,605 6 rooms 9,414 7 rooms 8,471 8 rooms 16,038 9+ rooms
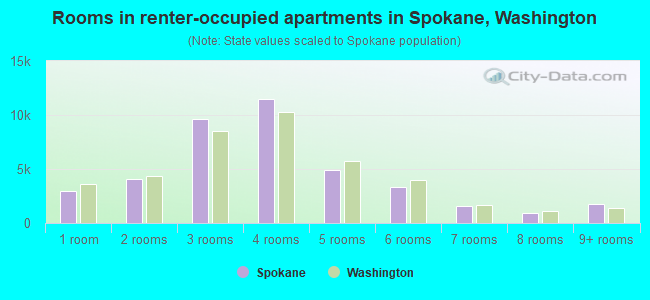
Rooms in renter-occupied apartments in Spokane, Washington
2,946 1 room 4,101 2 rooms 9,660 3 rooms 11,509 4 rooms 4,912 5 rooms 3,375 6 rooms 1,537 7 rooms 900 8 rooms 1,759 9+ rooms
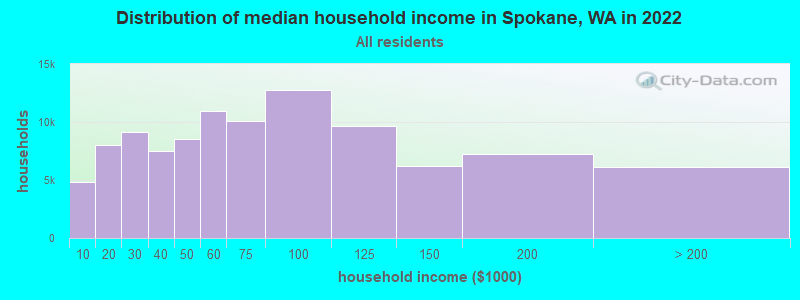
Spokane, WA household income distribution 4,858 Less than $10,0008,031 $10,000 to $19,9999,131 $20,000 to $29,9997,475 $30,000 to $39,9998,573 $40,000 to $49,99910,951 $50,000 to $59,99910,119 $60,000 to $74,99912,758 $75,000 to $99,9999,627 $100,000 to $124,9996,199 $125,000 to $149,9997,274 $150,000 to $199,9996,134 $200,000 or more
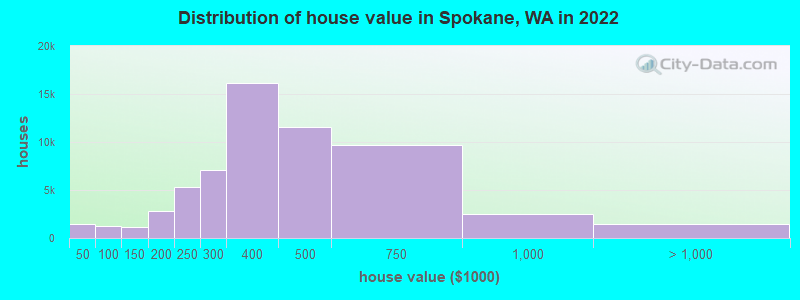
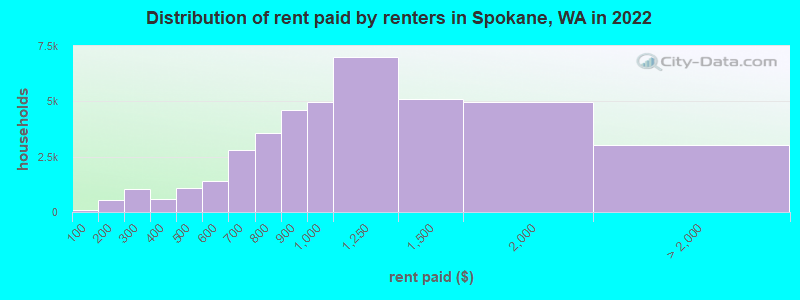
Home value of owner - occupied houses in 2022 in Spokane, WA 475 Less than $10,00034 $10,000 to $14,999365 $15,000 to $19,999199 $20,000 to $24,999103 $25,000 to $29,999205 $30,000 to $34,999100 $35,000 to $39,999144 $50,000 to $59,999110 $60,000 to $69,999379 $70,000 to $79,999485 $80,000 to $89,999160 $90,000 to $99,999618 $100,000 to $124,999572 $125,000 to $149,9991,848 $150,000 to $174,999960 $175,000 to $199,9995,293 $200,000 to $249,9997,124 $250,000 to $299,99916,113 $300,000 to $399,99911,520 $400,000 to $499,9999,683 $500,000 to $749,9992,514 $750,000 to $999,999869 $1,000,000 to $1,499,999307 $1,500,000 to $1,999,999251 $2,000,000 or moreRent paid by renters in 2022 in Spokane, WA 107 Less than $100525 $150 to $199632 $200 to $249399 $250 to $299571 $300 to $349519 $400 to $449580 $450 to $499720 $500 to $549669 $550 to $5991,372 $600 to $6491,409 $650 to $6991,639 $700 to $7491,926 $750 to $7994,604 $800 to $8994,973 $900 to $9996,990 $1,000 to $1,2495,092 $1,250 to $1,4994,948 $1,500 to $1,9991,018 $2,000 to $2,499202 $2,500 to $2,999422 $3,500 or more1,382 No cash rent
Percentage of workers working in this county: 97.0%Number of people working at home: 20,443 (17.9% of all workers )
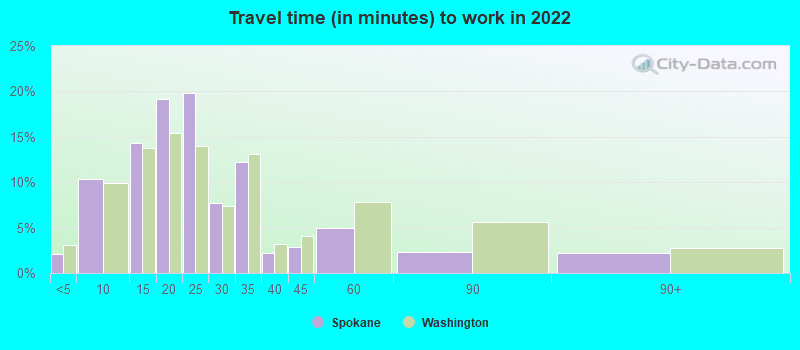
Travel time to work (commute)
Less than 5 minutes: 1,7925 to 9 minutes: 11,00010 to 14 minutes: 16,62815 to 19 minutes: 19,55420 to 24 minutes: 17,99225 to 29 minutes: 6,95130 to 34 minutes: 10,33735 to 39 minutes: 1,33340 to 44 minutes: 1,74545 to 59 minutes: 2,57860 to 89 minutes: 2,55690 or more minutes: 1,555
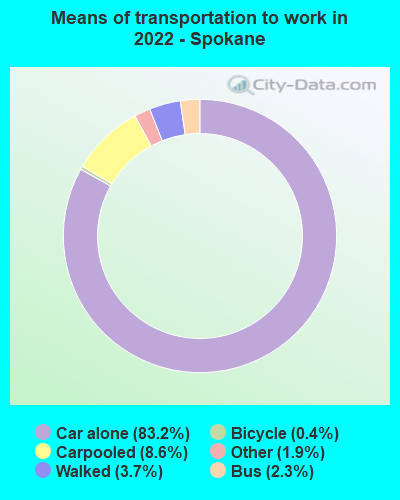
Means of transportation to work:
Drove a car alone: 103,699 (71.5%)Carpooled: 10,668 (7.4%)Bus : 2,911 (2.0%)Taxi: 2,322 (1.6%)Bicycle: 465 (0.3%)Walked: 4,559 (3.1%)Worked at home: 20,443 (14.1%)
Unemployment by race in 2022
Unemployment rate for White non-Hispanic residents 4.6% Males3.5% FemalesUnemployment rate for Black residents 19.1% Males13.0% FemalesUnemployment rate for American Indian and Alaska Native residents 19.7% Males15.3% FemalesUnemployment rate for Asian residents 5.0% Males3.8% FemalesUnemployment rate for other race residents 2.8% Males0.3% FemalesUnemployment rate for two or more race residents 7.5% Males2.8% FemalesUnemployment rate for Hispanic or Latino residents 8.7% Males2.5% Females
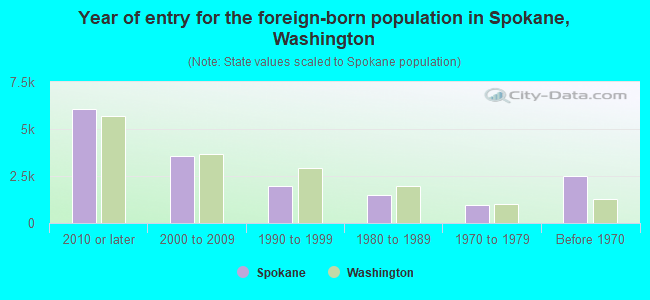
Year of entry for the foreign-born population in Spokane, Washington
6,077 2010 or later 3,540 2000 to 2009 1,987 1990 to 1999 1,475 1980 to 1989 984 1970 to 1979 2,510 Before 1970
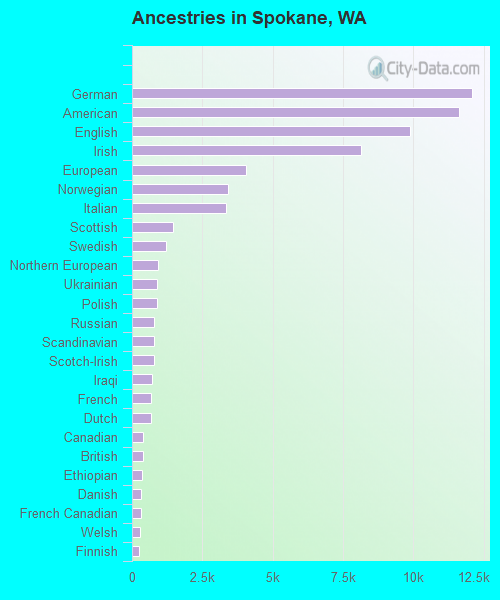
First ancestries reported:
German: 12,087 (12.7%)
American: 11,642 (12.3%)
English: 9,868 (10.4%)
Irish: 8,158 (8.6%)
European: 4,049 (4.3%)
Norwegian: 3,417 (3.6%)
Italian: 3,324 (3.5%)
Scottish: 1,470 (1.5%)
Swedish: 1,219 (1.3%)
Northern European: 913 (1.0%)
Ukrainian: 881 (0.9%)
Polish: 875 (0.9%)
Russian: 790 (0.8%)
Scandinavian: 786 (0.8%)
Scotch-Irish: 779 (0.8%)
Iraqi: 700 (0.7%)
French: 673 (0.7%)
Dutch: 664 (0.7%)
Canadian: 394 (0.4%)
British: 379 (0.4%)
Ethiopian: 368 (0.4%)
Danish: 313 (0.3%)
French Canadian: 310 (0.3%)
Welsh: 274 (0.3%)
Finnish: 265 (0.3%)
Romanian: 234 (0.2%)
Hungarian: 212 (0.2%)
African: 189 (0.2%)
Greek: 186 (0.2%)
Czech: 176 (0.2%)
Austrian: 155 (0.2%)
Swiss: 148 (0.2%)
Macedonian: 136 (0.1%)
Turkish: 127 (0.1%)
Yugoslavian: 114 (0.1%)
Portuguese: 113 (0.1%)
Eastern European: 103 (0.1%)
Brazilian: 100 (0.1%)
Jamaican: 99 (0.1%)
Slovene: 96 (0.1%)
Ugandan: 96 (0.1%)
Afghan: 91 (0.10%)
Icelander: 76 (0.08%)
Croatian: 72 (0.08%)
Nigerian: 70 (0.07%)
Lithuanian: 70 (0.07%)
Syrian: 65 (0.07%)
Iranian: 44 (0.05%)
Czechoslovakian: 41 (0.04%)
Armenian: 38 (0.04%)
Arab: 28 (0.03%)
Ghanaian: 25 (0.03%)
Basque: 25 (0.03%)
British West Indian: 25 (0.03%)
Belgian: 25 (0.03%)
Slovak: 23 (0.02%)
Slavic: 22 (0.02%)
German Russian: 17 (0.02%)
Kenyan: 17 (0.02%)
Sudanese: 16 (0.02%)
Celtic: 12 (0.01%)
Luxembourger: 9 (0.01%)
Bahamian: 8 (0.01%)
Serbian: 7 (0.01%)
Bulgarian: 5 (0.01%)
Most common places of birth for foreign-born residents (%): Iraq Spokane:
11.3% (1,545)Washington:
0.5% (6,259)
Mexico Spokane:
7.6% (1,043)Washington:
21.1% (241,655)
Vietnam Spokane:
5.5% (758)Washington:
5.4% (62,003)
Ukraine Spokane:
5.2% (714)Washington:
3.1% (35,872)
Canada Spokane:
5.1% (696)Washington:
4.1% (47,238)
Marshall Islands Spokane:
4.6% (625)Washington:
0.3% (3,048)
Philippines Spokane:
4.5% (622)Washington:
6.3% (71,661)
Russia Spokane:
4.3% (595)Washington:
1.9% (21,540)
Thailand Spokane:
4.0% (542)Washington:
0.9% (9,937)
China, excluding Hong Kong and Taiwan Spokane:
3.5% (483)Washington:
7.4% (84,470)
Burma (Myanmar) Spokane:
3.1% (427)Washington:
0.3% (3,171)
Germany Spokane:
2.8% (384)Washington:
1.6% (17,761)
India Spokane:
2.7% (374)Washington:
8.9% (101,353)
Ethiopia Spokane:
2.2% (304)Washington:
1.6% (17,938)
Micronesia Spokane:
1.9% (259)Washington:
0.4% (4,144)
Korea Spokane:
1.8% (246)Washington:
4.3% (48,886)
Other South Central Asia Spokane:
1.7% (230)Washington:
0.1% (1,712)
Moldova Spokane:
1.5% (207)Washington:
0.4% (4,536)
Place of birth for U.S.-born residents:
This state: 128,325Other state: 87,776Northeast: 6,233Midwest: 14,168South: 13,647West: 53,728 86.6% of Spokane residents lived in the same house 1 years ago.
Out of people who lived in different houses, 37.5% lived in this county.
Out of people who lived in different counties, 49.9% lived in Washington.
Spokane:
86.6%State average:
85.2%
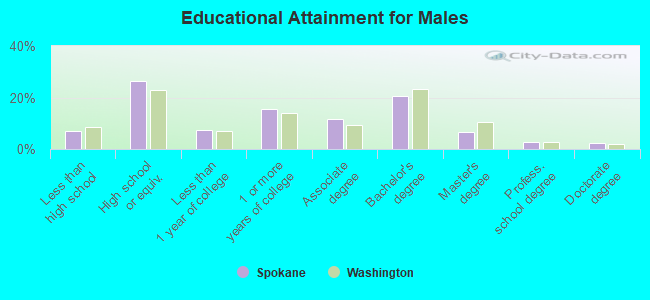
Education attainment for males 25 years and older:
No schooling: 789Nursery to 4th grade: 995th and 6th grade: 2667th and 8th grade: 4399th grade: 63210th grade: 66811th grade: 94812th grade, no diploma: 1,861High school graduate (or equivalency): 21,350Less than 1 year of college: 5,890Some college more than 1 year, no degree: 12,590Associate degree: 9,335Bachelor's degree: 16,750Master's degree: 5,450Professional school degree: 2,286Doctorate degree: 1,863
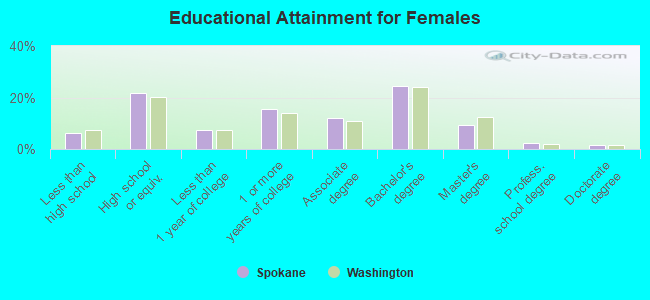
Education attainment for females 25 years and older:
No schooling: 1,071Nursery to 4th grade: 935th and 6th grade: 487th and 8th grade: 4739th grade: 28510th grade: 58211th grade: 1,43012th grade, no diploma: 1,128High school graduate (or equivalency): 17,987Less than 1 year of college: 6,013Some college more than 1 year, no degree: 12,859Associate degree: 9,842Bachelor's degree: 20,304Master's degree: 7,680Professional school degree: 1,905Doctorate degree: 1,140
Housing units in structures:
One, detached: 66,553One, attached: 2,833Two: 3,7123 or 4: 3,5845 to 9: 5,95010 to 19: 7,41320 to 49: 5,96750 or more: 7,610Mobile homes: 1,380Median worth of mobile homes: $71,992
Housing units lacking complete plumbing facilities in 2022: 0.3%Housing units lacking complete kitchen facilities in 2022: 1.0%House/condo owner moved in on average 9 years ago
Renter moved in on average 3 years ago
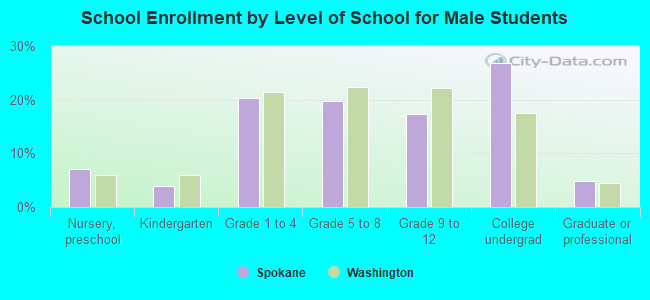
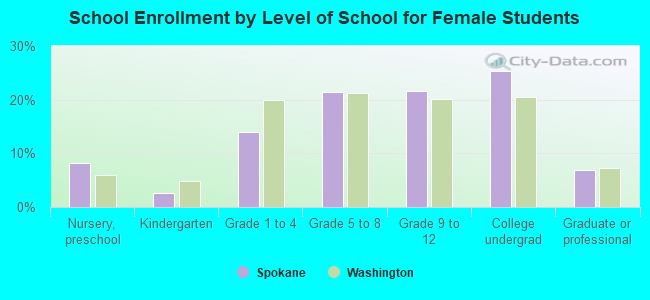
Private vs. public school enrollment:
Students in private schools in grades 1 to 8 (elementary and middle school): 3,005 Here:
15.0%Washington:
12.4%
Students in private schools in grades 9 to 12 (high school): 1,417 Here:
13.8%Washington:
9.2%
Students in private undergraduate colleges: 3,705 Here:
26.7%Washington:
16.5%