Spartanburg, SC (South Carolina) Houses and Residents
| Spartanburg: | $194,916 |
| South Carolina: | $254,600 |
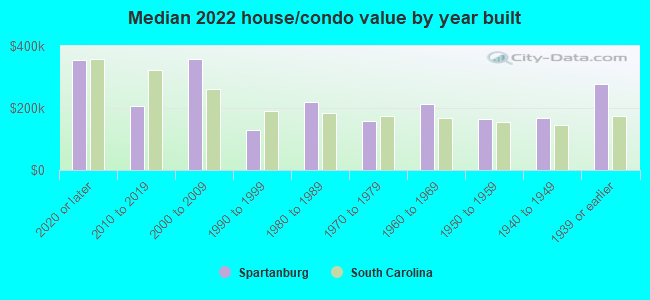
Mean price in 2022:
Detached houses: $264,710
Here: $264,710 State: $368,255 Townhouses or other attached units: $320,902
Here: $320,902 State: $292,023 In 2-unit structures: $150,900
Here: $150,900 State: $358,283 In 3-to-4-unit structures: $72,876
Here: $72,876 State: $230,702 In 5-or-more-unit structures: $207,985
Here: $207,985 State: $326,361 Mobile homes: $59,199
Here: $59,199 State: $102,531
Total population: 37,525 (All urban)
Houses: 18,191 (16,340 occupied: 8,755 owner occupied, 7,778 renter occupied)
| % of renters here: | 47% |
| State: | 28% |
Housing density: 950 houses/condos per square mile
Median price asked for vacant for-sale houses and condos in 2022: $133,869.
Median contract rent in 2022: $818 (lower quartile is $569, upper quartile is $1,044)
Median rent asked for vacant for-rent units in 2022: $838
Median gross rent in Spartanburg, SC in 2022: $1,020
Housing units in Spartanburg with a mortgage: 4,816 (428 second mortgage, 19 home equity loan, 331 both second mortgage and home equity loan)
Houses without a mortgage: 115
Median household income for houses/condos with a mortgage: $80,368
Median household income for apartments without a mortgage: $49,634
Median monthly housing costs: $904
Compare current foreclosures in Spartanburg, SC:
| Photo | Address | Area | Beds / Baths | Price | Details |
|---|---|---|---|---|---|

|
#1
Jewell Rd
Spartanburg, SC 29302
|
1,560 sq. feet
|
1 baths 3 beds |
show details | |

|
#2
Marconi Dr
Spartanburg, SC 29303
|
2,413 sq. feet
|
2 baths 5 beds |
show details | |

|
#3
Hillcrest Blvd
Spartanburg, SC 29307
|
1,156 sq. feet
|
1 baths 3 beds |
show details | |

|
#4
E Fremont Ave
Spartanburg, SC 29303
|
1,537 sq. feet
|
2 baths 3 beds |
show details | |

|
#5
Dogwood Ave
Spartanburg, SC 29302
|
2,069 sq. feet
|
2 baths 4 beds |
show details | |

|
#6
Plainview Drive Ext
Spartanburg, SC 29307
|
2,000 sq. feet
|
1 baths 3 beds |
show details | |

|
#7
Hidden Hill Rd
Spartanburg, SC 29301
|
1,998 sq. feet
|
2 baths 4 beds |
show details | |

|
#8
Camelot Dr
Spartanburg, SC 29301
|
1,942 sq. feet
|
2 baths 3 beds |
show details | |

|
#9
Bud Arthur Bridge Rd
Spartanburg, SC 29307
|
1,152 sq. feet
|
2 baths 3 beds |
show details | |

|
#10
Limestone Dr
Spartanburg, SC 29306
|
1,511 sq. feet
|
1 baths 3 beds |
show details |
| Photo | Address | Area | Beds / Baths | Price | Details |
|---|---|---|---|---|---|

|
#11
Southview Ave
Spartanburg, SC 29302
|
1,417 sq. feet
|
2 baths 3 beds |
show details | |

|
#12
Roswell Ter
Spartanburg, SC 29307
|
2,358 sq. feet
|
3 baths 4 beds |
show details | |

|
#13
Deer Springs Rd
Spartanburg, SC 29302
|
2,016 sq. feet
|
2 baths 3 beds |
show details | |

|
#14
Convair Dr
Spartanburg, SC 29301
|
2,071 sq. feet
|
2 baths 4 beds |
show details | |

|
#15
Kelly Rd
Spartanburg, SC 29307
|
1,188 sq. feet
|
1 baths 2 beds |
show details | |

|
#16
Longbow Dr
Spartanburg, SC 29302
|
1,627 sq. feet
|
1 baths 3 beds |
show details | |

|
#17
Maywood St
Spartanburg, SC 29303
|
650 sq. feet
|
1 baths 2 beds |
show details | |

|
#18
Southview Ave
Spartanburg, SC 29302
|
1,600 sq. feet
|
2 baths 3 beds |
show details | |

|
#19
New Faith Ct
Spartanburg, SC 29301
|
1,066 sq. feet
|
1 baths 3 beds |
show details | |

|
#20
Keltner Ave
Spartanburg, SC 29302
|
1,372 sq. feet
|
1 baths 3 beds |
show details |
| Photo | Address | Area | Beds / Baths | Price | Details |
|---|---|---|---|---|---|

|
#21
Camelot Dr
Spartanburg, SC 29301
|
1,624 sq. feet
|
2 baths 3 beds |
show details | |

|
#22
Lone Oak Rd
Spartanburg, SC 29303
|
1,092 sq. feet
|
1 baths 3 beds |
show details | |

|
#23
Elmwood Dr
Spartanburg, SC 29303
|
1,862 sq. feet
|
2 baths 3 beds |
show details | |

|
#24
Terrell St
Spartanburg, SC 29301
|
1,695 sq. feet
|
2 baths 3 beds |
show details | |

|
#25
Anderson Mill Rd
Spartanburg, SC 29301
|
1,112 sq. feet
|
1 baths 3 beds |
show details | |

|
#26
Wildmere Way
Spartanburg, SC 29301
|
1,344 sq. feet
|
1 baths 3 beds |
show details | |

|
#27
N Lanford Rd
Spartanburg, SC 29301
|
1,527 sq. feet
|
2 baths 3 beds |
show details | |

|
#28
Woodhaven Dr
Spartanburg, SC 29307
|
1,324 sq. feet
|
1 baths 3 beds |
show details | |

|
#29
Sunridge Ct
Spartanburg, SC 29302
|
1,340 sq. feet
|
2 baths 3 beds |
show details | |

|
#30
Washington Rd
Spartanburg, SC 29302
|
1,632 sq. feet
|
1 baths 3 beds |
show details |
| Photo | Address | Area | Beds / Baths | Price | Details |
|---|---|---|---|---|---|

|
#31
Clifdale Rd
Spartanburg, SC 29307
|
780 sq. feet
|
1 baths 2 beds |
show details | |

|
#32
Stewart St
Spartanburg, SC 29306
|
1,040 sq. feet
|
1 baths 3 beds |
show details | |

|
#33
Bearden Heights Rd
Spartanburg, SC 29306
|
1,904 sq. feet
|
2 baths 3 beds |
show details | |

|
#34
Calhoun Estates Dr
Spartanburg, SC 29307
|
1,152 sq. feet
|
2 baths 3 beds |
show details | |

|
#35
Sunnyview Cir
Spartanburg, SC 29307
|
1,187 sq. feet
|
1 baths 2 beds |
show details | |

|
#36
Lake Forest Dr
Spartanburg, SC 29307
|
3,476 sq. feet
|
3 baths 4 beds |
show details | |

|
#37
W Croft Cir
Spartanburg, SC 29302
|
1,832 sq. feet
|
1 baths 5 beds |
show details | |

|
#38
Hospital St
Spartanburg, SC 29302
|
1,372 sq. feet
|
2 baths 3 beds |
show details | |

|
#39
Bethesda Dr
Spartanburg, SC 29302
|
1,866 sq. feet
|
2 baths 3 beds |
show details | |

|
#40
Marconi Dr
Spartanburg, SC 29303
|
1,624 sq. feet
|
1 baths 4 beds |
show details |
| Photo | Address | Area | Beds / Baths | Price | Details |
|---|---|---|---|---|---|

|
#41
Coromandel Dr
Spartanburg, SC 29301
|
1,892 sq. feet
|
2 baths 3 beds |
show details | |

|
#42
Collins Ave
Spartanburg, SC 29306
|
1,324 sq. feet
|
2 baths 3 beds |
show details | |

|
#43
High St
Spartanburg, SC 29306
|
1,152 sq. feet
|
1 baths 3 beds |
show details | |

|
#44
N Townes Ct
Spartanburg, SC 29301
|
1,452 sq. feet
|
2 baths 3 beds |
show details | |

|
#45
Nebo St
Spartanburg, SC 29302
|
1,792 sq. feet
|
2 baths - beds |
show details | |

|
#46
S Pine St
Spartanburg, SC 29302
|
708 sq. feet
|
1 baths - beds |
show details | |

|
#47
Archer Rd
Spartanburg, SC 29303
|
- sq. feet
|
- baths - beds |
show details | |

|
#48
Grays Creek Rd
Spartanburg, SC 29303
|
- sq. feet
|
- baths - beds |
show details | |

|
#49
W Colony Dr
Spartanburg, SC 29303
|
- sq. feet
|
- baths - beds |
show details | |

|
Check over 1 million property listings on Foreclosure.com!
|
browse all offers | |||

Latest news about housing in Spartanburg, SC collected exclusively by city-data.com from local newspapers, TV, and radio stations


Median year apartment built: 1977
Household type by relationship:
Households: 40,123- Male householders: 6,552 (2,426 living alone), Female householders: 9,776 (3,705 living alone)
5,265 spouses (5,193 opposite-sex spouses), 1,022 unmarried partners, (980 opposite-sex unmarried partners), 11,258 children (10,746 natural, 185 adopted, 326 stepchildren), 1,079 grandchildren, 419 brothers or sisters, 591 parents, 57 foster children, 644 other relatives, 800 non-relatives
- In group quarters: 2,656
Size of family households: 4,409 2-persons, 2,591 3-persons, 1,295 4-persons, 778 5-persons, 187 6-persons, 78 7-or-more-persons.
Size of nonfamily households: 6,565 1-person, 654 2-persons, 151 3-persons.
3,000 married couples with children.
4,320 single-parent households (525 men, 3,795 women).
92.7% of residents of Spartanburg speak English at home.
3.1% of residents speak Spanish at home (53% speak English very well, 16% speak English well, 21% speak English not well, 10% don't speak English at all).
2.9% of residents speak other Indo-European language at home (82% speak English very well, 11% speak English well, 3% speak English not well, 5% don't speak English at all).
1.1% of residents speak Asian or Pacific Island language at home (41% speak English very well, 42% speak English well, 10% speak English not well, 7% don't speak English at all).
0.4% of residents speak other language at home (64% speak English very well, 29% speak English well, 7% speak English not well).
Foreign born population: 2,714 (6.8%)
(46.3% of them are naturalized citizens)
| Here: | 6.5 |
| State: | 6.4 |
| Here: | 4.1 |
| State: | 4.5 |
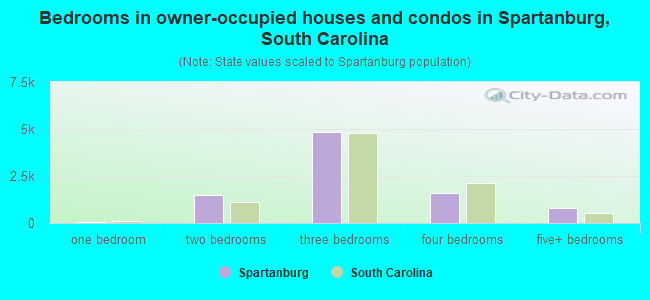
- Bedrooms in owner-occupied houses and condos in Spartanburg, South Carolina
- 0no bedroom
- 271 bedroom
- 1,5042 bedrooms
- 4,8443 bedrooms
- 1,5904 bedrooms
- 7915+ bedrooms
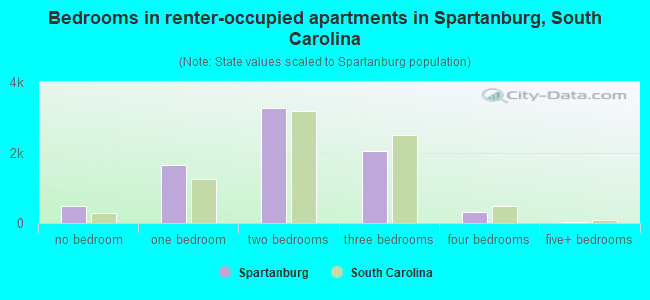
- Bedrooms in renter-occupied apartments in Spartanburg, South Carolina
- 488no bedroom
- 1,6351 bedroom
- 3,2672 bedrooms
- 2,0533 bedrooms
- 3144 bedrooms
- 225+ bedrooms
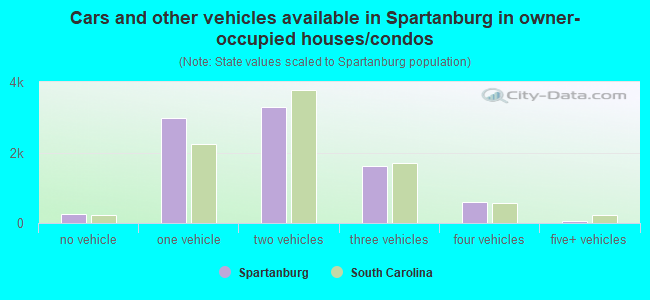
- Cars and other vehicles available in Spartanburg in owner-occupied houses/condos
- 255no vehicle
- 2,9661 vehicle
- 3,2812 vehicles
- 1,6183 vehicles
- 5914 vehicles
- 465+ vehicles
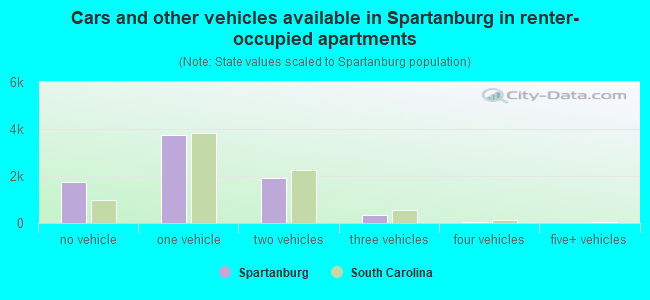
- Cars and other vehicles available in Spartanburg in renter-occupied apartments
- 1,752no vehicle
- 3,7361 vehicle
- 1,9192 vehicles
- 3203 vehicles
- 514 vehicles
- 05+ vehicles
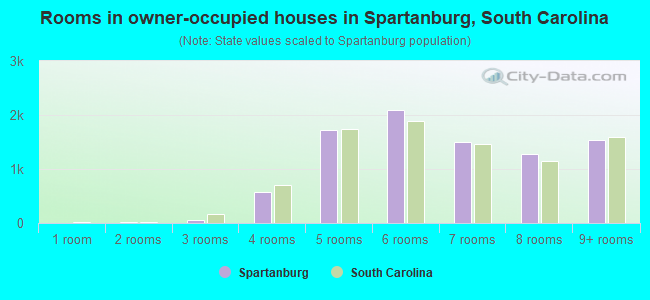
- Rooms in owner-occupied houses in Spartanburg, South Carolina
- 01 room
- 142 rooms
- 573 rooms
- 5664 rooms
- 1,7175 rooms
- 2,0846 rooms
- 1,5067 rooms
- 1,2748 rooms
- 1,5369+ rooms
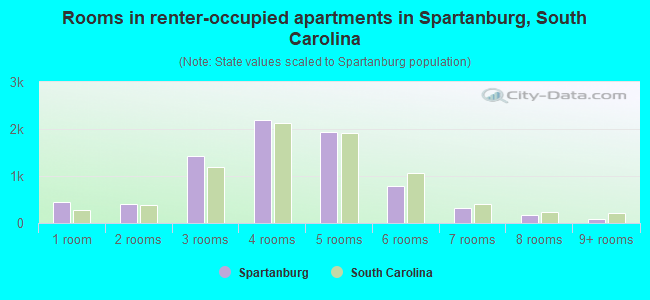
- Rooms in renter-occupied apartments in Spartanburg, South Carolina
- 4491 room
- 4112 rooms
- 1,4343 rooms
- 2,1824 rooms
- 1,9395 rooms
- 7896 rooms
- 3277 rooms
- 1698 rooms
- 809+ rooms
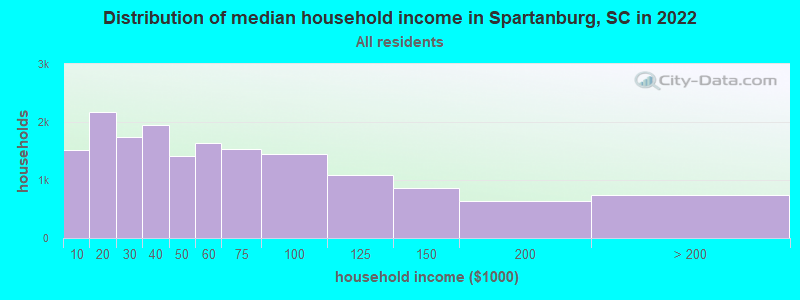
Spartanburg, SC household income distribution

- 1,525Less than $10,000
- 2,170$10,000 to $19,999
- 1,747$20,000 to $29,999
- 1,946$30,000 to $39,999
- 1,418$40,000 to $49,999
- 1,646$50,000 to $59,999
- 1,540$60,000 to $74,999
- 1,446$75,000 to $99,999
- 1,087$100,000 to $124,999
- 865$125,000 to $149,999
- 633$150,000 to $199,999
- 742$200,000 or more
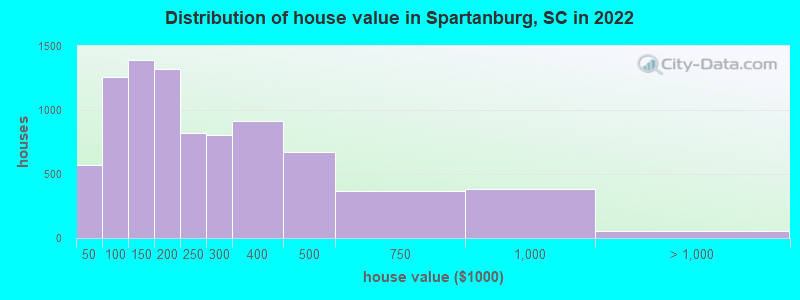
Home value of owner - occupied houses in 2022 in Spartanburg, SC
-
- 24Less than $10,000
- 358$10,000 to $14,999
- 10$15,000 to $19,999
- 24$20,000 to $24,999
- 22$25,000 to $29,999
- 73$30,000 to $34,999
- 5$35,000 to $39,999
- 54$40,000 to $49,999
- 183$50,000 to $59,999
- 305$60,000 to $69,999
- 314$70,000 to $79,999
- 232$80,000 to $89,999
- 168$90,000 to $99,999
- 884$100,000 to $124,999
- 507$125,000 to $149,999
- 924$150,000 to $174,999
- 393$175,000 to $199,999
- 822$200,000 to $249,999
- 803$250,000 to $299,999
- 915$300,000 to $399,999
- 673$400,000 to $499,999
- 366$500,000 to $749,999
- 381$750,000 to $999,999
- 22$1,000,000 to $1,499,999
- 16$1,500,000 to $1,999,999
- 12$2,000,000 or more
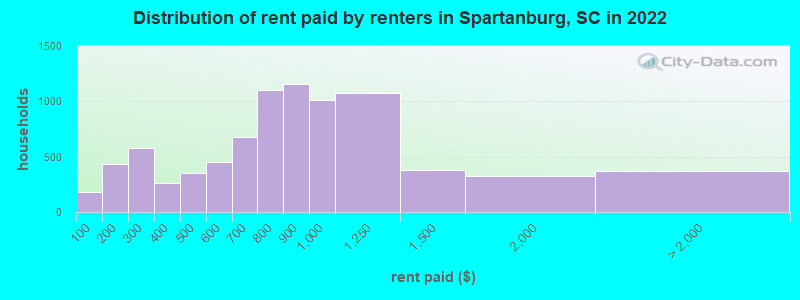
Rent paid by renters in 2022 in Spartanburg, SC
-
- 185Less than $100
- 183$100 to $149
- 246$150 to $199
- 409$200 to $249
- 171$250 to $299
- 131$300 to $349
- 127$350 to $399
- 267$400 to $449
- 87$450 to $499
- 192$500 to $549
- 256$550 to $599
- 283$600 to $649
- 397$650 to $699
- 643$700 to $749
- 454$750 to $799
- 1,156$800 to $899
- 1,009$900 to $999
- 1,074$1,000 to $1,249
- 380$1,250 to $1,499
- 322$1,500 to $1,999
- 93$2,000 to $2,499
- 3$2,500 to $2,999
- 48$3,500 or more
- 221No cash rent
Percentage of workers working in this county: 88.1%
Number of people working at home: 1,140 (6.8% of all workers)
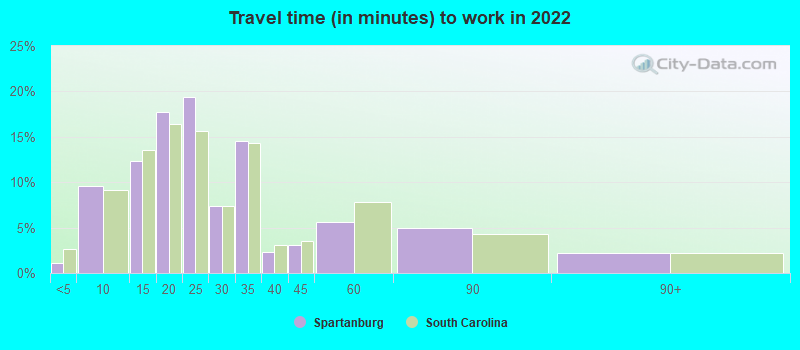
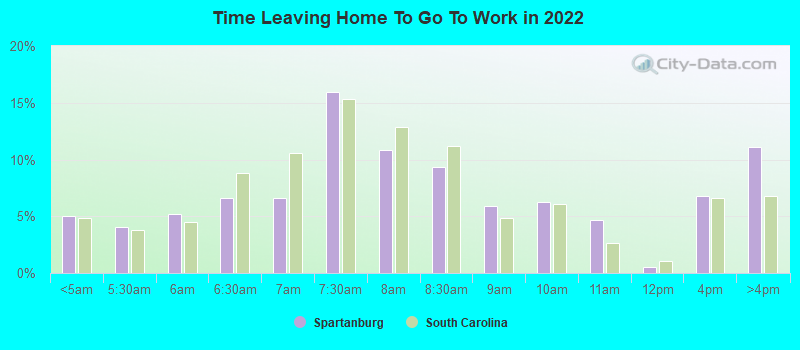
Travel time to work (commute)
- Less than 5 minutes: 285
- 5 to 9 minutes: 2,471
- 10 to 14 minutes: 3,108
- 15 to 19 minutes: 3,068
- 20 to 24 minutes: 2,346
- 25 to 29 minutes: 861
- 30 to 34 minutes: 1,389
- 35 to 39 minutes: 280
- 40 to 44 minutes: 534
- 45 to 59 minutes: 422
- 60 to 89 minutes: 457
- 90 or more minutes: 479
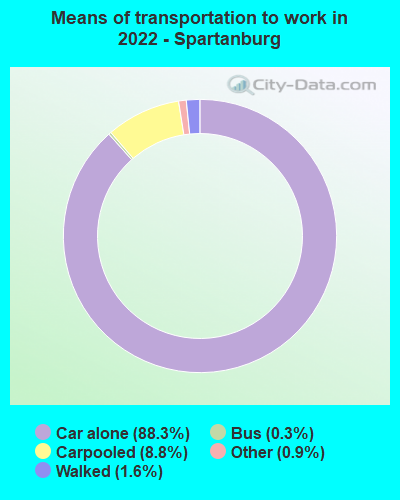
Means of transportation to work:
- Drove a car alone: 37,723 (85.2%)
- Carpooled: 3,758 (8.5%)
- Bus: 221 (0.5%)
- Subway or elevated rail: 3 (0.0%)
- Taxi: 255 (0.6%)
- Bicycle: 35 (0.1%)
- Walked: 308 (0.7%)
- Worked at home: 1,140 (2.6%)
- Unemployment by race in 2022
- Unemployment rate for White non-Hispanic residents
- 4.5%Males
- 5.4%Females
- Unemployment rate for Black residents
- 8.0%Males
- 5.4%Females
- Unemployment rate for Asian residents
- 5.0%Females
- Unemployment rate for two or more race residents
- 7.5%Males
- 10.6%Females
- Unemployment rate for Hispanic or Latino residents
- 11.0%Males
- 2.8%Females
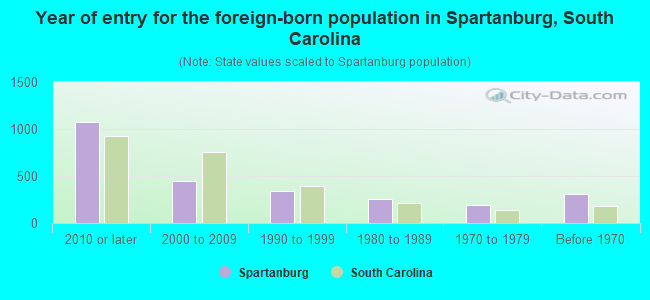
- Year of entry for the foreign-born population in Spartanburg, South Carolina
- 1,0712010 or later
- 4462000 to 2009
- 3391990 to 1999
- 2521980 to 1989
- 1941970 to 1979
- 308Before 1970
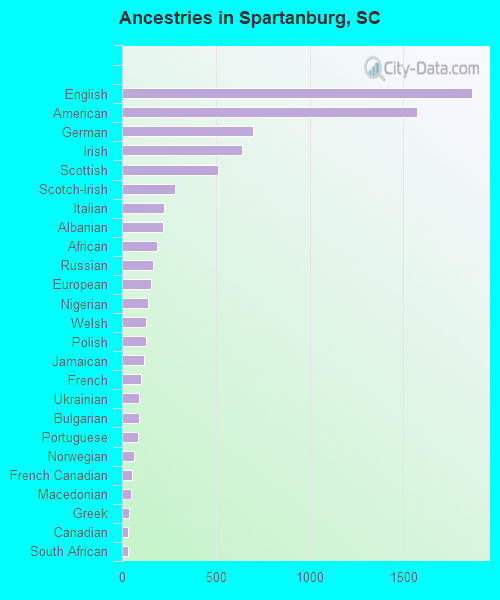
First ancestries reported:
- English: 1,863 (7.7%)
- American: 1,574 (6.5%)
- German: 696 (2.9%)
- Irish: 638 (2.6%)
- Scottish: 512 (2.1%)
- Scotch-Irish: 280 (1.2%)
- Italian: 223 (0.9%)
- Albanian: 221 (0.9%)
- African: 185 (0.8%)
- Russian: 163 (0.7%)
- European: 155 (0.6%)
- Nigerian: 139 (0.6%)
- Welsh: 130 (0.5%)
- Polish: 127 (0.5%)
- Jamaican: 116 (0.5%)
- French: 101 (0.4%)
- Ukrainian: 88 (0.4%)
- Bulgarian: 88 (0.4%)
- Portuguese: 83 (0.3%)
- Norwegian: 64 (0.3%)
- French Canadian: 53 (0.2%)
- Macedonian: 46 (0.2%)
- Greek: 37 (0.2%)
- Canadian: 32 (0.1%)
- South African: 31 (0.1%)
- Swedish: 31 (0.1%)
- British: 27 (0.1%)
- Eastern European: 26 (0.1%)
- Celtic: 21 (0.09%)
- Danish: 18 (0.07%)
- Icelander: 17 (0.07%)
- Northern European: 16 (0.07%)
- Dutch: 16 (0.07%)
- Czech: 14 (0.06%)
- Croatian: 8 (0.03%)
- Hungarian: 7 (0.03%)
- West Indian: 7 (0.03%)
- Lithuanian: 6 (0.02%)
- Haitian: 6 (0.02%)
- Austrian: 5 (0.02%)
- Israeli: 4 (0.02%)
Most common places of birth for foreign-born residents (%):
| Spartanburg: | 14.1% (325) |
| South Carolina: | 6.8% (18,307) |
| Spartanburg: | 10.1% (232) |
| South Carolina: | 4.8% (12,834) |
| Spartanburg: | 10.0% (230) |
| South Carolina: | 22.5% (60,774) |
| Spartanburg: | 9.5% (218) |
| South Carolina: | 0.3% (753) |
| Spartanburg: | 8.0% (184) |
| South Carolina: | 0.6% (1,652) |
| Spartanburg: | 4.6% (107) |
| South Carolina: | 1.4% (3,877) |
| Spartanburg: | 4.1% (94) |
| South Carolina: | 0.4% (1,192) |
| Spartanburg: | 3.5% (80) |
| South Carolina: | 0.2% (566) |
| Spartanburg: | 3.0% (68) |
| South Carolina: | 3.2% (8,721) |
| Spartanburg: | 2.6% (61) |
| South Carolina: | 0.0% (131) |
| Spartanburg: | 2.2% (51) |
| South Carolina: | 4.3% (11,533) |
| Spartanburg: | 2.0% (47) |
| South Carolina: | 2.6% (7,073) |
| Spartanburg: | 2.0% (47) |
| South Carolina: | 2.0% (5,344) |
| Spartanburg: | 1.8% (42) |
| South Carolina: | 1.9% (5,117) |
| Spartanburg: | 1.8% (41) |
| South Carolina: | 3.7% (9,982) |
| Spartanburg: | 1.7% (40) |
| South Carolina: | 0.6% (1,507) |
| Spartanburg: | 1.6% (37) |
| South Carolina: | 0.0% (128) |
| Spartanburg: | 1.6% (37) |
| South Carolina: | 1.3% (3,522) |
Place of birth for U.S.-born residents:
- This state: 25,462
- Other state: 11,370
- Northeast: 2,633
- Midwest: 1,489
- South: 6,053
- West: 990
81.9% of Spartanburg residents lived in the same house 1 years ago.
Out of people who lived in different houses, 35.5% lived in this county.
Out of people who lived in different counties, 60.5% lived in South Carolina.
| Spartanburg: | 81.9% |
| State average: | 86.5% |
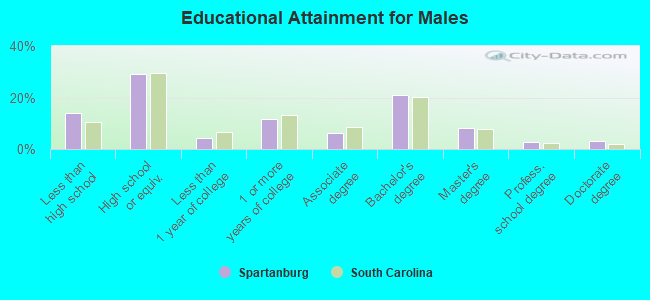
Education attainment for males 25 years and older:
- No schooling: 76
- Nursery to 4th grade: 10
- 5th and 6th grade: 54
- 7th and 8th grade: 241
- 9th grade: 242
- 10th grade: 420
- 11th grade: 260
- 12th grade, no diploma: 263
- High school graduate (or equivalency): 3,318
- Less than 1 year of college: 489
- Some college more than 1 year, no degree: 1,301
- Associate degree: 696
- Bachelor's degree: 2,358
- Master's degree: 929
- Professional school degree: 295
- Doctorate degree: 369
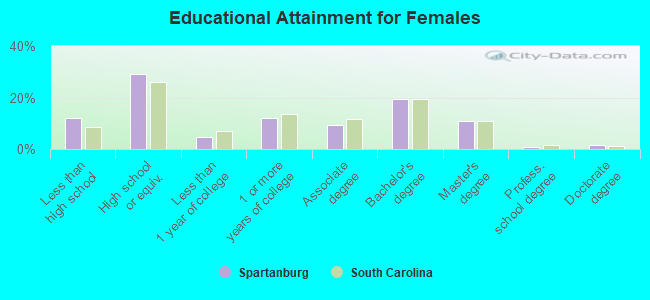
Education attainment for females 25 years and older:
- No schooling: 381
- Nursery to 4th grade: 0
- 5th and 6th grade: 15
- 7th and 8th grade: 98
- 9th grade: 215
- 10th grade: 350
- 11th grade: 411
- 12th grade, no diploma: 316
- High school graduate (or equivalency): 4,307
- Less than 1 year of college: 676
- Some college more than 1 year, no degree: 1,788
- Associate degree: 1,385
- Bachelor's degree: 2,845
- Master's degree: 1,626
- Professional school degree: 99
- Doctorate degree: 211
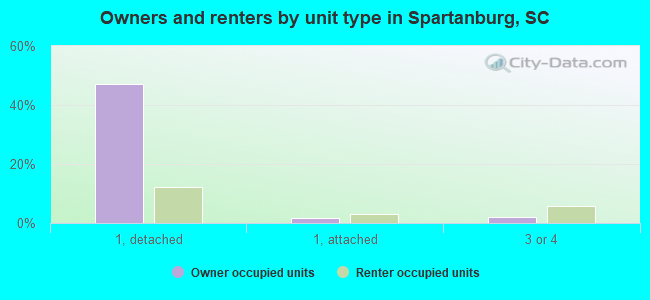
Housing units in structures:
- One, detached: 11,458
- One, attached: 680
- Two: 877
- 3 or 4: 1,274
- 5 to 9: 1,630
- 10 to 19: 852
- 20 to 49: 489
- 50 or more: 730
- Mobile homes: 197
Housing units lacking complete kitchen facilities in 2022: 2.2%
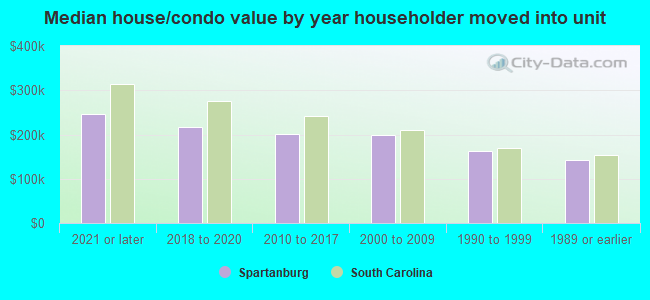
House/condo owner moved in on average 10 years ago
Renter moved in on average 3 years ago
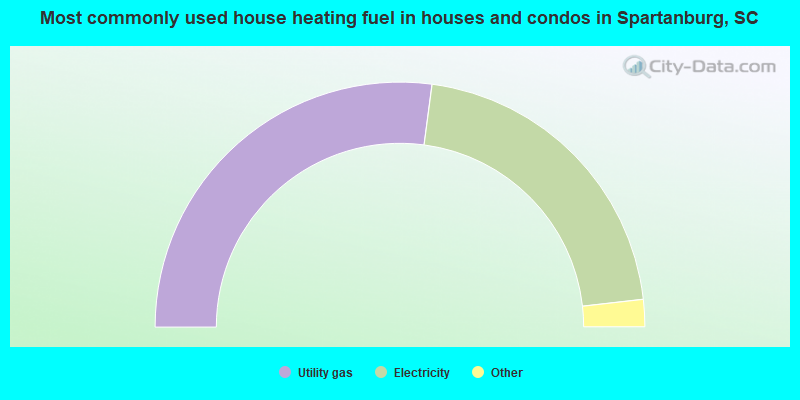
- 54.2%Utility gas
- 42.2%Electricity
- 1.7%Bottled, tank, or LP gas
- 0.8%Fuel oil, kerosene, etc.
- 0.5%Other fuel
- 0.2%Wood
- 0.2%No fuel used
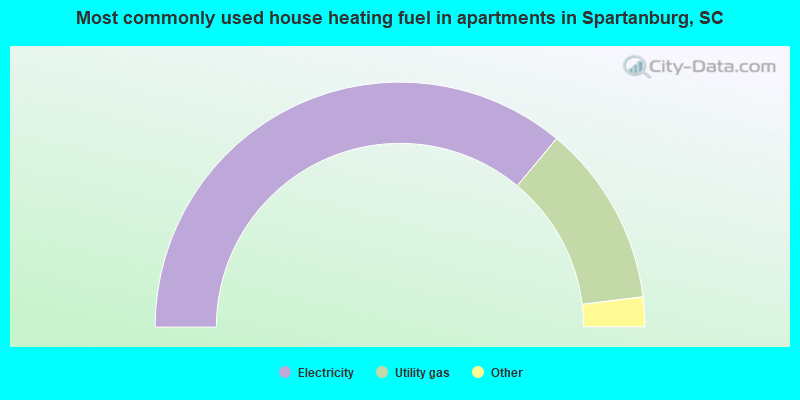
- 72.1%Electricity
- 24.0%Utility gas
- 2.0%Bottled, tank, or LP gas
- 0.7%Fuel oil, kerosene, etc.
- 0.6%Wood
- 0.6%No fuel used
Private vs. public school enrollment:
| Here: | 13.0% |
| South Carolina: | 14.4% |
| Here: | 14.4% |
| South Carolina: | 11.1% |
| Here: | 56.7% |
| South Carolina: | 21.9% |