Southeast Montgomery, TX (Texas) Houses and Residents
| Southeast Montgomery: | $336,866 |
| Texas: | $275,400 |
Total population: 288,750 (Urban population: 152,521 (102,546 inside urbanized areas, 49,975 inside urban clusters), Rural population: 55,555 (599 farm, 54,956 nonfarm))
Houses: 77,705 (72,515 occupied: 53,683 owner occupied, 18,832 renter occupied)
| % of renters here: | 26% |
| State: | 38% |
Housing density: 161 houses/condos per square mile
Median price asked for vacant for-sale houses and condos in 2022 in this county: $450,601.
Median contract rent in 2022: $1,242 (lower quartile is $968, upper quartile is $1,666)
Median rent asked for vacant for-rent units in 2022: $1,428
Median gross rent in Southeast Montgomery, TX in 2022: $1,419
Housing units in Southeast Montgomery with a mortgage: 30,480 (1,550 second mortgage, 1,769 home equity loan, 21 both second mortgage and home equity loan)
Houses without a mortgage: 10,543
Compare current foreclosures near Southeast Montgomery, TX:
| Photo | Address | Area | Beds / Baths | Price | Details |
|---|---|---|---|---|---|

|
#1
Rosegate Dr
Spring, TX 77373
|
1,496 sq. feet
|
2 baths 4 beds |
$219,900
|
show details |

|
#2
Miltonwood Street
Spring, TX 77373
|
2,765 sq. feet
|
3 baths 4 beds |
show details | |

|
#3
Kentwood Springs Dri
Spring, TX 77373
|
- sq. feet
|
3 baths 5 beds |
show details | |

|
#4
Old Maple Ln
Humble, TX 77338
|
2,786 sq. feet
|
2 baths 3 beds |
show details | |

|
#5
Stallion Trail Dr
Humble, TX 77338
|
1,435 sq. feet
|
2 baths 3 beds |
show details | |

|
#6
Springcroft Ct
Tomball, TX 77375
|
3,372 sq. feet
|
3 baths 4 beds |
show details | |

|
#7
Hostler Dr
Tomball, TX 77375
|
2,126 sq. feet
|
2 baths 3 beds |
show details | |

|
#8
Windy Oaks Ct
Porter, TX 77365
|
1,591 sq. feet
|
2 baths 3 beds |
show details | |

|
#9
Summerberry Ln
Tomball, TX 77375
|
1,080 sq. feet
|
2 baths 2 beds |
show details | |

|
#10
Brook Shadow Dr
Humble, TX 77345
|
2,447 sq. feet
|
2 baths 3 beds |
show details |
| Photo | Address | Area | Beds / Baths | Price | Details |
|---|---|---|---|---|---|

|
#11
Gary Ln
Spring, TX 77380
|
1,629 sq. feet
|
2 baths 3 beds |
show details | |

|
#12
Mystic Glen Loop
Humble, TX 77339
|
2,103 sq. feet
|
2 baths 3 beds |
show details | |

|
#13
Sycamore Springs Ct
Humble, TX 77339
|
- sq. feet
|
2 baths 4 beds |
show details | |

|
#14
Linnwood Dr
New Caney, TX 77357
|
1,248 sq. feet
|
1 baths 3 beds |
show details | |

|
#15
Mantana Dr
Spring, TX 77388
|
2,474 sq. feet
|
2 baths 4 beds |
show details | |

|
#16
Shire Trail Ct
Humble, TX 77338
|
2,544 sq. feet
|
3 baths 4 beds |
show details | |

|
#17
Saddlecreek Dr
Houston, TX 77090
|
- sq. feet
|
2 baths 5 beds |
show details | |

|
#18
Spring Creek Ln
Spring, TX 77379
|
3,325 sq. feet
|
3 baths 4 beds |
show details | |

|
#19
Seven Pines Dr
Spring, TX 77379
|
- sq. feet
|
2 baths 3 beds |
show details | |

|
#20
Kate Place Ct
Montgomery, TX 77316
|
- sq. feet
|
3 baths 4 beds |
show details |
| Photo | Address | Area | Beds / Baths | Price | Details |
|---|---|---|---|---|---|

|
#21
Highland Point Ln
Spring, TX 77373
|
1,489 sq. feet
|
3 baths 3 beds |
show details | |

|
#22
Willow Ridge Dr
Humble, TX 77339
|
3,180 sq. feet
|
3 baths 4 beds |
show details | |

|
#23
Santa Elena Cyn
Spring, TX 77388
|
3,264 sq. feet
|
4 baths 5 beds |
show details | |

|
#24
Lamaster Ln
Spring, TX 77373
|
4,212 sq. feet
|
4 baths 6 beds |
show details | |

|
#25
Sweet Melon Dr
Houston, TX 77090
|
1,656 sq. feet
|
2 baths 3 beds |
show details | |

|
#26
Echo Falls Dr
Humble, TX 77345
|
2,273 sq. feet
|
2 baths 3 beds |
show details | |

|
#27
Lotus Blossom Street
Spring, TX 77373
|
3,104 sq. feet
|
2 baths 4 beds |
show details | |

|
#28
Winter Song Dr
Magnolia, TX 77354
|
1,796 sq. feet
|
2 baths 4 beds |
show details | |

|
#29
Chestnut Ridge Rd
Humble, TX 77339
|
1,825 sq. feet
|
2 baths 3 beds |
show details | |

|
#30
Cedar Lane Loop
Willis, TX 77378
|
1,990 sq. feet
|
2 baths 3 beds |
show details |
| Photo | Address | Area | Beds / Baths | Price | Details |
|---|---|---|---|---|---|

|
#31
Ferney Ln
Porter, TX 77365
|
1,120 sq. feet
|
2 baths 4 beds |
show details | |

|
#32
Pine Walk Trl
Spring, TX 77388
|
2,544 sq. feet
|
3 baths 4 beds |
show details | |

|
#33
Sequoia Echo Dr
Spring, TX 77386
|
- sq. feet
|
2 baths 4 beds |
show details | |

|
#34
Firetower Rd
Conroe, TX 77306
|
1,320 sq. feet
|
2 baths 2 beds |
show details | |

|
#35
Harrow Field Lane
Spring, TX 77373
|
- sq. feet
|
2 baths 4 beds |
show details | |

|
#36
Falling Brook Dr
Humble, TX 77345
|
2,373 sq. feet
|
2 baths 4 beds |
show details | |

|
#37
Jelly Pines Drive
Conroe, TX 77302
|
- sq. feet
|
2 baths 4 beds |
show details | |

|
#38
Reedpoint Dr
Houston, TX 77090
|
2,642 sq. feet
|
2 baths 4 beds |
show details | |

|
#39
Summer Pine Dr
Spring, TX 77373
|
914 sq. feet
|
1 baths 2 beds |
show details | |

|
#40
Fox Hall Ln
Humble, TX 77338
|
1,822 sq. feet
|
2 baths 4 beds |
show details |
| Photo | Address | Area | Beds / Baths | Price | Details |
|---|---|---|---|---|---|

|
#41
Linnwood Dr
New Caney, TX 77357
|
2,278 sq. feet
|
2 baths 3 beds |
show details | |

|
#42
Spruce Summit Trail
Spring, TX 77373
|
1,545 sq. feet
|
2 baths 3 beds |
show details | |

|
#43
Cave Springs Dr
Humble, TX 77339
|
2,195 sq. feet
|
2 baths 3 beds |
show details | |

|
#44
Pine Ln
New Caney, TX 77357
|
- sq. feet
|
2 baths 3 beds |
show details | |

|
#45
Opal Stone Ct
Porter, TX 77365
|
3,629 sq. feet
|
3 baths 4 beds |
show details | |

|
#46
Royal Glen Dr
Humble, TX 77339
|
2,165 sq. feet
|
2 baths 4 beds |
show details | |

|
#47
Rollingwood Loop
Conroe, TX 77303
|
- sq. feet
|
1 baths 3 beds |
show details | |

|
#48
Cypress Hill Dr
Spring, TX 77388
|
2,332 sq. feet
|
3 baths 3 beds |
show details | |

|
#49
Valley Ridge Drive
New Caney, TX 77357
|
- sq. feet
|
2 baths 3 beds |
show details | |

|
Check over 1 million property listings on Foreclosure.com!
|
browse all offers | |||

Household type by relationship:
Households: 452,522- In family households: 401,727 (91,212 male householders, 30,260 female householders)
96,727 spouses, 143,703 children (131,397 natural, 3,330 adopted, 8,976 stepchildren), 10,615 grandchildren, 4,232 brothers or sisters, 4,090 parents, foster children, 6,790 other relatives, 10,097 non-relatives
- In nonfamily households: 50,795 (19,703 male householders (15,186 living alone)), 21,355 female householders (18,271 living alone)), 9,737 nonrelatives
- In group quarters: 3,224 (2,937 institutionalized population)
64,802 married couples with children.
13,938 single-parent households (3,705 men, 10,233 women).
84.3% of residents of Southeast Montgomery speak English at home.
12.8% of residents speak Spanish at home (49% speak English very well, 19% speak English well, 20% speak English not well, 12% don't speak English at all).
1.9% of residents speak other Indo-European language at home (82% speak English very well, 13% speak English well, 5% speak English not well).
0.9% of residents speak Asian or Pacific Island language at home (64% speak English very well, 25% speak English well, 10% speak English not well, 1% don't speak English at all).
0.2% of residents speak other language at home (80% speak English very well, 15% speak English well, 5% speak English not well).
Foreign born population: 81,933 (17.0%)
(43.5% of them are naturalized citizens)
| Here: | 6.8 |
| State: | 6.3 |
| Here: | 4.0 |
| State: | 4.0 |

- Bedrooms in owner-occupied houses and condos in Southeast Montgomery, Texas
- 328no bedroom
- 1,8911 bedroom
- 7,2712 bedrooms
- 24,9283 bedrooms
- 16,3684 bedrooms
- 2,8975+ bedrooms

- Bedrooms in renter-occupied apartments in Southeast Montgomery, Texas
- 1,023no bedroom
- 6,0661 bedroom
- 6,3342 bedrooms
- 4,4393 bedrooms
- 8534 bedrooms
- 1175+ bedrooms

- Cars and other vehicles available in Southeast Montgomery in owner-occupied houses/condos
- 1,561no vehicle
- 12,1931 vehicle
- 28,5082 vehicles
- 8,8803 vehicles
- 1,9944 vehicles
- 5475+ vehicles

- Cars and other vehicles available in Southeast Montgomery in renter-occupied apartments
- 2,253no vehicle
- 9,4221 vehicle
- 5,8602 vehicles
- 1,0533 vehicles
- 1674 vehicles
- 775+ vehicles

- Rooms in owner-occupied houses in Southeast Montgomery, Texas
- 1201 room
- 8092 rooms
- 2,4923 rooms
- 4,3924 rooms
- 10,1115 rooms
- 10,9606 rooms
- 8,0767 rooms
- 6,8528 rooms
- 9,8719+ rooms

- Rooms in renter-occupied apartments in Southeast Montgomery, Texas
- 8391 room
- 2,3192 rooms
- 4,0793 rooms
- 4,6964 rooms
- 3,5585 rooms
- 1,8646 rooms
- 7887 rooms
- 3768 rooms
- 3139+ rooms


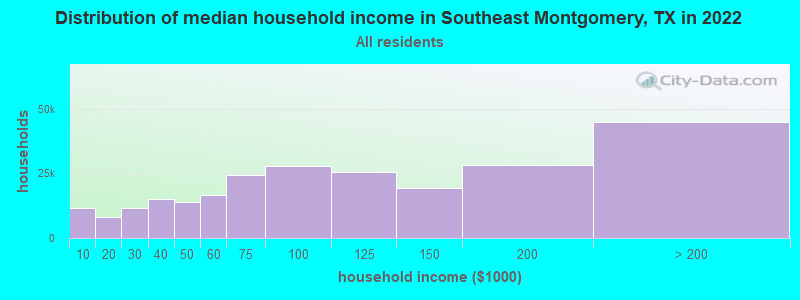
Southeast Montgomery, TX household income distribution

- 11,505Less than $10,000
- 8,146$10,000 to $19,999
- 11,727$20,000 to $29,999
- 14,966$30,000 to $39,999
- 14,026$40,000 to $49,999
- 16,658$50,000 to $59,999
- 24,337$60,000 to $74,999
- 27,823$75,000 to $99,999
- 25,390$100,000 to $124,999
- 19,233$125,000 to $149,999
- 28,091$150,000 to $199,999
- 44,910$200,000 or more
Percentage of workers working in this county: 64.6%
Number of people working at home: 40,147 (17.5% of all workers)
Travel time to work (commute)
- Less than 5 minutes: 2,312
- 5 to 9 minutes: 8,056
- 10 to 14 minutes: 11,695
- 15 to 19 minutes: 11,499
- 20 to 24 minutes: 8,713
- 25 to 29 minutes: 3,688
- 30 to 34 minutes: 12,232
- 35 to 39 minutes: 3,039
- 40 to 44 minutes: 4,138
- 45 to 59 minutes: 13,199
- 60 to 89 minutes: 9,735
- 90 or more minutes: 3,071
Means of transportation to work:
- Drove a car alone: 74,688 (79.1%)
- Carpooled: 12,855 (13.6%)
- Bus or trolley bus: 1,279 (1.4%)
- Subway or elevated: 12 (0.0%)
- Railroad: 9 (0.0%)
- Ferryboat: 15 (0.0%)
- Taxi: 37 (0.0%)
- Motorcycle: 139 (0.1%)
- Bicycle: 148 (0.2%)
- Walked: 1,051 (1.1%)
- Other means: 1,144 (1.2%)
- Worked at home: 3,064 (3.2%)


- Year of entry for the foreign-born population in Southeast Montgomery, Texas
- 6,7141995 to March 2000
- 4,1021990 to 1994
- 2,9101985 to 1989
- 3,0961980 to 1984
- 1,8371975 to 1979
- 9341970 to 1974
- 4621965 to 1969
- 1,258Before 1965
Most common places of birth for foreign-born residents (%):
| Southeast Montgomery: | 53.9% (11,484) |
| Texas: | 64.8% (1,879,369) |
| Southeast Montgomery: | 4.6% (970) |
| Texas: | 1.2% (36,176) |
| Southeast Montgomery: | 4.3% (921) |
| Texas: | 3.5% (101,259) |
| Southeast Montgomery: | 3.4% (720) |
| Texas: | 1.2% (33,655) |
| Southeast Montgomery: | 3.3% (693) |
| Texas: | 1.3% (36,802) |
| Southeast Montgomery: | 2.7% (566) |
| Texas: | 2.7% (78,388) |
| Southeast Montgomery: | 2.1% (437) |
| Texas: | 1.6% (45,907) |
| Southeast Montgomery: | 2.0% (417) |
| Texas: | 1.4% (39,249) |
| Southeast Montgomery: | 1.6% (341) |
| Texas: | 0.8% (22,073) |
Place of birth for U.S.-born residents:
- This state: 117,135
- Other state: 67,486
- Northeast: 11,147
- Midwest: 19,510
- South: 25,253
- West: 11,576
49% of Southeast Montgomery residents lived in the same house 5 years ago.
Out of people who lived in different houses, 39% lived in this county.
Out of people who lived in different counties, 64% lived in Texas.
Education attainment for males 25 years and older:
- No schooling: 1,015
- Nursery to 4th grade: 485
- 5th and 6th grade: 1,768
- 7th and 8th grade: 1,605
- 9th grade: 1,603
- 10th grade: 1,857
- 11th grade: 1,708
- 12th grade, no diploma: 1,959
- High school graduate (or equivalency): 14,503
- Less than 1 year of college: 4,285
- Some college more than 1 year, no degree: 9,066
- Associate degree: 2,497
- Bachelor's degree: 12,425
- Master's degree: 4,428
- Professional school degree: 1,455
- Doctorate degree: 902

Education attainment for females 25 years and older:
- No schooling: 851
- Nursery to 4th grade: 332
- 5th and 6th grade: 1,282
- 7th and 8th grade: 1,582
- 9th grade: 1,907
- 10th grade: 2,071
- 11th grade: 2,014
- 12th grade, no diploma: 2,446
- High school graduate (or equivalency): 18,095
- Less than 1 year of college: 5,696
- Some college more than 1 year, no degree: 10,281
- Associate degree: 3,722
- Bachelor's degree: 11,636
- Master's degree: 3,149
- Professional school degree: 751
- Doctorate degree: 273


Housing units in structures:
- One, detached: 49,653
- One, attached: 1,649
- Two: 390
- 3 or 4: 1,705
- 5 to 9: 1,750
- 10 to 19: 2,469
- 20 to 49: 1,789
- 50 or more: 4,143
- Mobile homes: 13,955
- Boats, RVs, vans, etc.: 202
Median worth of mobile homes: $107,213
Housing units lacking complete kitchen facilities: 1.1%

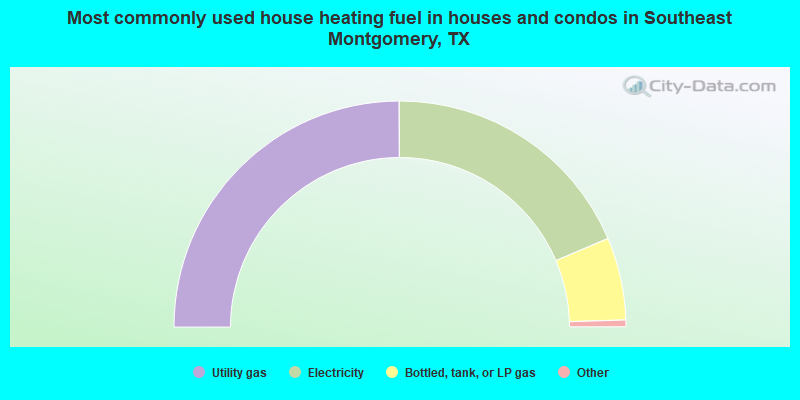
- 49.9%Utility gas
- 37.3%Electricity
- 11.8%Bottled, tank, or LP gas
- 0.5%Wood
- 0.2%No fuel used
- 0.1%Other fuel
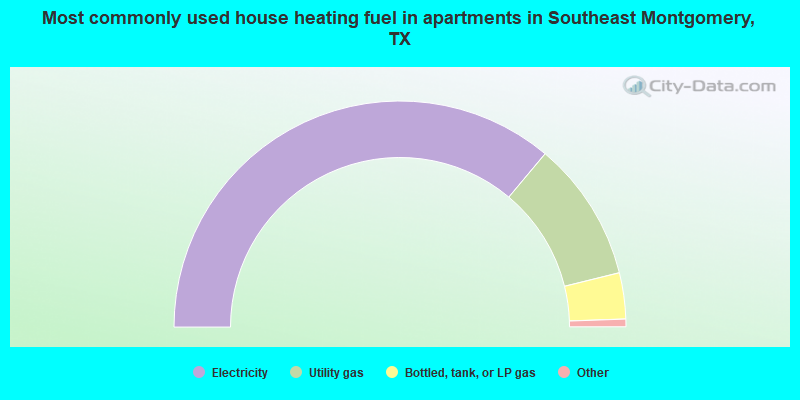
- 72.2%Electricity
- 20.1%Utility gas
- 6.6%Bottled, tank, or LP gas
- 0.7%No fuel used
- 0.2%Fuel oil, kerosene, etc.
Private vs. public school enrollment:
| Here: | 7.3% |
| Texas: | 6.8% |
| Here: | 7.9% |
| Texas: | 6.2% |
| Here: | 11.2% |
| Texas: | 15.4% |


