Southeast Bradley, TN (Tennessee) Houses and Residents
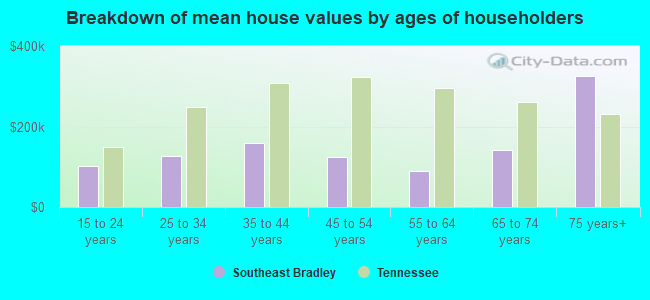
| Southeast Bradley: | $213,837 |
| Tennessee: | $284,800 |
Total population: 8,592 (Urban population: 1,067, Rural population: 6,869 (208 farm, 6,661 nonfarm))
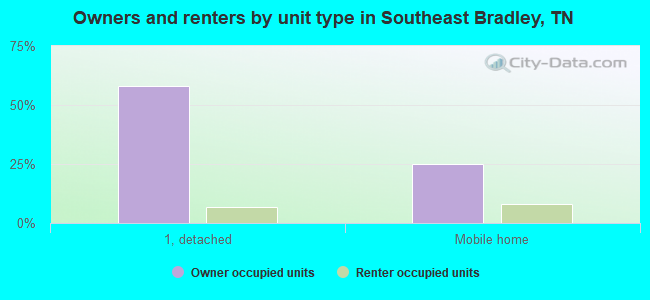
Houses: 3,262 (3,064 occupied: 2,561 owner occupied, 503 renter occupied)
| % of renters here: | 16% |
| State: | 33% |
Housing density: 52 houses/condos per square mile
Median price asked for vacant for-sale houses and condos in 2022 in this county: $235,873.
Median contract rent in 2022: $666 (lower quartile is $574, upper quartile is $911)
Median rent asked for vacant for-rent units in 2022: $680
Median gross rent in Southeast Bradley, TN in 2022: $933
Housing units in Southeast Bradley with a mortgage: 885 (94 second mortgage, 73 home equity loan, 0 both second mortgage and home equity loan)
Houses without a mortgage: 501
Compare current foreclosures near Southeast Bradley, TN:
| Photo | Address | Area | Beds / Baths | Price | Details |
|---|---|---|---|---|---|

|
#1
Spring Place Rd SE
Cleveland, TN 37323
|
3,440 sq. feet
|
2 baths 3 beds |
$99,000
|
show details |

|
#2
Highway 411 N
Crandall, GA 30711
|
1,142 sq. feet
|
1 baths 2 beds |
$175,000
|
show details |

|
#3
Long St
Cohutta, GA 30710
|
800 sq. feet
|
1 baths 2 beds |
$21,900
|
show details |

|
#4
Georgetown Cir NW
Cleveland, TN 37312
|
1,216 sq. feet
|
2 baths 3 beds |
show details | |

|
#5
Jessie Ln NW
Charleston, TN 37310
|
3,331 sq. feet
|
3 baths 4 beds |
show details | |

|
#6
Black Fox Rd
Mc Donald, TN 37353
|
2,442 sq. feet
|
3 baths 3 beds |
show details | |

|
#7
Fern Dr SE
Cleveland, TN 37323
|
1,344 sq. feet
|
2 baths 3 beds |
show details | |

|
#8
Lee St SE
Cleveland, TN 37311
|
1,180 sq. feet
|
2 baths 3 beds |
show details | |

|
#9
Abshire Ln NE
Cleveland, TN 37323
|
2,643 sq. feet
|
3 baths 4 beds |
show details | |

|
#10
Webb Ln NE
Cleveland, TN 37323
|
1,710 sq. feet
|
2 baths 3 beds |
show details |
| Photo | Address | Area | Beds / Baths | Price | Details |
|---|---|---|---|---|---|

|
#11
Old York Rd NE
Cleveland, TN 37323
|
1,480 sq. feet
|
1 baths 3 beds |
show details | |

|
#12
Webb Ln NE
Cleveland, TN 37323
|
1,635 sq. feet
|
2 baths 3 beds |
show details | |

|
#13
Fern Dr SE
Cleveland, TN 37323
|
1,337 sq. feet
|
2 baths 3 beds |
show details | |

|
#14
Virginia Ave SW
Cleveland, TN 37311
|
1,196 sq. feet
|
2 baths 3 beds |
show details | |

|
#15
Ladd Springs Rd SE
Cleveland, TN 37323
|
792 sq. feet
|
1 baths 2 beds |
show details | |

|
#16
Silver Springs Trl NW
Cleveland, TN 37312
|
2,144 sq. feet
|
3 baths 3 beds |
show details | |

|
#17
White Oak Rd NW
Cleveland, TN 37312
|
1,308 sq. feet
|
1 baths - beds |
show details | |

|
#18
Telico Dr
Dalton, GA 30721
|
1,696 sq. feet
|
2 baths - beds |
show details | |

|
#19
Thoroughbred Dr NW
Cleveland, TN 37312
|
2,501 sq. feet
|
4 baths 4 beds |
show details | |

|
#20
Farmway Dr SE
Cleveland, TN 37323
|
1,408 sq. feet
|
2 baths 3 beds |
show details |
| Photo | Address | Area | Beds / Baths | Price | Details |
|---|---|---|---|---|---|

|
#21
Stonewood Dr NW
Cleveland, TN 37311
|
2,530 sq. feet
|
3 baths 3 beds |
show details | |

|
#22
Horton Rd SE
Cleveland, TN 37323
|
1,144 sq. feet
|
2 baths 3 beds |
show details | |

|
#23
Eldredge Cir NW
Cleveland, TN 37312
|
1,678 sq. feet
|
2 baths 3 beds |
show details | |

|
#24
Blue Springs Rd
Cleveland, TN 37311
|
1,495 sq. feet
|
2 baths 3 beds |
show details | |

|
#25
Pin Oaks Cir NE
Cleveland, TN 37323
|
1,664 sq. feet
|
2 baths 3 beds |
show details | |

|
#26
Owl Hollow Rd
Mc Donald, TN 37353
|
1,344 sq. feet
|
1 baths - beds |
show details | |

|
#27
Brookcrest Dr NE
Cleveland, TN 37323
|
1,596 sq. feet
|
1 baths - beds |
show details | |

|
#28
Lang St SE
Cleveland, TN 37311
|
1,000 sq. feet
|
1 baths - beds |
show details | |

|
#29
Chatata Valley Rd NE
Charleston, TN 37310
|
1,588 sq. feet
|
2 baths - beds |
show details | |

|
#30
Rolling Brook Dr NE
Cleveland, TN 37323
|
1,775 sq. feet
|
1 baths - beds |
show details |
| Photo | Address | Area | Beds / Baths | Price | Details |
|---|---|---|---|---|---|

|
#31
Shady Lane Pl SW
Cleveland, TN 37311
|
948 sq. feet
|
1 baths - beds |
show details | |

|
#32
Smyrna Rd
Benton, TN 37307
|
1,040 sq. feet
|
1 baths - beds |
show details | |

|
#33
Heatherly Ln
Chatsworth, GA 30705
|
1,197 sq. feet
|
2 baths - beds |
show details | |

|
#34
Timberland Trl
Ringgold, GA 30736
|
1,104 sq. feet
|
2 baths - beds |
show details | |

|
#35
4th St NW
Cleveland, TN 37311
|
1,262 sq. feet
|
1 baths - beds |
show details | |

|
#36
Christian Dr NW
Cleveland, TN 37312
|
1,282 sq. feet
|
2 baths - beds |
show details | |

|
#37
Grove Rd
Benton, TN 37307
|
1,960 sq. feet
|
2 baths - beds |
show details | |

|
#38
Aurora Ave SE
Cleveland, TN 37311
|
1,056 sq. feet
|
2 baths - beds |
show details | |

|
#39
Dockery Ln SE
Cleveland, TN 37323
|
1,068 sq. feet
|
1 baths - beds |
show details | |

|
#40
Spring Hollow Rd SW
Cleveland, TN 37311
|
1,772 sq. feet
|
2 baths - beds |
show details |
| Photo | Address | Area | Beds / Baths | Price | Details |
|---|---|---|---|---|---|

|
#41
Kings Row
Cohutta, GA 30710
|
1,056 sq. feet
|
2 baths - beds |
show details | |

|
#42
Crowe Hill Cir
Benton, TN 37307
|
1,056 sq. feet
|
1 baths - beds |
show details | |

|
#43
Apison Rd
Cohutta, GA 30710
|
1,316 sq. feet
|
2 baths - beds |
show details | |

|
#44
Dellwood Ln NE
Cleveland, TN 37312
|
1,156 sq. feet
|
1 baths - beds |
show details | |

|
#45
17th St NW
Cleveland, TN 37311
|
1,668 sq. feet
|
1 baths - beds |
show details | |

|
#46
17th St NW
Cleveland, TN 37311
|
1,904 sq. feet
|
1 baths - beds |
show details | |

|
#47
Medlin Rd NW
Cleveland, TN 37312
|
1,468 sq. feet
|
2 baths - beds |
show details | |

|
#48
Bates Pike SE
Cleveland, TN 37311
|
1,036 sq. feet
|
2 baths - beds |
show details | |

|
#49
Brown Ave NW
Cleveland, TN 37311
|
1,258 sq. feet
|
2 baths - beds |
show details | |

|
Check over 1 million property listings on Foreclosure.com!
|
browse all offers | |||

Household type by relationship:
Households: 96,219- In family households: 82,340 (19,460 male householders, 7,407 female householders)
20,332 spouses, 26,943 children (24,197 natural, 821 adopted, 1,925 stepchildren), 2,602 grandchildren, 759 brothers or sisters, 807 parents, foster children, 1,130 other relatives, 2,190 non-relatives
- In nonfamily households: 13,879 (5,051 male householders (3,861 living alone)), 6,029 female householders (5,171 living alone)), 2,799 nonrelatives
- In group quarters: 2,744 (790 institutionalized population)
14,336 married couples with children.
4,315 single-parent households (916 men, 3,399 women).
97.8% of residents of Southeast Bradley speak English at home.
1.6% of residents speak Spanish at home (51% speak English very well, 12% speak English well, 21% speak English not well, 15% don't speak English at all).
0.4% of residents speak other Indo-European language at home (77% speak English very well, 23% speak English well).
0.2% of residents speak other language at home (100% speak English very well).
Foreign born population: 37 (0.4%)
(62.2% of them are naturalized citizens)
| Here: | 6.5 |
| State: | 6.5 |
| Here: | 4.5 |
| State: | 4.4 |
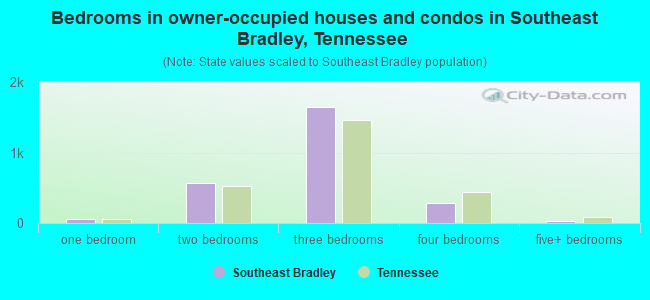
- Bedrooms in owner-occupied houses and condos in Southeast Bradley, Tennessee
- 0no bedroom
- 501 bedroom
- 5632 bedrooms
- 1,6473 bedrooms
- 2784 bedrooms
- 235+ bedrooms
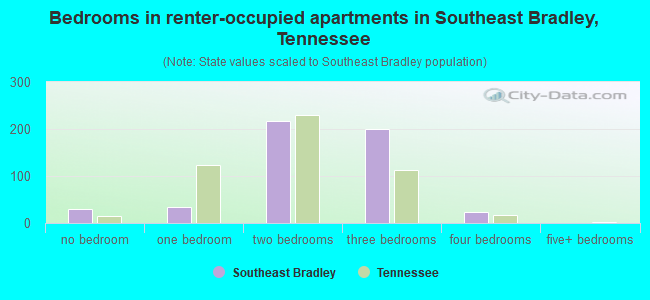
- Bedrooms in renter-occupied apartments in Southeast Bradley, Tennessee
- 29no bedroom
- 331 bedroom
- 2182 bedrooms
- 1993 bedrooms
- 244 bedrooms
- 05+ bedrooms
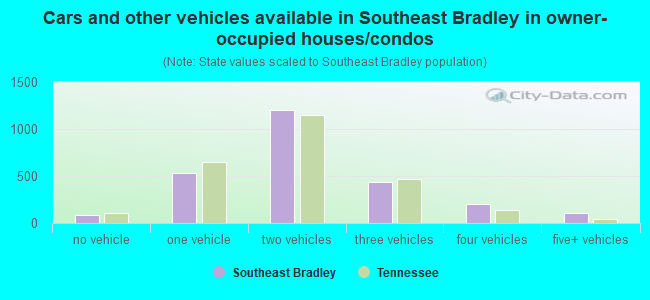
- Cars and other vehicles available in Southeast Bradley in owner-occupied houses/condos
- 85no vehicle
- 5341 vehicle
- 1,2012 vehicles
- 4323 vehicles
- 1994 vehicles
- 1105+ vehicles
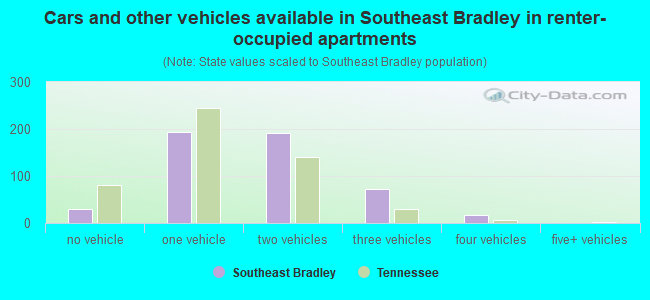
- Cars and other vehicles available in Southeast Bradley in renter-occupied apartments
- 29no vehicle
- 1941 vehicle
- 1912 vehicles
- 733 vehicles
- 164 vehicles
- 05+ vehicles
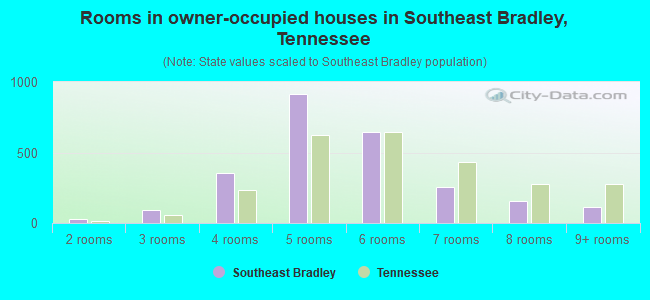
- Rooms in owner-occupied houses in Southeast Bradley, Tennessee
- 01 room
- 292 rooms
- 923 rooms
- 3524 rooms
- 9175 rooms
- 6486 rooms
- 2567 rooms
- 1578 rooms
- 1109+ rooms
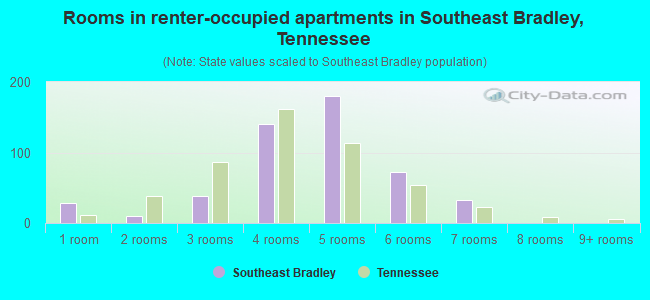
- Rooms in renter-occupied apartments in Southeast Bradley, Tennessee
- 291 room
- 102 rooms
- 393 rooms
- 1404 rooms
- 1805 rooms
- 726 rooms
- 337 rooms
- 08 rooms
- 09+ rooms
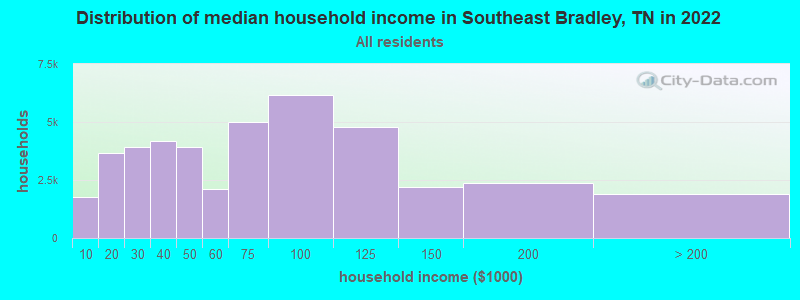
Southeast Bradley, TN household income distribution

- 1,750Less than $10,000
- 3,647$10,000 to $19,999
- 3,940$20,000 to $29,999
- 4,179$30,000 to $39,999
- 3,939$40,000 to $49,999
- 2,123$50,000 to $59,999
- 4,993$60,000 to $74,999
- 6,185$75,000 to $99,999
- 4,799$100,000 to $124,999
- 2,196$125,000 to $149,999
- 2,387$150,000 to $199,999
- 1,876$200,000 or more
Percentage of workers working in this county: 67.7%
Number of people working at home: 438 (10.6% of all workers)
Travel time to work (commute)
- Less than 5 minutes: 82
- 5 to 9 minutes: 120
- 10 to 14 minutes: 432
- 15 to 19 minutes: 734
- 20 to 24 minutes: 772
- 25 to 29 minutes: 226
- 30 to 34 minutes: 449
- 35 to 39 minutes: 116
- 40 to 44 minutes: 89
- 45 to 59 minutes: 353
- 60 to 89 minutes: 102
- 90 or more minutes: 44
Means of transportation to work:
- Drove a car alone: 2,990 (82.9%)
- Carpooled: 462 (12.8%)
- Motorcycle: 9 (0.2%)
- Walked: 43 (1.2%)
- Other means: 15 (0.4%)
- Worked at home: 88 (2.4%)
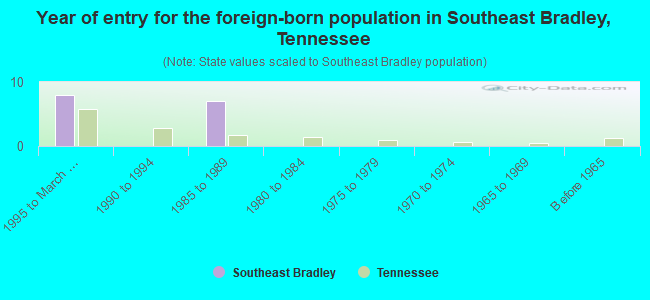
- Year of entry for the foreign-born population in Southeast Bradley, Tennessee
- 81995 to March 2000
- 01990 to 1994
- 71985 to 1989
- 01980 to 1984
- 01975 to 1979
- 01970 to 1974
- 01965 to 1969
- 0Before 1965
Most common places of birth for foreign-born residents (%):
| Southeast Bradley: | 53.3% (8) |
| Tennessee: | 28.1% (44,682) |
| Southeast Bradley: | 46.7% (7) |
| Tennessee: | 3.6% (5,726) |
Place of birth for U.S.-born residents:
- This state: 5,693
- Other state: 2,216
- Northeast: 187
- Midwest: 616
- South: 1,230
- West: 183
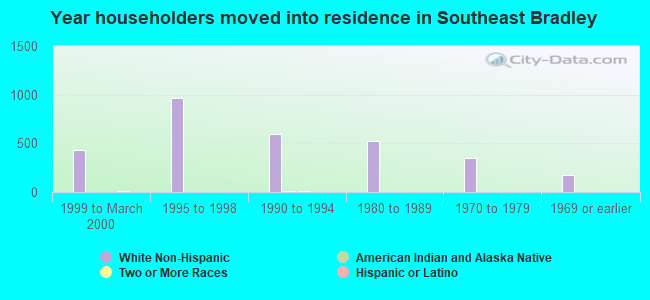
62% of Southeast Bradley residents lived in the same house 5 years ago.
Out of people who lived in different houses, 65% lived in this county.
Out of people who lived in different counties, 42% lived in Tennessee.
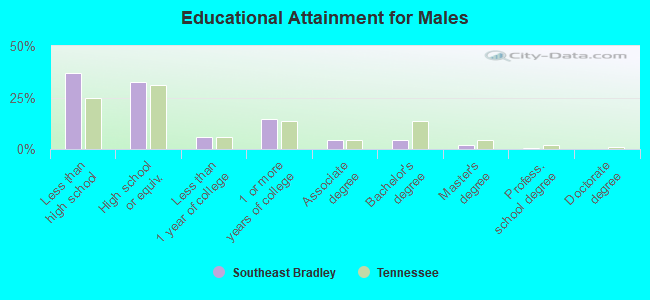
Education attainment for males 25 years and older:
- No schooling: 8
- Nursery to 4th grade: 9
- 5th and 6th grade: 69
- 7th and 8th grade: 249
- 9th grade: 235
- 10th grade: 137
- 11th grade: 120
- 12th grade, no diploma: 116
- High school graduate (or equivalency): 833
- Less than 1 year of college: 146
- Some college more than 1 year, no degree: 370
- Associate degree: 107
- Bachelor's degree: 107
- Master's degree: 53
- Professional school degree: 13
- Doctorate degree: 0
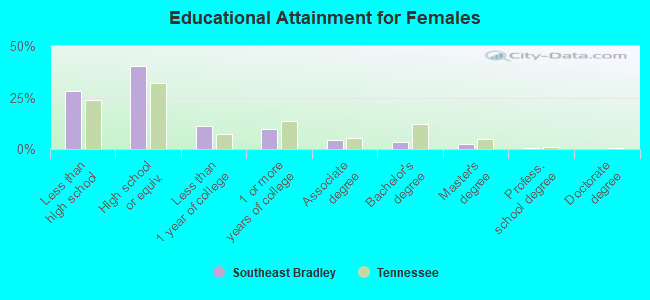
Education attainment for females 25 years and older:
- No schooling: 17
- Nursery to 4th grade: 13
- 5th and 6th grade: 53
- 7th and 8th grade: 244
- 9th grade: 86
- 10th grade: 187
- 11th grade: 87
- 12th grade, no diploma: 58
- High school graduate (or equivalency): 1,066
- Less than 1 year of college: 290
- Some college more than 1 year, no degree: 263
- Associate degree: 116
- Bachelor's degree: 89
- Master's degree: 66
- Professional school degree: 18
- Doctorate degree: 0


Housing units in structures:
- One, detached: 2,107
- Two: 43
- 3 or 4: 12
- 5 to 9: 21
- Mobile homes: 1,079
Median worth of mobile homes: $87,767
Housing units lacking complete kitchen facilities: 1.2%

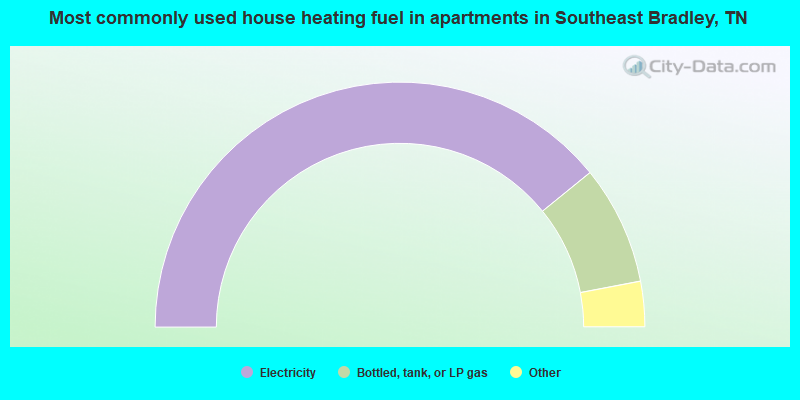
- 68.4%Electricity
- 23.7%Bottled, tank, or LP gas
- 3.5%Utility gas
- 3.4%Wood
- 0.7%Fuel oil, kerosene, etc.
- 0.4%No fuel used
- 78.3%Electricity
- 15.7%Bottled, tank, or LP gas
- 3.0%Fuel oil, kerosene, etc.
- 1.6%Utility gas
- 1.4%Wood
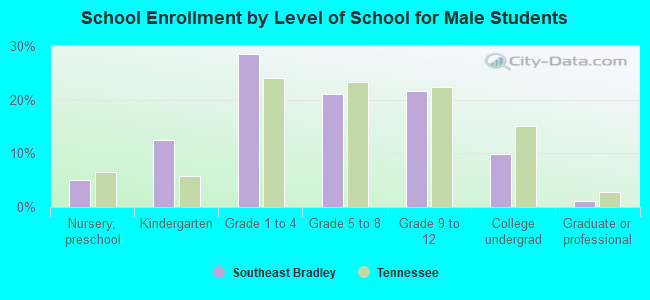
Private vs. public school enrollment:
| Here: | 4.3% |
| Tennessee: | 9.5% |
| Here: | 2.5% |
| Tennessee: | 10.4% |
| Here: | 27.8% |
| Tennessee: | 22.8% |