Housing density: 212 houses/condos per square mile
Median price asked for vacant for-sale houses and condos in 2022 in this county: $182,682.
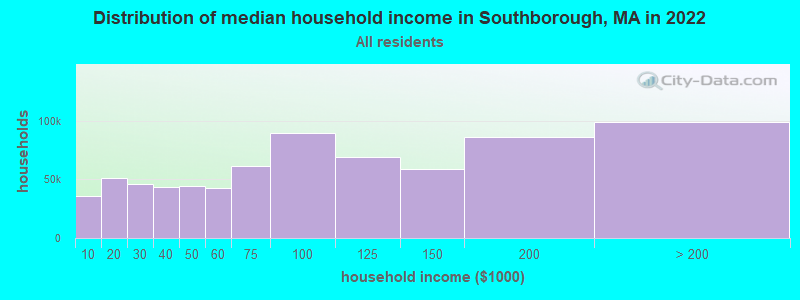
Median contract rent in 2022: $1,853 (lower quartile is $1,152, upper quartile is over $2,000)
Median rent asked for vacant for-rent units in 2022: $4,421
Median gross rent in Southborough, MA in 2022: over $2,000
Housing units in Southborough with a mortgage: 1,829 (209 second mortgage, 368 home equity loan, 0 both second mortgage and home equity loan) Houses without a mortgage: 614
Compare current foreclosures near Southborough, MA:
In family households: 644,137 (138,415 male householders, 64,187 female householders)
151,406 spouses, 234,038 children (220,335 natural, 5,096 adopted, 8,607 stepchildren), 11,080 grandchildren, 6,742 brothers or sisters, 7,870 parents, foster children, 7,297 other relatives, 18,119 non-relatives
In nonfamily households: 127,370 (47,312 male householders (35,337 living alone)), 53,166 female householders (44,100 living alone)), 26,892 nonrelatives
In group quarters: 27,045 (11,315 institutionalized population)
135,695 married couples with children.
42,745 single-parent households (8,218 men, 34,527 women).
92.1% of residents of Southborough speak English at home.
1.3% of residents speak Spanish at home (81% speak English very well, 19% speak English well).
4.7% of residents speak other Indo-European language at home (86% speak English very well, 9% speak English well, 5% speak English not well).
1.6% of residents speak Asian or Pacific Island language at home (89% speak English very well, 6% speak English well, 5% speak English not well).
0.3% of residents speak other language at home (100% speak English very well).
Foreign born population: 1,584 (15.7%)
(60.7% of them are naturalized citizens)
Year of entry for the foreign-born population in Southborough, Massachusetts
1891995 to March 2000
1321990 to 1994
851985 to 1989
551980 to 1984
591975 to 1979
861970 to 1974
601965 to 1969
112Before 1965
First ancestries reported:
Irish: 2,451 (23.1%)
English: 1,548 (14.6%)
Other: 1,379 (13.0%)
Italian: 1,342 (12.6%)
German: 709 (6.7%)
French: 598 (5.6%)
Polish: 398 (3.8%)
United States: 360 (3.4%)
Scottish: 319 (3.0%)
French Canadian: 236 (2.2%)
Scotch-Irish: 227 (2.1%)
Swedish: 141 (1.3%)
Greek: 140 (1.3%)
Lithuanian: 134 (1.3%)
Russian: 124 (1.2%)
Dutch: 80 (0.8%)
Norwegian: 76 (0.7%)
Welsh: 75 (0.7%)
Ukrainian: 66 (0.6%)
Czech: 61 (0.6%)
Danish: 56 (0.5%)
Arab: 45 (0.4%)
Portuguese: 24 (0.2%)
Subsaharan African: 15 (0.1%)
Hungarian: 8 (0.08%)
Most common places of birth for foreign-born residents (%):
United Kingdom
Southborough:
34.8% (271)
Massachusetts:
3.3% (25,403)
Canada
Southborough:
14.3% (111)
Massachusetts:
5.2% (40,247)
India
Southborough:
13.2% (103)
Massachusetts:
3.6% (28,086)
Iran
Southborough:
4.9% (38)
Massachusetts:
0.6% (4,416)
China, excluding Hong Kong and Taiwan
Southborough:
3.2% (25)
Massachusetts:
5.1% (39,255)
Other South Central Asia
Southborough:
3.2% (25)
Massachusetts:
0.4% (2,765)
Korea
Southborough:
3.1% (24)
Massachusetts:
1.7% (13,456)
Other Western Africa
Southborough:
2.2% (17)
Massachusetts:
2.6% (20,299)
Brazil
Southborough:
2.1% (16)
Massachusetts:
4.7% (36,669)
Ecuador
Southborough:
2.1% (16)
Massachusetts:
0.4% (3,066)
Italy
Southborough:
1.8% (14)
Massachusetts:
3.7% (28,319)
Germany
Southborough:
1.5% (12)
Massachusetts:
1.9% (14,883)
Place of birth for U.S.-born residents:
This state: 5,837
Other state: 2,117
Northeast: 1,300
Midwest: 370
South: 250
West: 197
63% of Southborough residents lived in the same house 5 years ago. Out of people who lived in different houses, 38% lived in this county. Out of people who lived in different counties, 61% lived in Massachusetts.
Education attainment for males 25 years and older:
No schooling: 0
Nursery to 4th grade: 0
5th and 6th grade: 5
7th and 8th grade: 6
9th grade: 12
10th grade: 15
11th grade: 19
12th grade, no diploma: 28
High school graduate (or equivalency): 363
Less than 1 year of college: 59
Some college more than 1 year, no degree: 229
Associate degree: 138
Bachelor's degree: 1,069
Master's degree: 526
Professional school degree: 174
Doctorate degree: 107
Education attainment for females 25 years and older:
No schooling: 0
Nursery to 4th grade: 0
5th and 6th grade: 5
7th and 8th grade: 6
9th grade: 12
10th grade: 15
11th grade: 31
12th grade, no diploma: 48
High school graduate (or equivalency): 454
Less than 1 year of college: 125
Some college more than 1 year, no degree: 269
Associate degree: 240
Bachelor's degree: 1,019
Master's degree: 418
Professional school degree: 171
Doctorate degree: 65
Housing units in structures:
One, detached: 2,721
One, attached: 85
Two: 49
3 or 4: 88
5 to 9: 44
50 or more: 10
Housing units lacking complete kitchen facilities: 0.3%