South Yuba City, CA (California) Houses and Residents
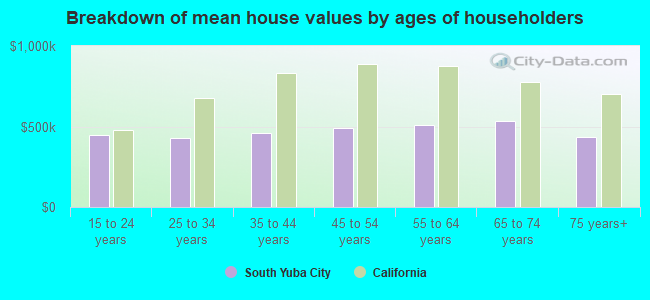
| South Yuba City: | $461,275 |
| California: | $715,900 |
Total population: 14,624 (Urban population: 12,885, Rural population: 0)
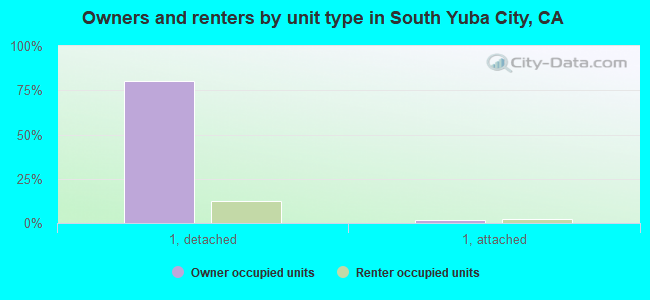
Houses: 4,197 (4,086 occupied: 3,380 owner occupied, 706 renter occupied)
| % of renters here: | 17% |
| State: | 44% |
Housing density: 1,297 houses/condos per square mile
Median price asked for vacant for-sale houses and condos in 2022 in this county: $385,157.
Median contract rent in 2022: $1,899 (lower quartile is $1,166, upper quartile is over $2,000)
Median rent asked for vacant for-rent units in 2022: $1,569
Median gross rent in South Yuba City, CA in 2022: over $2,000
Housing units in South Yuba City with a mortgage: 2,613 (285 second mortgage, 280 home equity loan, 7 both second mortgage and home equity loan)
Houses without a mortgage: 670
Compare current foreclosures near South Yuba City, CA:
| Photo | Address | Area | Beds / Baths | Price | Details |
|---|---|---|---|---|---|

|
#1
Johnson Clan Ave
Gridley, CA 95948
|
3,331 sq. feet
|
4 baths 4 beds |
$13,559
|
show details |

|
#2
Chestnut St
Yuba City, CA 95991
|
640 sq. feet
|
1 baths 2 beds |
show details | |

|
#3
Freeman St
Marysville, CA 95901
|
1,152 sq. feet
|
1 baths 3 beds |
show details | |

|
#4
Bandy Way
Yuba City, CA 95991
|
752 sq. feet
|
1 baths 2 beds |
show details | |

|
#5
Norby Ct
Olivehurst, CA 95961
|
3,210 sq. feet
|
3 baths 5 beds |
show details | |

|
#6
Erle Rd
Marysville, CA 95901
|
1,224 sq. feet
|
1 baths 3 beds |
show details | |

|
#7
Colusa Hwy
Yuba City, CA 95993
|
2,586 sq. feet
|
2 baths 4 beds |
show details | |

|
#8
Sebina Ct
Live Oak, CA 95953
|
1,264 sq. feet
|
2 baths 3 beds |
show details | |

|
#9
E 22nd St
Marysville, CA 95901
|
1,176 sq. feet
|
2 baths 3 beds |
show details | |

|
#10
Edwards St
Marysville, CA 95901
|
1,300 sq. feet
|
2 baths 3 beds |
show details |
| Photo | Address | Area | Beds / Baths | Price | Details |
|---|---|---|---|---|---|

|
#11
Cheim Blvd # 15
Marysville, CA 95901
|
1,206 sq. feet
|
2 baths 3 beds |
show details | |

|
#12
State Highway 70
Marysville, CA 95901
|
2,670 sq. feet
|
3 baths 3 beds |
show details | |

|
#13
State Highway 70
Marysville, CA 95901
|
2,670 sq. feet
|
3 baths 3 beds |
show details | |

|
#14
E 22nd St
Marysville, CA 95901
|
1,176 sq. feet
|
2 baths 3 beds |
show details | |

|
#15
Boardwalk Dr
Marysville, CA 95901
|
2,276 sq. feet
|
2 baths 5 beds |
show details | |

|
#16
10th St
Sheridan, CA 95681
|
1,102 sq. feet
|
2 baths 3 beds |
show details | |

|
#17
E 19th St
Marysville, CA 95901
|
1,388 sq. feet
|
2 baths 3 beds |
show details | |

|
#18
Hobart Dr
Marysville, CA 95901
|
1,487 sq. feet
|
2 baths 3 beds |
show details | |

|
#19
Skinner Ave
Olivehurst, CA 95961
|
2,820 sq. feet
|
2 baths 4 beds |
show details | |

|
#20
Waterhole Loop
Marysville, CA 95901
|
1,633 sq. feet
|
2 baths 3 beds |
show details |
| Photo | Address | Area | Beds / Baths | Price | Details |
|---|---|---|---|---|---|

|
#21
Ravine Ct
Marysville, CA 95901
|
1,870 sq. feet
|
2 baths 3 beds |
show details | |

|
#22
Freeman St
Marysville, CA 95901
|
1,275 sq. feet
|
1 baths 3 beds |
show details | |

|
#23
Buchanan St
Marysville, CA 95901
|
979 sq. feet
|
1 baths 3 beds |
show details | |

|
#24
E 16th St
Marysville, CA 95901
|
936 sq. feet
|
1 baths 2 beds |
show details | |

|
#25
Sampson St
Marysville, CA 95901
|
1,322 sq. feet
|
1 baths 2 beds |
show details | |

|
#26
Acacia Way
Olivehurst, CA 95961
|
1,187 sq. feet
|
2 baths 4 beds |
show details | |

|
#27
Tadpole Way
Marysville, CA 95901
|
1,859 sq. feet
|
2 baths 3 beds |
show details | |

|
#28
Crystal Ct
Olivehurst, CA 95961
|
1,915 sq. feet
|
2 baths 3 beds |
show details | |

|
#29
Morning Glory St
Olivehurst, CA 95961
|
2,939 sq. feet
|
3 baths 3 beds |
show details | |

|
#30
Snow Goose St
Olivehurst, CA 95961
|
2,674 sq. feet
|
2 baths 3 beds |
show details |
| Photo | Address | Area | Beds / Baths | Price | Details |
|---|---|---|---|---|---|

|
#31
Marin Ct
Olivehurst, CA 95961
|
2,548 sq. feet
|
3 baths 4 beds |
show details | |

|
#32
Long Bar Ln
Browns Valley, CA 95918
|
1,040 sq. feet
|
1 baths 3 beds |
show details | |

|
#33
Nielson Ave
Gridley, CA 95948
|
1,183 sq. feet
|
1 baths 3 beds |
show details | |

|
#34
Gilstrap Ave
Gridley, CA 95948
|
3,040 sq. feet
|
4 baths 5 beds |
show details | |

|
#35
Johnson Clan Ave
Gridley, CA 95948
|
- sq. feet
|
- baths - beds |
$28,836
|
show details |

|
#36
Brock Dr
Wheatland, CA 95692
|
1,651 sq. feet
|
2 baths 4 beds |
show details | |

|
#37
1st St
Wheatland, CA 95692
|
912 sq. feet
|
3 baths 4 beds |
show details | |

|
#38
Donner Ct
Wheatland, CA 95692
|
2,231 sq. feet
|
3 baths 4 beds |
show details | |

|
#39
Mcdevitt Dr
Wheatland, CA 95692
|
1,878 sq. feet
|
2 baths 4 beds |
show details | |

|
#40
Star Ct
Wheatland, CA 95692
|
1,625 sq. feet
|
2 baths 3 beds |
show details |
| Photo | Address | Area | Beds / Baths | Price | Details |
|---|---|---|---|---|---|

|
#41
Fir St
Live Oak, CA 95953
|
- sq. feet
|
2 baths 3 beds |
show details | |

|
#42
Presidio Way
Olivehurst, CA 95961
|
2,526 sq. feet
|
3 baths 4 beds |
show details | |

|
#43
Mcgowan Pkwy
Olivehurst, CA 95961
|
1,268 sq. feet
|
1 baths 3 beds |
show details | |

|
#44
Kensington Dr
Olivehurst, CA 95961
|
1,755 sq. feet
|
2 baths 3 beds |
show details | |

|
#45
Knights Ferry Dr
Olivehurst, CA 95961
|
1,518 sq. feet
|
2 baths 3 beds |
show details | |

|
#46
Casa Dulce Way
Olivehurst, CA 95961
|
2,072 sq. feet
|
2 baths 4 beds |
show details | |

|
#47
Casa Dulce Way
Olivehurst, CA 95961
|
2,149 sq. feet
|
2 baths 4 beds |
show details | |

|
#48
Jones Bar Trl
Olivehurst, CA 95961
|
1,621 sq. feet
|
2 baths 4 beds |
show details | |

|
#49
Rancho Rd
Marysville, CA 95901
|
784 sq. feet
|
1 baths 2 beds |
show details | |

|
Check over 1 million property listings on Foreclosure.com!
|
browse all offers | |||

 | Weather Thread (478 replies) |
| Which one? Folsom, Roseville, Rocklin, Lincoln, Yuba City (40 replies) |
| Best place to live close to Beale AFB (9 replies) |
Household type by relationship:
Households: 93,677- In family households: 83,206 (16,656 male householders, 6,587 female householders)
17,180 spouses, 30,981 children (28,785 natural, 703 adopted, 1,493 stepchildren), 2,494 grandchildren, 1,379 brothers or sisters, 1,751 parents, foster children, 2,111 other relatives, 2,870 non-relatives
- In nonfamily households: 10,471 (3,759 male householders (2,796 living alone)), 4,435 female householders (3,806 living alone)), 2,277 nonrelatives
- In group quarters: 1,060 (860 institutionalized population)
15,392 married couples with children.
4,887 single-parent households (1,330 men, 3,557 women).
68.8% of residents of South Yuba City speak English at home.
7.7% of residents speak Spanish at home (66% speak English very well, 24% speak English well, 6% speak English not well, 4% don't speak English at all).
21.8% of residents speak other Indo-European language at home (53% speak English very well, 19% speak English well, 18% speak English not well, 10% don't speak English at all).
1.6% of residents speak Asian or Pacific Island language at home (80% speak English very well, 20% speak English well).
Foreign born population: 3,495 (21.7%)
(76.4% of them are naturalized citizens)
| Here: | 6.4 |
| State: | 6.0 |
| Here: | 6.2 |
| State: | 3.9 |
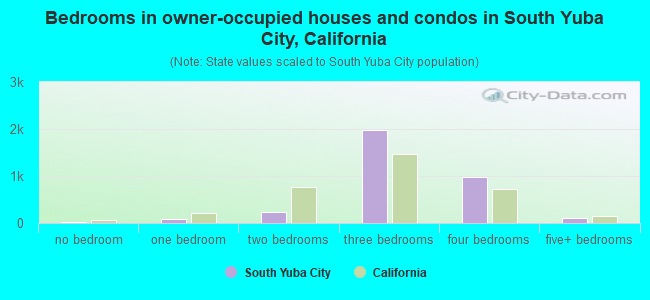
- Bedrooms in owner-occupied houses and condos in South Yuba City, California
- 11no bedroom
- 761 bedroom
- 2412 bedrooms
- 1,9753 bedrooms
- 9694 bedrooms
- 1085+ bedrooms
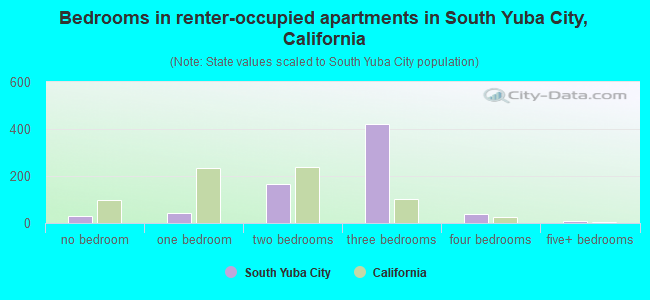
- Bedrooms in renter-occupied apartments in South Yuba City, California
- 28no bedroom
- 421 bedroom
- 1682 bedrooms
- 4233 bedrooms
- 374 bedrooms
- 85+ bedrooms
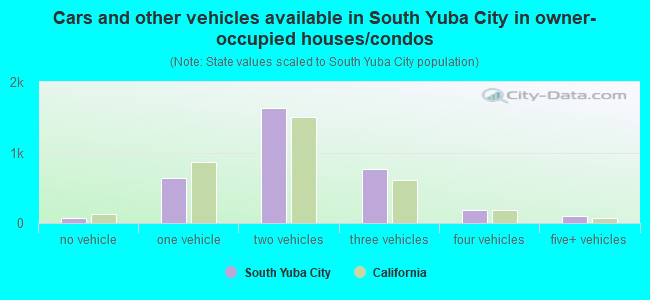
- Cars and other vehicles available in South Yuba City in owner-occupied houses/condos
- 75no vehicle
- 6341 vehicle
- 1,6272 vehicles
- 7593 vehicles
- 1884 vehicles
- 975+ vehicles
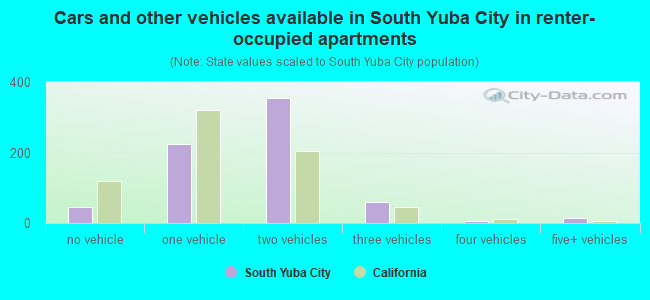
- Cars and other vehicles available in South Yuba City in renter-occupied apartments
- 46no vehicle
- 2251 vehicle
- 3562 vehicles
- 603 vehicles
- 64 vehicles
- 135+ vehicles
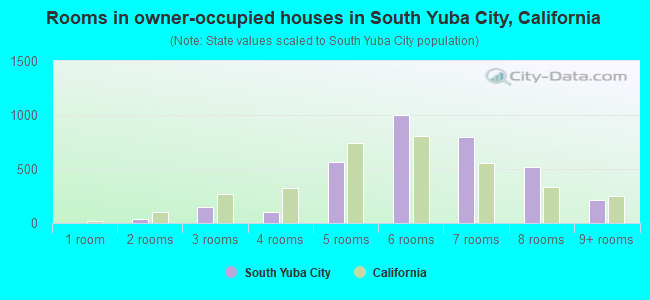
- Rooms in owner-occupied houses in South Yuba City, California
- 01 room
- 372 rooms
- 1493 rooms
- 1054 rooms
- 5655 rooms
- 1,0006 rooms
- 7977 rooms
- 5178 rooms
- 2109+ rooms
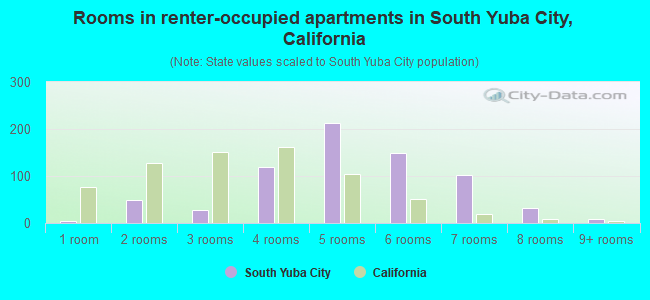
- Rooms in renter-occupied apartments in South Yuba City, California
- 51 room
- 482 rooms
- 283 rooms
- 1194 rooms
- 2135 rooms
- 1506 rooms
- 1037 rooms
- 318 rooms
- 99+ rooms
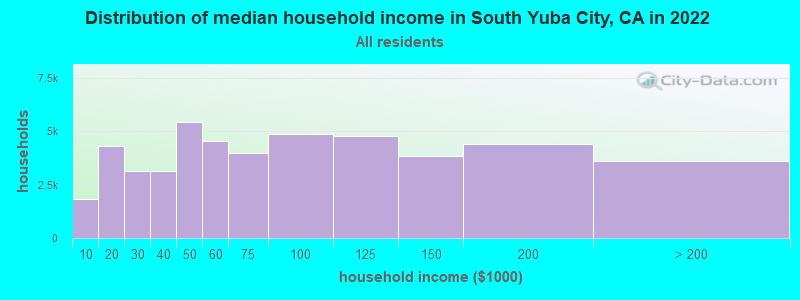
South Yuba City, CA household income distribution

- 1,843Less than $10,000
- 4,329$10,000 to $19,999
- 3,132$20,000 to $29,999
- 3,138$30,000 to $39,999
- 5,432$40,000 to $49,999
- 4,539$50,000 to $59,999
- 3,995$60,000 to $74,999
- 4,870$75,000 to $99,999
- 4,785$100,000 to $124,999
- 3,851$125,000 to $149,999
- 4,396$150,000 to $199,999
- 3,613$200,000 or more
Percentage of workers working in this county: 52.7%
Number of people working at home: 1,210 (17.2% of all workers)
Travel time to work (commute)
- Less than 5 minutes: 59
- 5 to 9 minutes: 749
- 10 to 14 minutes: 1,249
- 15 to 19 minutes: 972
- 20 to 24 minutes: 465
- 25 to 29 minutes: 86
- 30 to 34 minutes: 297
- 35 to 39 minutes: 95
- 40 to 44 minutes: 129
- 45 to 59 minutes: 570
- 60 to 89 minutes: 391
- 90 or more minutes: 227
Means of transportation to work:
- Drove a car alone: 4,493 (82.3%)
- Carpooled: 643 (11.8%)
- Bus or trolley bus: 38 (0.7%)
- Bicycle: 17 (0.3%)
- Walked: 48 (0.9%)
- Other means: 50 (0.9%)
- Worked at home: 167 (3.1%)
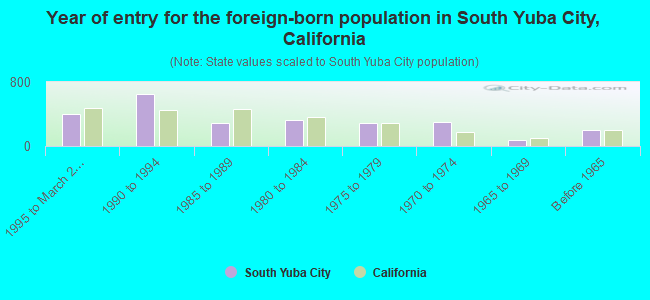
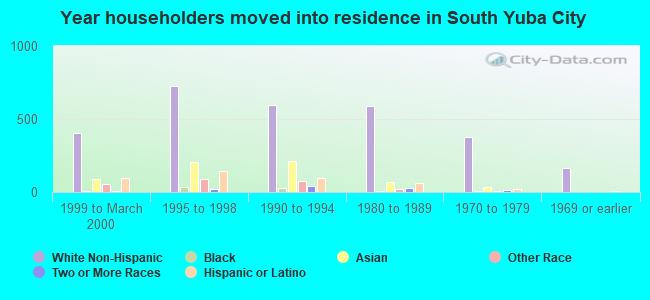
- Year of entry for the foreign-born population in South Yuba City, California
- 4011995 to March 2000
- 6491990 to 1994
- 2921985 to 1989
- 3241980 to 1984
- 2891975 to 1979
- 2961970 to 1974
- 761965 to 1969
- 204Before 1965
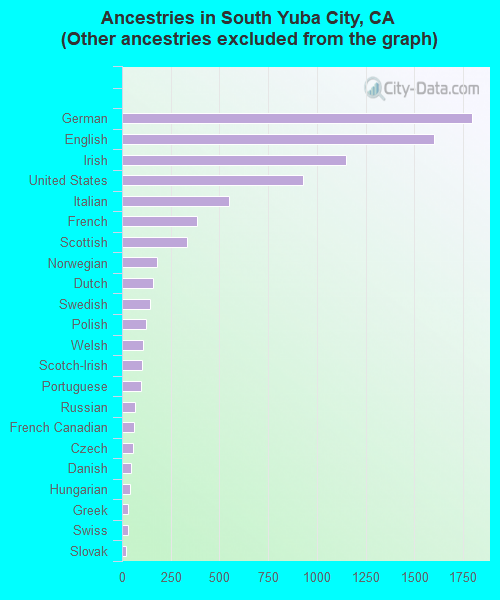
First ancestries reported:
- Other: 5,484 (40.6%)
- German: 1,794 (13.3%)
- English: 1,602 (11.8%)
- Irish: 1,151 (8.5%)
- United States: 928 (6.9%)
- Italian: 548 (4.1%)
- French: 384 (2.8%)
- Scottish: 336 (2.5%)
- Norwegian: 178 (1.3%)
- Dutch: 157 (1.2%)
- Swedish: 145 (1.1%)
- Polish: 121 (0.9%)
- Welsh: 106 (0.8%)
- Scotch-Irish: 105 (0.8%)
- Portuguese: 100 (0.7%)
- Russian: 65 (0.5%)
- French Canadian: 60 (0.4%)
- Czech: 57 (0.4%)
- Danish: 47 (0.3%)
- Hungarian: 39 (0.3%)
- Greek: 33 (0.2%)
- Swiss: 32 (0.2%)
- Slovak: 19 (0.1%)
- Subsaharan African: 15 (0.1%)
- Ukrainian: 13 (0.10%)
Most common places of birth for foreign-born residents (%):
| South Yuba City: | 67.0% (1,697) |
| California: | 2.2% (198,201) |
| South Yuba City: | 12.3% (311) |
| California: | 44.3% (3,928,701) |
| South Yuba City: | 3.5% (89) |
| California: | 7.5% (664,935) |
| South Yuba City: | 2.4% (62) |
| California: | 0.3% (28,978) |
| South Yuba City: | 2.0% (51) |
| California: | 1.1% (98,160) |
| South Yuba City: | 1.9% (48) |
| California: | 1.6% (141,181) |
| South Yuba City: | 1.7% (42) |
| California: | 1.5% (133,090) |
Place of birth for U.S.-born residents:
- This state: 7,103
- Other state: 3,086
- Northeast: 409
- Midwest: 763
- South: 1,036
- West: 878
59% of South Yuba City residents lived in the same house 5 years ago.
Out of people who lived in different houses, 59% lived in this county.
Out of people who lived in different counties, 82% lived in California.
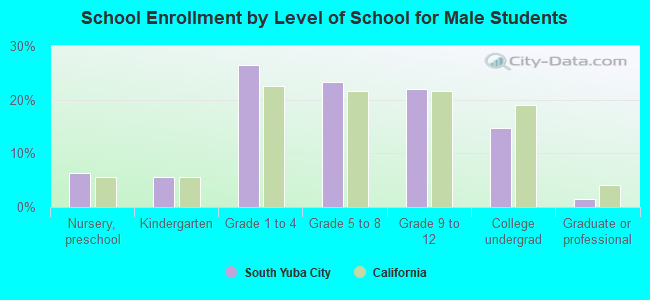
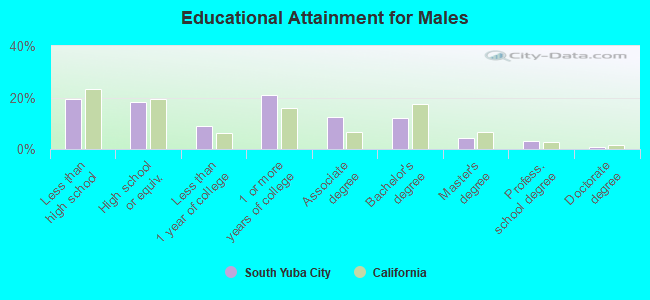
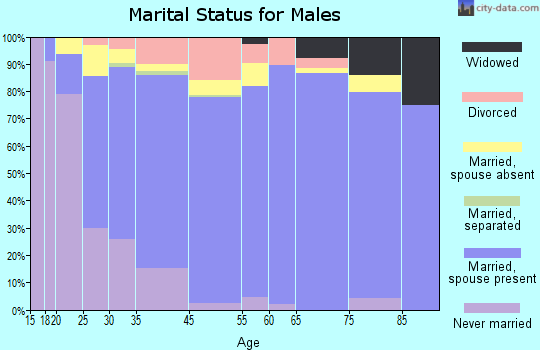
Education attainment for males 25 years and older:
- No schooling: 81
- Nursery to 4th grade: 6
- 5th and 6th grade: 123
- 7th and 8th grade: 78
- 9th grade: 75
- 10th grade: 222
- 11th grade: 9
- 12th grade, no diploma: 184
- High school graduate (or equivalency): 735
- Less than 1 year of college: 356
- Some college more than 1 year, no degree: 842
- Associate degree: 494
- Bachelor's degree: 484
- Master's degree: 165
- Professional school degree: 117
- Doctorate degree: 28
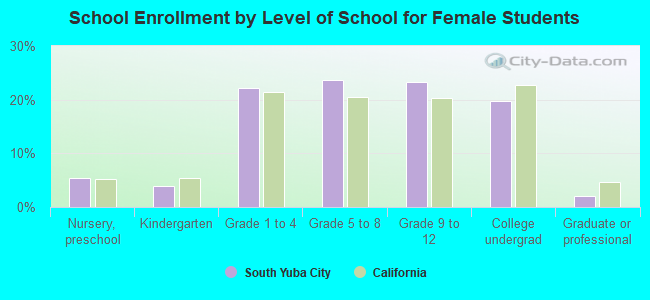
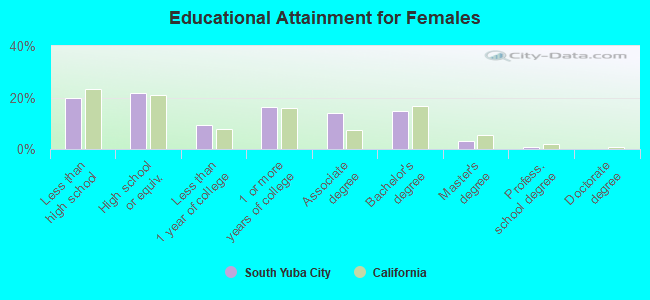
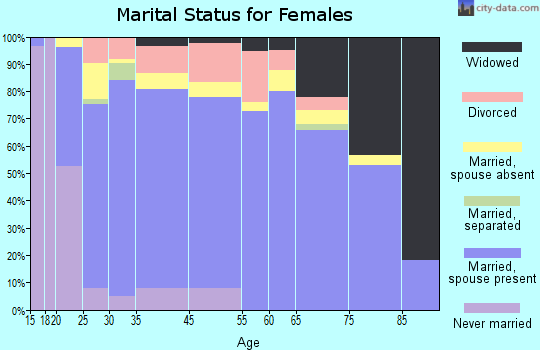
Education attainment for females 25 years and older:
- No schooling: 227
- Nursery to 4th grade: 31
- 5th and 6th grade: 78
- 7th and 8th grade: 88
- 9th grade: 49
- 10th grade: 139
- 11th grade: 48
- 12th grade, no diploma: 186
- High school graduate (or equivalency): 927
- Less than 1 year of college: 399
- Some college more than 1 year, no degree: 690
- Associate degree: 593
- Bachelor's degree: 626
- Master's degree: 134
- Professional school degree: 27
- Doctorate degree: 0
Housing units in structures:
- One, detached: 3,883
- One, attached: 167
- Two: 48
- 3 or 4: 41
- 5 to 9: 25
- 20 to 49: 22
- Mobile homes: 11
Median worth of mobile homes: $314,097
Housing units lacking complete kitchen facilities: 0.4%
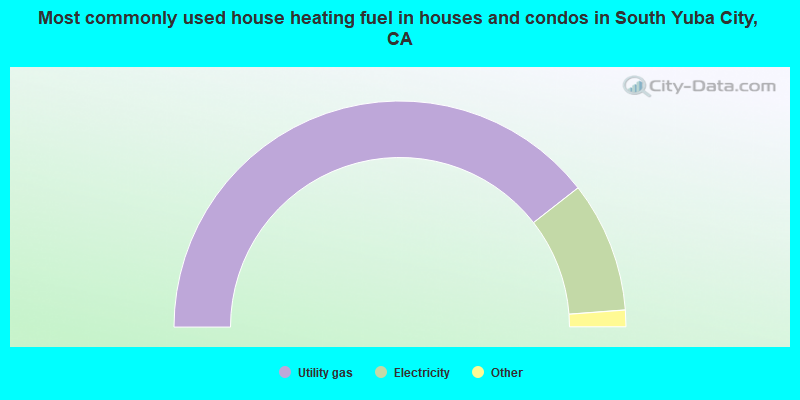
- 78.9%Utility gas
- 18.7%Electricity
- 1.2%Wood
- 0.9%Bottled, tank, or LP gas
- 0.3%Fuel oil, kerosene, etc.
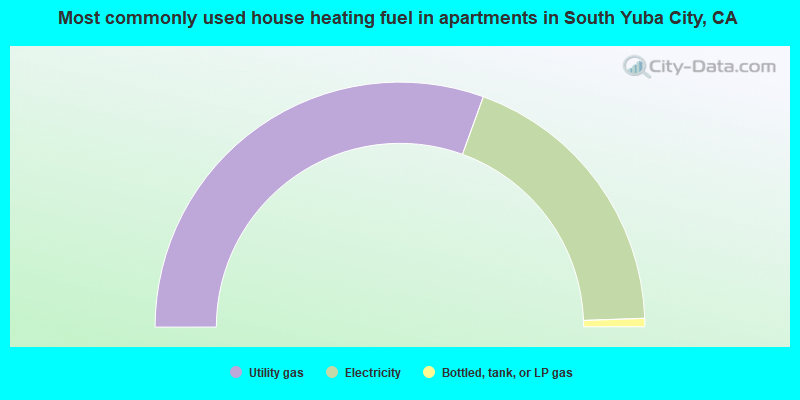
- 61.0%Utility gas
- 37.8%Electricity
- 1.1%Bottled, tank, or LP gas
Private vs. public school enrollment:
| Here: | 4.2% |
| California: | 9.9% |
| Here: | 7.9% |
| California: | 7.8% |
| Here: | 14.9% |
| California: | 15.4% |