South Tulsa, OK (Oklahoma) Houses and Residents
| South Tulsa: | $195,869 |
| Oklahoma: | $191,700 |
Total population: 17,377 (Urban population: 10,138 (1,823 inside urbanized areas, 8,315 inside urban clusters), Rural population: 6,600 (214 farm, 6,386 nonfarm))
Houses: 6,145 (5,843 occupied: 4,676 owner occupied, 1,167 renter occupied)
| % of renters here: | 20% |
| State: | 35% |
Housing density: 65 houses/condos per square mile
Median price asked for vacant for-sale houses and condos in 2022 in this county: $210,793.
Median contract rent in 2022: $787 (lower quartile is $585, upper quartile is $1,049)
Median rent asked for vacant for-rent units in 2022: $633
Median gross rent in South Tulsa, OK in 2022: $1,043
Housing units in South Tulsa with a mortgage: 2,760 (342 second mortgage, 223 home equity loan, 0 both second mortgage and home equity loan)
Houses without a mortgage: 705
Compare current foreclosures near South Tulsa, OK:
| Photo | Address | Area | Beds / Baths | Price | Details |
|---|---|---|---|---|---|

|
#1
S. 80th East Ave 27d
Tulsa, OK 74133
|
1,030 sq. feet
|
2 baths 1 beds |
$46,500
|
show details |

|
#2
S 161st West Ave
Sapulpa, OK 74066
|
- sq. feet
|
3 baths 5 beds |
$324,900
|
show details |

|
#3
S Umber St
Jenks, OK 74037
|
2,769 sq. feet
|
3 baths 4 beds |
show details | |

|
#4
N Water St
Sapulpa, OK 74066
|
1,926 sq. feet
|
2 baths 3 beds |
show details | |

|
#5
N 220 Rd
Beggs, OK 74421
|
1,352 sq. feet
|
2 baths 3 beds |
show details | |

|
#6
E 30th Pl
Tulsa, OK 74114
|
1,540 sq. feet
|
1 baths 3 beds |
show details | |

|
#7
W 140th St
Glenpool, OK 74033
|
2,176 sq. feet
|
1 baths 5 beds |
show details | |

|
#8
W 140th St
Glenpool, OK 74033
|
2,016 sq. feet
|
3 baths 3 beds |
show details | |

|
#9
N Main St
Sapulpa, OK 74066
|
1,494 sq. feet
|
2 baths 3 beds |
show details | |

|
#10
S 97th West Ave
Sapulpa, OK 74066
|
1,494 sq. feet
|
2 baths 3 beds |
show details |
| Photo | Address | Area | Beds / Baths | Price | Details |
|---|---|---|---|---|---|

|
#11
E 28th St
Tulsa, OK 74114
|
1,024 sq. feet
|
1 baths 2 beds |
show details | |

|
#12
E 105th Ct
Tulsa, OK 74133
|
4,335 sq. feet
|
3 baths 4 beds |
show details | |

|
#13
E 40th St
Tulsa, OK 74145
|
2,116 sq. feet
|
2 baths 4 beds |
show details | |

|
#14
E 100th St
Tulsa, OK 74133
|
2,155 sq. feet
|
2 baths 4 beds |
show details | |

|
#15
W Easton St
Tulsa, OK 74127
|
1,395 sq. feet
|
2 baths 4 beds |
show details | |

|
#16
E Archer St
Tulsa, OK 74115
|
- sq. feet
|
- baths - beds |
$26,900
|
show details |

|
#17
S 71st East Ave
Tulsa, OK 74112
|
2,054 sq. feet
|
2 baths 3 beds |
show details | |

|
#18
Los Angeles St
Broken Arrow, OK 74011
|
2,174 sq. feet
|
2 baths 4 beds |
show details | |

|
#19
E 18th St
Tulsa, OK 74120
|
2,570 sq. feet
|
2 baths 3 beds |
show details | |

|
#20
S 142nd East Ave
Tulsa, OK 74108
|
1,583 sq. feet
|
2 baths 3 beds |
show details |
| Photo | Address | Area | Beds / Baths | Price | Details |
|---|---|---|---|---|---|

|
#21
S Maybelle Ave
Tulsa, OK 74107
|
1,500 sq. feet
|
2 baths 3 beds |
show details | |

|
#22
E 47th St
Tulsa, OK 74145
|
1,014 sq. feet
|
1 baths 3 beds |
show details | |

|
#23
E Dewey Ave
Sapulpa, OK 74066
|
1,290 sq. feet
|
2 baths 3 beds |
show details | |

|
#24
E 17th Pl
Tulsa, OK 74104
|
1,583 sq. feet
|
1 baths 3 beds |
show details | |

|
#25
S Granite Ave
Tulsa, OK 74136
|
2,412 sq. feet
|
2 baths 3 beds |
show details | |

|
#26
W 182nd St S
Mounds, OK 74047
|
1,792 sq. feet
|
2 baths 4 beds |
show details | |

|
#27
E 176th St S
Bixby, OK 74008
|
1,766 sq. feet
|
3 baths 3 beds |
show details | |

|
#28
E 28th St
Tulsa, OK 74129
|
1,926 sq. feet
|
2 baths 3 beds |
show details | |

|
#29
E 86th St S
Broken Arrow, OK 74014
|
1,558 sq. feet
|
2 baths 4 beds |
show details | |

|
#30
N 19th St
Broken Arrow, OK 74012
|
1,437 sq. feet
|
2 baths 3 beds |
show details |
| Photo | Address | Area | Beds / Baths | Price | Details |
|---|---|---|---|---|---|

|
#31
W Galaxy Pl
Sapulpa, OK 74066
|
1,300 sq. feet
|
2 baths 3 beds |
show details | |

|
#32
W Muskogee Ave
Sapulpa, OK 74066
|
1,970 sq. feet
|
2 baths 4 beds |
show details | |

|
#33
S 213th East Ave
Broken Arrow, OK 74014
|
1,638 sq. feet
|
2 baths 3 beds |
show details | |

|
#34
W 171st St S
Sapulpa, OK 74066
|
1,624 sq. feet
|
2 baths 3 beds |
show details | |

|
#35
E Memphis St
Broken Arrow, OK 74014
|
2,446 sq. feet
|
2 baths 3 beds |
show details | |

|
#36
S Cedar St
Sapulpa, OK 74066
|
1,128 sq. feet
|
1 baths 3 beds |
show details | |

|
#37
E 38th Pl S
Broken Arrow, OK 74014
|
2,142 sq. feet
|
2 baths 3 beds |
show details | |

|
#38
S 210th East Ave
Broken Arrow, OK 74014
|
1,785 sq. feet
|
2 baths 3 beds |
show details | |

|
#39
N 220 Rd
Okmulgee, OK 74447
|
1,374 sq. feet
|
2 baths 3 beds |
show details | |

|
#40
Antigua Dr
Sand Springs, OK 74063
|
1,808 sq. feet
|
2 baths - beds |
show details |
| Photo | Address | Area | Beds / Baths | Price | Details |
|---|---|---|---|---|---|

|
#41
W 91st St
Tulsa, OK 74132
|
2,074 sq. feet
|
1 baths - beds |
show details | |

|
#42
Royal Oak Ln
Sapulpa, OK 74066
|
2,080 sq. feet
|
2 baths 3 beds |
show details | |

|
#43
Rockwood Dr
Kiefer, OK 74041
|
1,862 sq. feet
|
2 baths 3 beds |
show details | |

|
#44
E Dewey Ave
Sapulpa, OK 74066
|
1,460 sq. feet
|
1 baths 3 beds |
show details | |

|
#45
S Elm St
Sapulpa, OK 74066
|
1,286 sq. feet
|
1 baths 3 beds |
show details | |

|
#46
N Hodge St
Sapulpa, OK 74066
|
720 sq. feet
|
1 baths 2 beds |
show details | |

|
#47
Us Highway 64
Haskell, OK 74436
|
3,532 sq. feet
|
3 baths 2 beds |
show details | |

|
#48
S Linden St
Sapulpa, OK 74066
|
1,453 sq. feet
|
1 baths 3 beds |
show details | |

|
#49
Harreld Rd
Beggs, OK 74421
|
1,568 sq. feet
|
2 baths 4 beds |
show details | |

|
Check over 1 million property listings on Foreclosure.com!
|
browse all offers | |||

Household type by relationship:
Households: 593,586- In family households: 486,744 (105,729 male householders, 48,355 female householders)
109,594 spouses, 175,807 children (161,023 natural, 4,738 adopted, 10,046 stepchildren), 12,829 grandchildren, 5,805 brothers or sisters, 4,422 parents, foster children, 7,331 other relatives, 13,702 non-relatives
- In nonfamily households: 106,842 (41,297 male householders (32,323 living alone)), 46,356 female householders (39,944 living alone)), 19,189 nonrelatives
- In group quarters: 9,817 (5,670 institutionalized population)
95,860 married couples with children.
38,083 single-parent households (7,182 men, 30,901 women).
95.6% of residents of South Tulsa speak English at home.
3.0% of residents speak Spanish at home (72% speak English very well, 14% speak English well, 13% speak English not well, 2% don't speak English at all).
0.4% of residents speak other Indo-European language at home (95% speak English very well, 5% speak English not well).
0.4% of residents speak Asian or Pacific Island language at home (34% speak English very well, 34% speak English well, 32% speak English not well).
0.5% of residents speak other language at home (95% speak English very well, 5% speak English not well).
Foreign born population: 489 (2.4%)
(74.0% of them are naturalized citizens)
| Here: | 5.3 |
| State: | 6.1 |
| Here: | 4.1 |
| State: | 4.5 |

- Bedrooms in owner-occupied houses and condos in South Tulsa, Oklahoma
- 19no bedroom
- 671 bedroom
- 6202 bedrooms
- 3,2033 bedrooms
- 6854 bedrooms
- 825+ bedrooms

- Bedrooms in renter-occupied apartments in South Tulsa, Oklahoma
- 21no bedroom
- 1741 bedroom
- 4382 bedrooms
- 4893 bedrooms
- 424 bedrooms
- 35+ bedrooms

- Cars and other vehicles available in South Tulsa in owner-occupied houses/condos
- 147no vehicle
- 9701 vehicle
- 2,2892 vehicles
- 9553 vehicles
- 2284 vehicles
- 875+ vehicles

- Cars and other vehicles available in South Tulsa in renter-occupied apartments
- 112no vehicle
- 5191 vehicle
- 4302 vehicles
- 883 vehicles
- 184 vehicles
- 05+ vehicles

- Rooms in owner-occupied houses in South Tulsa, Oklahoma
- 111 room
- 282 rooms
- 853 rooms
- 3194 rooms
- 1,6995 rooms
- 1,3136 rooms
- 7077 rooms
- 3178 rooms
- 1979+ rooms

- Rooms in renter-occupied apartments in South Tulsa, Oklahoma
- 151 room
- 462 rooms
- 2093 rooms
- 3084 rooms
- 2975 rooms
- 2066 rooms
- 547 rooms
- 298 rooms
- 39+ rooms


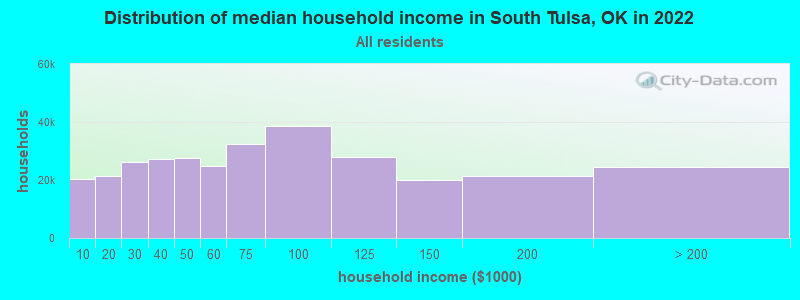
South Tulsa, OK household income distribution

- 20,361Less than $10,000
- 21,327$10,000 to $19,999
- 26,138$20,000 to $29,999
- 27,139$30,000 to $39,999
- 27,653$40,000 to $49,999
- 24,738$50,000 to $59,999
- 32,249$60,000 to $74,999
- 38,462$75,000 to $99,999
- 28,020$100,000 to $124,999
- 20,090$125,000 to $149,999
- 21,259$150,000 to $199,999
- 24,527$200,000 or more
Percentage of workers working in this county: 88.3%
Number of people working at home: 1,100 (11.0% of all workers)
Travel time to work (commute)
- Less than 5 minutes: 283
- 5 to 9 minutes: 735
- 10 to 14 minutes: 675
- 15 to 19 minutes: 860
- 20 to 24 minutes: 1,629
- 25 to 29 minutes: 884
- 30 to 34 minutes: 1,881
- 35 to 39 minutes: 247
- 40 to 44 minutes: 241
- 45 to 59 minutes: 358
- 60 to 89 minutes: 96
- 90 or more minutes: 166
Means of transportation to work:
- Drove a car alone: 6,891 (83.1%)
- Carpooled: 1,031 (12.4%)
- Motorcycle: 6 (0.1%)
- Walked: 82 (1.0%)
- Other means: 45 (0.5%)
- Worked at home: 235 (2.8%)


- Year of entry for the foreign-born population in South Tulsa, Oklahoma
- 331995 to March 2000
- 481990 to 1994
- 161985 to 1989
- 491980 to 1984
- 381975 to 1979
- 141970 to 1974
- 121965 to 1969
- 25Before 1965
Most common places of birth for foreign-born residents (%):
| South Tulsa: | 20.4% (48) |
| Oklahoma: | 42.5% (55,971) |
| South Tulsa: | 17.4% (41) |
| Oklahoma: | 2.4% (3,221) |
| South Tulsa: | 8.5% (20) |
| Oklahoma: | 1.6% (2,138) |
| South Tulsa: | 8.1% (19) |
| Oklahoma: | 0.6% (788) |
| South Tulsa: | 7.7% (18) |
| Oklahoma: | 4.7% (6,144) |
| South Tulsa: | 6.8% (16) |
| Oklahoma: | 0.4% (546) |
| South Tulsa: | 5.5% (13) |
| Oklahoma: | 0.2% (239) |
| South Tulsa: | 4.7% (11) |
| Oklahoma: | 0.3% (404) |
| South Tulsa: | 3.4% (8) |
| Oklahoma: | 0.3% (388) |
| South Tulsa: | 3.4% (8) |
| Oklahoma: | 0.6% (814) |
| South Tulsa: | 3.4% (8) |
| Oklahoma: | 2.8% (3,710) |
| South Tulsa: | 3.0% (7) |
| Oklahoma: | 0.0% (57) |
| South Tulsa: | 3.0% (7) |
| Oklahoma: | 0.3% (373) |
| South Tulsa: | 2.6% (6) |
| Oklahoma: | 0.1% (147) |
| South Tulsa: | 1.7% (4) |
| Oklahoma: | 0.4% (564) |
Place of birth for U.S.-born residents:
- This state: 11,356
- Other state: 5,088
- Northeast: 347
- Midwest: 1,799
- South: 1,791
- West: 1,151
52% of South Tulsa residents lived in the same house 5 years ago.
Out of people who lived in different houses, 65% lived in this county.
Out of people who lived in different counties, 62% lived in Oklahoma.
Education attainment for males 25 years and older:
- No schooling: 9
- Nursery to 4th grade: 22
- 5th and 6th grade: 50
- 7th and 8th grade: 119
- 9th grade: 93
- 10th grade: 146
- 11th grade: 181
- 12th grade, no diploma: 185
- High school graduate (or equivalency): 1,438
- Less than 1 year of college: 435
- Some college more than 1 year, no degree: 788
- Associate degree: 357
- Bachelor's degree: 708
- Master's degree: 158
- Professional school degree: 56
- Doctorate degree: 21

Education attainment for females 25 years and older:
- No schooling: 13
- Nursery to 4th grade: 3
- 5th and 6th grade: 31
- 7th and 8th grade: 230
- 9th grade: 110
- 10th grade: 148
- 11th grade: 202
- 12th grade, no diploma: 177
- High school graduate (or equivalency): 1,813
- Less than 1 year of college: 565
- Some college more than 1 year, no degree: 756
- Associate degree: 457
- Bachelor's degree: 684
- Master's degree: 210
- Professional school degree: 28
- Doctorate degree: 3


Housing units in structures:
- One, detached: 4,830
- One, attached: 141
- Two: 27
- 3 or 4: 129
- 5 to 9: 66
- 10 to 19: 55
- 20 to 49: 24
- 50 or more: 12
- Mobile homes: 852
- Boats, RVs, vans, etc.: 9
Median worth of mobile homes: $50,024
Housing units lacking complete kitchen facilities: 0.8%

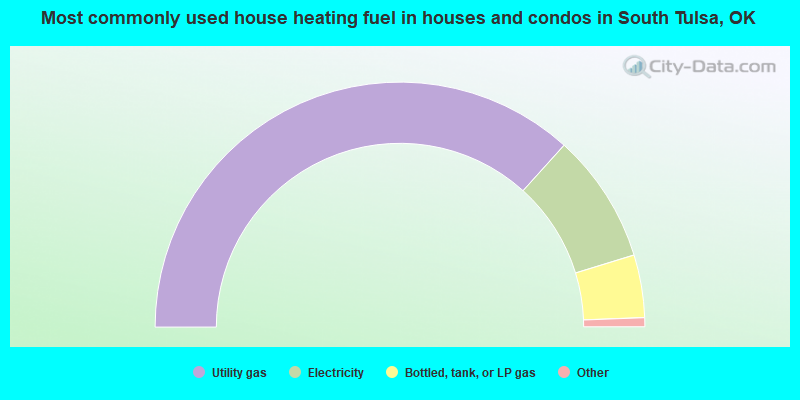
- 73.4%Utility gas
- 17.1%Electricity
- 8.3%Bottled, tank, or LP gas
- 0.6%Wood
- 0.4%Other fuel
- 0.1%Fuel oil, kerosene, etc.
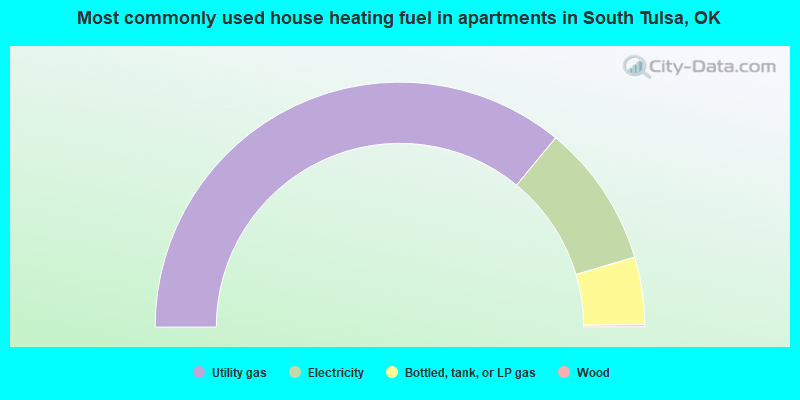
- 72.0%Utility gas
- 18.9%Electricity
- 8.9%Bottled, tank, or LP gas
- 0.3%Wood
Private vs. public school enrollment:
| Here: | 5.7% |
| Oklahoma: | 6.4% |
| Here: | 6.3% |
| Oklahoma: | 6.2% |
| Here: | 10.3% |
| Oklahoma: | 16.6% |


