Housing density: 3,227 houses/condos per square mile
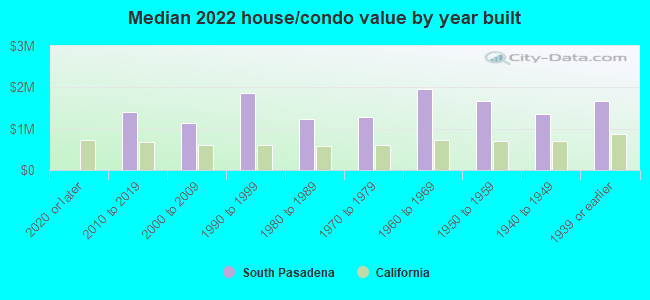
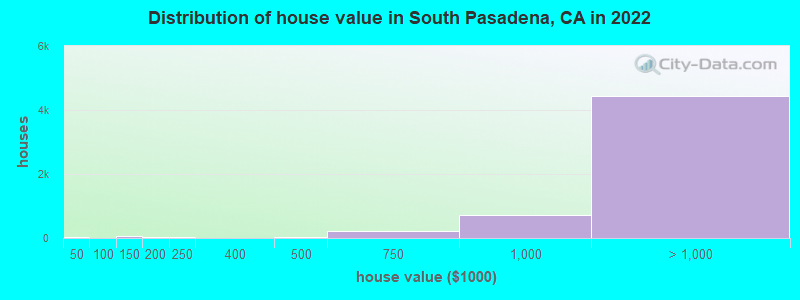
Median price asked for vacant for-sale houses and condos in 2022: $962,823.
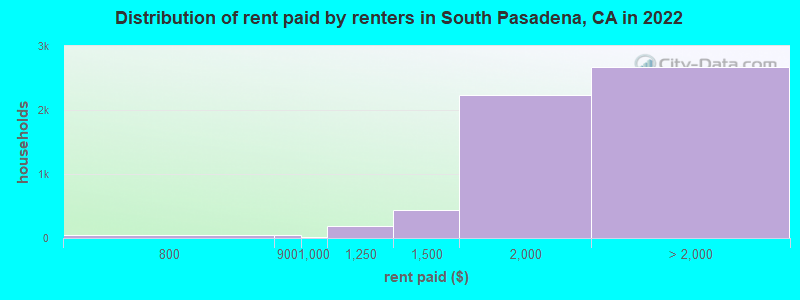
Median contract rent in 2022: $1,960 (lower quartile is $1,622, upper quartile is over $2,000)
Median rent asked for vacant for-rent units in 2022: $1,915
Median gross rent in South Pasadena, CA in 2022: over $2,000
Housing units in South Pasadena with a mortgage: 3,271 (425 second mortgage, 12 home equity loan, 358 both second mortgage and home equity loan) Houses without a mortgage: 95
Median household income for houses/condos with a mortgage: $228,006
Median household income for apartments without a mortgage: $122,658
Median monthly housing costs: $2,318
Compare current foreclosures near South Pasadena, CA:
4,582 married couples with children.
1,024 single-parent households (218 men, 806 women).
65.1% of residents of South Pasadena speak English at home.
10.6% of residents speak Spanish at home (83% speak English very well, 15% speak English well, 1% speak English not well).
3.8% of residents speak other Indo-European language at home (76% speak English very well, 21% speak English well, 3% speak English not well).
20.8% of residents speak Asian or Pacific Island language at home (57% speak English very well, 30% speak English well, 9% speak English not well, 3% don't speak English at all).
0.2% of residents speak other language at home (29% speak English very well, 71% speak English well).
Foreign born population: 6,349 (24.4%)
(65.2% of them are naturalized citizens)
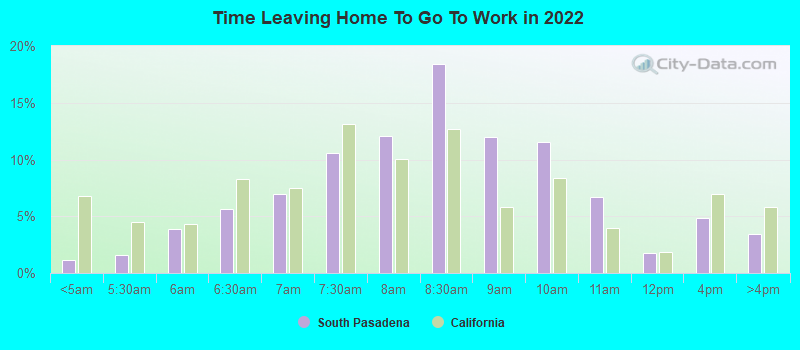
Percentage of workers working in this county: 98.2% Number of people working at home: 4,181 (30.2% of all workers)
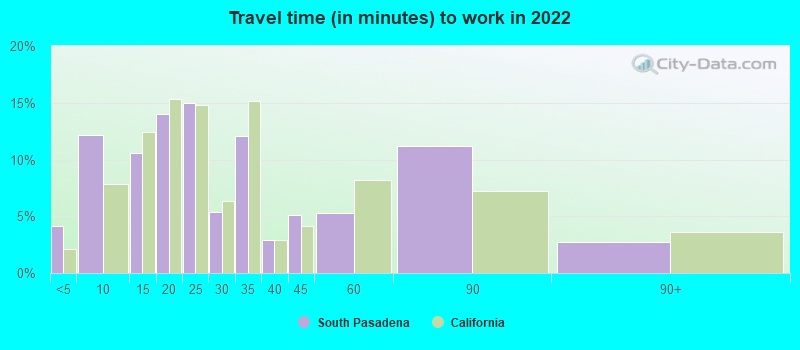
Travel time to work (commute)
Less than 5 minutes: 121
5 to 9 minutes: 693
10 to 14 minutes: 915
15 to 19 minutes: 1,258
20 to 24 minutes: 1,471
25 to 29 minutes: 744
30 to 34 minutes: 1,866
35 to 39 minutes: 275
40 to 44 minutes: 569
45 to 59 minutes: 1,152
60 to 89 minutes: 831
90 or more minutes: 230
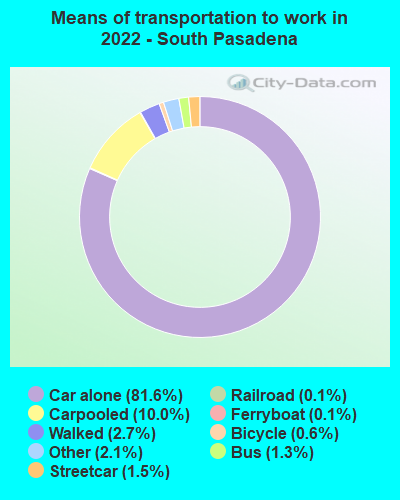
Means of transportation to work:
Drove a car alone: 4,346 (49.1%)
Carpooled: 591 (6.7%)
Bus: 62 (0.7%)
Subway or elevated rail: 60 (0.7%)
Light rail, streetcar or trolley: 3 (0.0%)
Ferryboat: 5 (0.1%)
Taxi: 122 (1.4%)
Bicycle: 31 (0.4%)
Walked: 156 (1.8%)
Worked at home: 4,181 (47.2%)
Unemployment by race in 2022
Unemployment rate for White non-Hispanic residents
5.0%Males
6.3%Females
Unemployment rate for Black residents
6.7%Females
Unemployment rate for American Indian and Alaska Native residents
53.8%Females
Unemployment rate for Asian residents
2.1%Males
0.6%Females
Unemployment rate for other race residents
6.6%Males
10.9%Females
Unemployment rate for two or more race residents
13.6%Males
1.7%Females
Unemployment rate for Hispanic or Latino residents
6.8%Males
5.6%Females
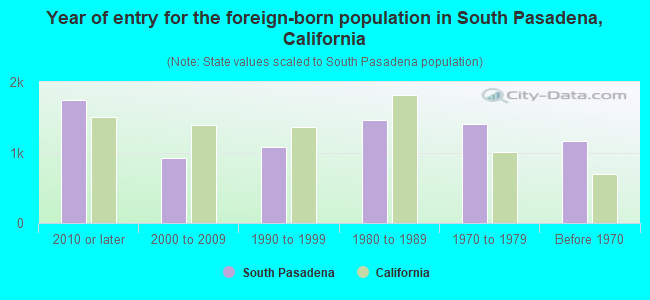
Year of entry for the foreign-born population in South Pasadena, California
1,7422010 or later
9212000 to 2009
1,0771990 to 1999
1,4681980 to 1989
1,4051970 to 1979
1,170Before 1970
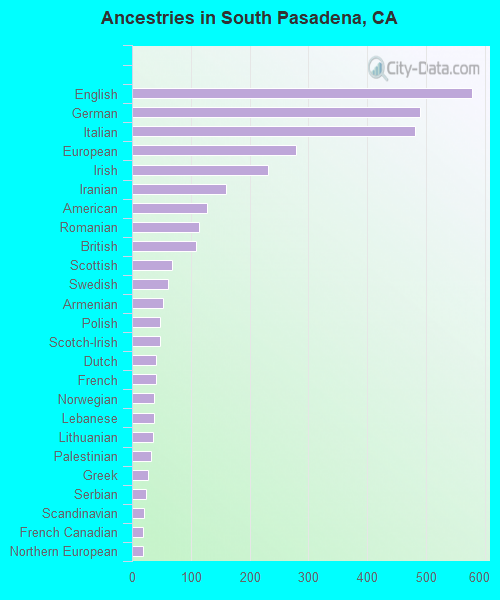
First ancestries reported:
English: 578 (4.1%)
German: 490 (3.5%)
Italian: 481 (3.4%)
European: 279 (2.0%)
Irish: 231 (1.7%)
Iranian: 160 (1.1%)
American: 127 (0.9%)
Romanian: 114 (0.8%)
British: 109 (0.8%)
Scottish: 68 (0.5%)
Swedish: 62 (0.4%)
Armenian: 52 (0.4%)
Polish: 47 (0.3%)
Scotch-Irish: 47 (0.3%)
Dutch: 40 (0.3%)
French: 40 (0.3%)
Norwegian: 38 (0.3%)
Lebanese: 37 (0.3%)
Lithuanian: 35 (0.3%)
Palestinian: 32 (0.2%)
Greek: 28 (0.2%)
Serbian: 24 (0.2%)
Scandinavian: 20 (0.1%)
French Canadian: 19 (0.1%)
Northern European: 18 (0.1%)
Portuguese: 18 (0.1%)
Russian: 16 (0.1%)
Australian: 13 (0.09%)
Eastern European: 12 (0.09%)
Trinidadian and Tobagonian: 12 (0.09%)
Welsh: 11 (0.08%)
Syrian: 9 (0.06%)
Danish: 9 (0.06%)
Jamaican: 9 (0.06%)
Slovak: 7 (0.05%)
Belgian: 6 (0.04%)
Ukrainian: 6 (0.04%)
Czech: 5 (0.04%)
Czechoslovakian: 3 (0.02%)
Most common places of birth for foreign-born residents (%):
China, excluding Hong Kong and Taiwan
South Pasadena:
21.5% (1,366)
California:
6.6% (684,672)
Korea
South Pasadena:
12.1% (770)
California:
3.0% (315,248)
Taiwan
South Pasadena:
7.5% (479)
California:
1.7% (176,274)
Philippines
South Pasadena:
7.3% (463)
California:
7.8% (818,297)
Japan
South Pasadena:
7.3% (461)
California:
1.0% (103,575)
Mexico
South Pasadena:
6.3% (397)
California:
37.2% (3,881,193)
Hong Kong
South Pasadena:
5.9% (373)
California:
1.0% (105,215)
Vietnam
South Pasadena:
2.8% (179)
California:
4.9% (512,335)
Canada
South Pasadena:
2.6% (165)
California:
1.2% (127,477)
Iran
South Pasadena:
2.5% (159)
California:
2.0% (206,004)
India
South Pasadena:
2.5% (158)
California:
5.2% (539,184)
England
South Pasadena:
1.7% (106)
California:
0.6% (57,953)
Place of birth for U.S.-born residents:
This state: 13,448
Other state: 5,872
Northeast: 2,145
Midwest: 1,721
South: 1,245
West: 769
89.1% of South Pasadena residents lived in the same house 1 years ago. Out of people who lived in different houses, 40.8% lived in this county. Out of people who lived in different counties, 24.0% lived in California.
South Pasadena:
89.1%
State average:
88.9%
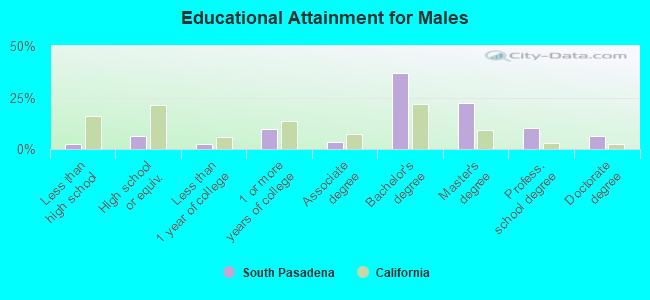
Education attainment for males 25 years and older:
No schooling: 69
Nursery to 4th grade: 0
5th and 6th grade: 7
7th and 8th grade: 29
9th grade: 14
10th grade: 6
11th grade: 26
12th grade, no diploma: 63
High school graduate (or equivalency): 598
Less than 1 year of college: 224
Some college more than 1 year, no degree: 890
Associate degree: 333
Bachelor's degree: 3,379
Master's degree: 2,075
Professional school degree: 918
Doctorate degree: 565
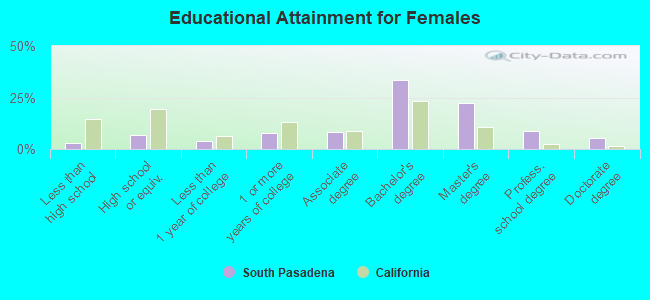
Education attainment for females 25 years and older:
No schooling: 127
Nursery to 4th grade: 0
5th and 6th grade: 17
7th and 8th grade: 48
9th grade: 19
10th grade: 2
11th grade: 31
12th grade, no diploma: 60
High school graduate (or equivalency): 673
Less than 1 year of college: 410
Some college more than 1 year, no degree: 789
Associate degree: 821
Bachelor's degree: 3,421
Master's degree: 2,291
Professional school degree: 895
Doctorate degree: 558
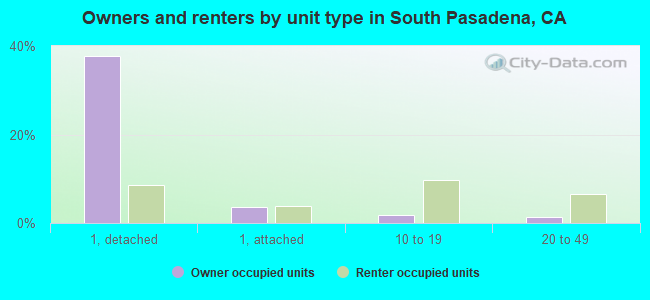
Housing units in structures:
One, detached: 5,201
One, attached: 804
Two: 442
3 or 4: 1,066
5 to 9: 1,159
10 to 19: 1,267
20 to 49: 873
50 or more: 282
Housing units lacking complete plumbing facilities in 2022: 1.2%
Housing units lacking complete kitchen facilities in 2022: 2.6%
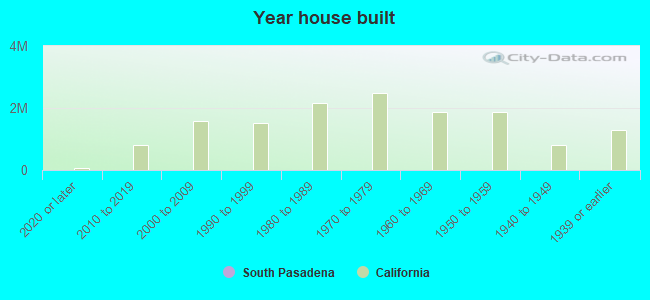
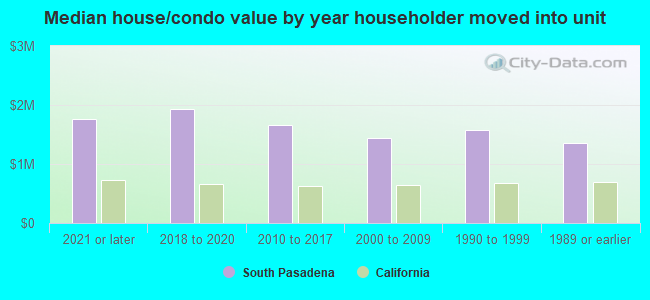
House/condo owner moved in on average 19 years ago