South Jordan, UT (Utah) Houses and Residents
| South Jordan: | $642,600 |
| Utah: | $499,500 |
Total population: 62,781 (Urban population: 29,021, Rural population: 440 (all nonfarm))
Houses: 28,192 (27,734 occupied: 22,329 owner occupied, 5,405 renter occupied)
| % of renters here: | 19% |
| State: | 29% |
Housing density: 1,351 houses/condos per square mile
Median price asked for vacant for-sale houses and condos in 2022: $796,484.
Median contract rent in 2022: $1,732 (lower quartile is $1,419, upper quartile is over $2,000)
Median rent asked for vacant for-rent units in 2022: $2,309
Median gross rent in South Jordan, UT in 2022: $1,841
Housing units in South Jordan with a mortgage: 17,144 (2,633 second mortgage, 0 home equity loan, 2,576 both second mortgage and home equity loan)
Houses without a mortgage: 248
Median household income for houses/condos with a mortgage: $147,980
Median household income for apartments without a mortgage: $116,351
Median monthly housing costs: $1,827
Compare current foreclosures in South Jordan, UT:
| Photo | Address | Area | Beds / Baths | Price | Details |
|---|---|---|---|---|---|

|
#1
W Winter Creek Cir
South Jordan, UT 84095
|
2,533 sq. feet
|
3 baths 6 beds |
show details | |

|
#2
W 10950 S
South Jordan, UT 84095
|
2,510 sq. feet
|
2 baths 3 beds |
show details | |

|
#3
W 10740 S
South Jordan, UT 84095
|
1,596 sq. feet
|
2 baths 3 beds |
show details | |

|
#4
S 2200 W
South Jordan, UT 84095
|
2,051 sq. feet
|
1 baths 2 beds |
show details | |

|
#5
S 1185 W
South Jordan, UT 84095
|
1,876 sq. feet
|
4 baths 5 beds |
show details | |

|
#6
W 11770 S
South Jordan, UT 84095
|
2,792 sq. feet
|
3 baths 6 beds |
show details | |

|
#7
S Woodfield Rd
South Jordan, UT 84095
|
2,237 sq. feet
|
2 baths 4 beds |
show details | |

|
#8
W Bonanza Cir
South Jordan, UT 84095
|
3,093 sq. feet
|
4 baths 5 beds |
show details | |

|
#9
S Eden Crest Rd
South Jordan, UT 84095
|
1,686 sq. feet
|
2 baths 3 beds |
show details | |

|
#10
W 11800 S
South Jordan, UT 84095
|
1,495 sq. feet
|
2 baths 3 beds |
show details |
| Photo | Address | Area | Beds / Baths | Price | Details |
|---|---|---|---|---|---|

|
#11
W Cornish Cir
South Jordan, UT 84095
|
1,979 sq. feet
|
2 baths 3 beds |
show details | |

|
#12
W Rustic Roads Dr
South Jordan, UT 84095
|
2,404 sq. feet
|
3 baths 6 beds |
show details | |

|
#13
S Via Bonito Dr
South Jordan, UT 84095
|
3,037 sq. feet
|
2 baths 4 beds |
show details | |

|
#14
S 3970 W
South Jordan, UT 84095
|
2,370 sq. feet
|
2 baths 4 beds |
show details | |

|
#15
W Banner Dr # B
South Jordan, UT 84095
|
2,666 sq. feet
|
2 baths 4 beds |
show details | |

|
#16
S 2865 W
South Jordan, UT 84095
|
2,878 sq. feet
|
2 baths 5 beds |
show details | |

|
#17
S 2330 W
South Jordan, UT 84095
|
3,809 sq. feet
|
2 baths 4 beds |
show details | |

|
#18
W Spruce Leaf Cir
South Jordan, UT 84095
|
2,634 sq. feet
|
2 baths 4 beds |
show details | |

|
#19
W Donibristle Cir
South Jordan, UT 84095
|
2,996 sq. feet
|
2 baths 4 beds |
show details | |

|
#20
W Wynview Ln
South Jordan, UT 84095
|
2,156 sq. feet
|
2 baths 4 beds |
show details |
| Photo | Address | Area | Beds / Baths | Price | Details |
|---|---|---|---|---|---|

|
#21
S Waterside Rd
South Jordan, UT 84095
|
4,141 sq. feet
|
4 baths 6 beds |
show details | |

|
#22
W 10950 S
South Jordan, UT 84095
|
1,294 sq. feet
|
1 baths 3 beds |
show details | |

|
#23
W Jacinda Ln
South Jordan, UT 84095
|
1,471 sq. feet
|
2 baths 2 beds |
show details | |

|
#24
W Canterwood Dr
South Jordan, UT 84095
|
2,132 sq. feet
|
2 baths 5 beds |
show details | |

|
#25
W 9525 S
South Jordan, UT 84095
|
1,786 sq. feet
|
2 baths 3 beds |
show details | |

|
#26
W 9685 S
South Jordan, UT 84095
|
2,792 sq. feet
|
4 baths 6 beds |
show details | |

|
#27
W Sweet Blossom Dr
South Jordan, UT 84095
|
2,932 sq. feet
|
2 baths 4 beds |
show details | |

|
#28
S Cadbury Dr
South Jordan, UT 84095
|
1,857 sq. feet
|
2 baths 3 beds |
show details | |

|
#29
S 1630 W
South Jordan, UT 84095
|
3,043 sq. feet
|
3 baths 6 beds |
show details | |

|
#30
W Periwinkle Dr
South Jordan, UT 84095
|
- sq. feet
|
- baths - beds |
show details |
| Photo | Address | Area | Beds / Baths | Price | Details |
|---|---|---|---|---|---|

|
#31
W Calton Ln Unit 109
South Jordan, UT 84095
|
- sq. feet
|
- baths - beds |
show details | |

|
#32
W Frogs Leap Dr Apt 5307
South Jordan, UT 84095
|
- sq. feet
|
- baths - beds |
show details | |

|
#33
W Sage Willow Dr
South Jordan, UT 84095
|
- sq. feet
|
- baths - beds |
show details | |

|
#34
W Frogs Leap Dr Apt 1311
South Jordan, UT 84095
|
- sq. feet
|
- baths - beds |
show details | |

|
#35
S Split Rock Dr
South Jordan, UT 84095
|
- sq. feet
|
- baths - beds |
show details | |

|
#36
W Cave Run Ln
South Jordan, UT 84095
|
- sq. feet
|
- baths - beds |
show details | |

|
#37
W Fontana Way Unit F308
South Jordan, UT 84095
|
- sq. feet
|
- baths - beds |
show details | |

|
#38
W Frogs Leap Dr Apt 4207
South Jordan, UT 84095
|
- sq. feet
|
- baths - beds |
show details | |

|
#39
W Rain Lily Dr
South Jordan, UT 84009
|
- sq. feet
|
- baths - beds |
show details | |

|
#40
W South Jordan Pkwy Unit 110
South Jordan, UT 84095
|
- sq. feet
|
- baths - beds |
show details |
| Photo | Address | Area | Beds / Baths | Price | Details |
|---|---|---|---|---|---|

|
#41
S Dunsinane Dr
South Jordan, UT 84095
|
- sq. feet
|
- baths - beds |
show details | |

|
#42
S Boardwalk Rd, Unit 94
South Jordan, UT 84009
|
- sq. feet
|
- baths - beds |
show details | |

|
#43
W Meadow Grass Dr
South Jordan, UT 84009
|
- sq. feet
|
- baths - beds |
show details | |

|
#44
S Pine Shadow Rd
South Jordan, UT 84095
|
- sq. feet
|
- baths - beds |
show details | |

|
#45
W Arranmore Dr
South Jordan, UT 84009
|
- sq. feet
|
- baths - beds |
show details | |

|
#46
S River Heights Dr
South Jordan, UT 84095
|
- sq. feet
|
- baths - beds |
show details | |

|
#47
S Copper Point Way
South Jordan, UT 84095
|
- sq. feet
|
- baths - beds |
show details | |

|
#48
W Dock St
South Jordan, UT 84095
|
- sq. feet
|
- baths - beds |
show details | |

|
#49
W Bari Way Unit B204
South Jordan, UT 84095
|
- sq. feet
|
- baths - beds |
show details | |

|
Check over 1 million property listings on Foreclosure.com!
|
browse all offers | |||


 | Where are all the rental houses? (4 replies) |
| Need multigenerational family home (2 replies) |
| Nicest areas with apartments for a young professional? (10 replies) |
| Where to live near South Jordan (5 replies) |
| Housing condition and landscaping (17 replies) |
| Sites to find houses for rent? (6 replies) |
Median year apartment built: 2011
Household type by relationship:
Households: 83,520- Male householders: 15,036 (1,369 living alone), Female householders: 12,698 (2,908 living alone)
18,321 spouses (17,715 opposite-sex spouses), 1,379 unmarried partners, (1,379 opposite-sex unmarried partners), 29,086 children (26,124 natural, 1,179 adopted, 1,783 stepchildren), 1,660 grandchildren, 158 brothers or sisters, 571 parents, 58 foster children, 1,098 other relatives, 3,289 non-relatives
- In group quarters: 166
Size of family households: 7,627 2-persons, 4,463 3-persons, 3,677 4-persons, 3,101 5-persons, 1,715 6-persons, 690 7-or-more-persons.
Size of nonfamily households: 4,277 1-person, 1,123 2-persons, 367 3-persons, 694 4-persons.
20,598 married couples with children.
2,309 single-parent households (739 men, 1,570 women).
88.2% of residents of South Jordan speak English at home.
5.3% of residents speak Spanish at home (74% speak English very well, 16% speak English well, 9% speak English not well, 1% don't speak English at all).
2.2% of residents speak other Indo-European language at home (80% speak English very well, 12% speak English well, 5% speak English not well, 3% don't speak English at all).
3.2% of residents speak Asian or Pacific Island language at home (78% speak English very well, 15% speak English well, 5% speak English not well, 2% don't speak English at all).
0.3% of residents speak other language at home (100% speak English very well).
Foreign born population: 5,767 (6.9%)
(55.3% of them are naturalized citizens)
| Here: | 10.0 |
| State: | 7.6 |
| Here: | 3.5 |
| State: | 4.3 |
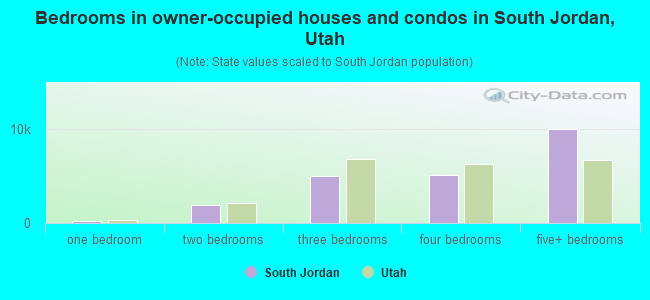
- Bedrooms in owner-occupied houses and condos in South Jordan, Utah
- 0no bedroom
- 1921 bedroom
- 1,9562 bedrooms
- 5,0073 bedrooms
- 5,1214 bedrooms
- 10,0535+ bedrooms
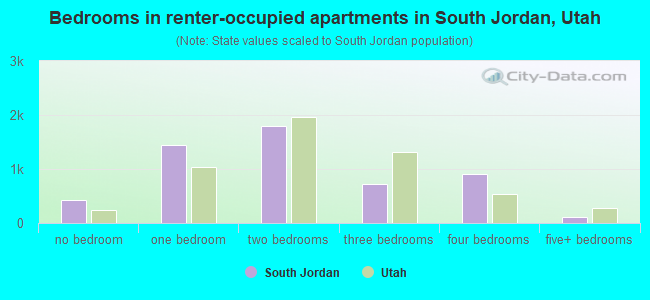
- Bedrooms in renter-occupied apartments in South Jordan, Utah
- 418no bedroom
- 1,4521 bedroom
- 1,8012 bedrooms
- 7183 bedrooms
- 9054 bedrooms
- 1115+ bedrooms
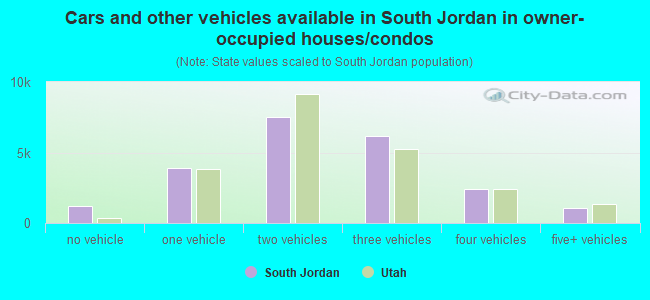
- Cars and other vehicles available in South Jordan in owner-occupied houses/condos
- 1,235no vehicle
- 3,9131 vehicle
- 7,5292 vehicles
- 6,1573 vehicles
- 2,4444 vehicles
- 1,0515+ vehicles
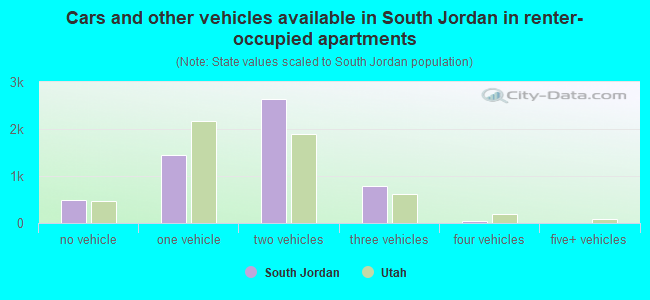
- Cars and other vehicles available in South Jordan in renter-occupied apartments
- 488no vehicle
- 1,4461 vehicle
- 2,6392 vehicles
- 7893 vehicles
- 434 vehicles
- 05+ vehicles
- Rooms in owner-occupied houses in South Jordan, Utah
- 01 room
- 1432 rooms
- 8133 rooms
- 1,2174 rooms
- 1,5615 rooms
- 2,1766 rooms
- 2,5397 rooms
- 2,6478 rooms
- 11,2339+ rooms
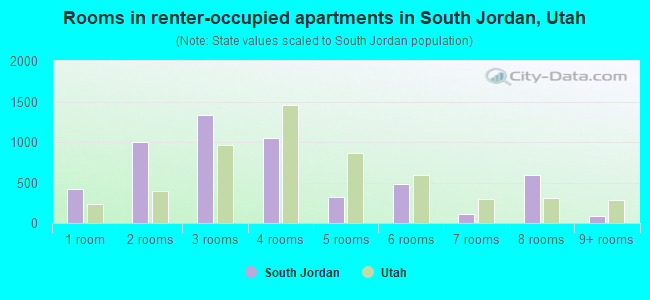
- Rooms in renter-occupied apartments in South Jordan, Utah
- 4181 room
- 1,0042 rooms
- 1,3373 rooms
- 1,0524 rooms
- 3275 rooms
- 4836 rooms
- 1117 rooms
- 5908 rooms
- 839+ rooms
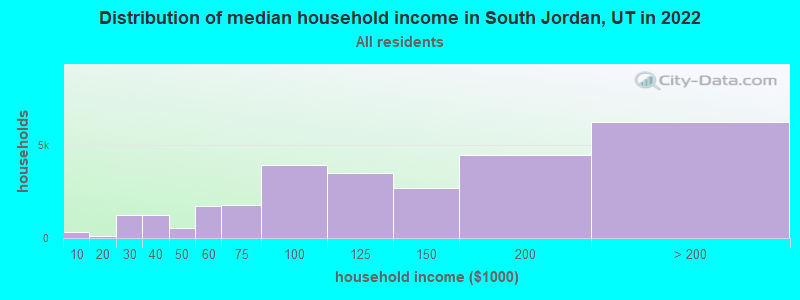
South Jordan, UT household income distribution

- 347Less than $10,000
- 118$10,000 to $19,999
- 1,213$20,000 to $29,999
- 1,237$30,000 to $39,999
- 533$40,000 to $49,999
- 1,729$50,000 to $59,999
- 1,768$60,000 to $74,999
- 3,941$75,000 to $99,999
- 3,486$100,000 to $124,999
- 2,669$125,000 to $149,999
- 4,448$150,000 to $199,999
- 6,245$200,000 or more
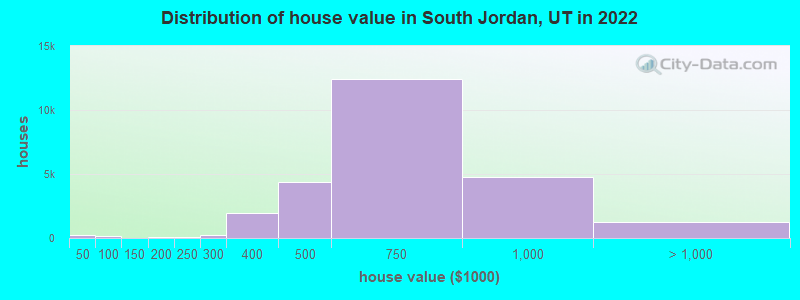
Home value of owner - occupied houses in 2022 in South Jordan, UT
-
- 134Less than $10,000
- 37$35,000 to $39,999
- 33$40,000 to $49,999
- 55$70,000 to $79,999
- 22$80,000 to $89,999
- 13$90,000 to $99,999
- 27$100,000 to $124,999
- 92$150,000 to $174,999
- 22$175,000 to $199,999
- 86$200,000 to $249,999
- 214$250,000 to $299,999
- 1,955$300,000 to $399,999
- 4,382$400,000 to $499,999
- 12,450$500,000 to $749,999
- 4,758$750,000 to $999,999
- 984$1,000,000 to $1,499,999
- 123$1,500,000 to $1,999,999
- 135$2,000,000 or more
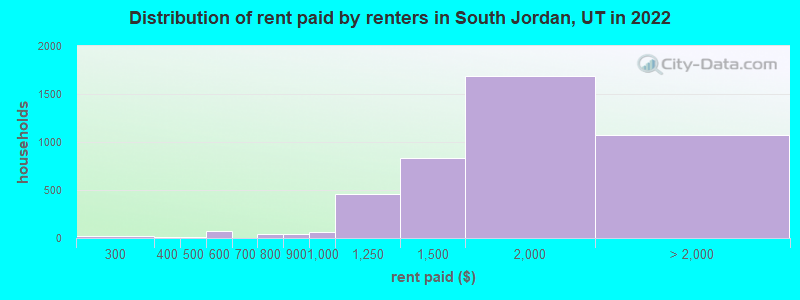
Rent paid by renters in 2022 in South Jordan, UT
-
- 13$200 to $249
- 8$250 to $299
- 11$300 to $349
- 10$400 to $449
- 72$550 to $599
- 4$650 to $699
- 44$700 to $749
- 36$800 to $899
- 57$900 to $999
- 456$1,000 to $1,249
- 837$1,250 to $1,499
- 1,683$1,500 to $1,999
- 832$2,000 to $2,499
- 43$2,500 to $2,999
- 44$3,000 to $3,499
- 61$3,500 or more
- 90No cash rent
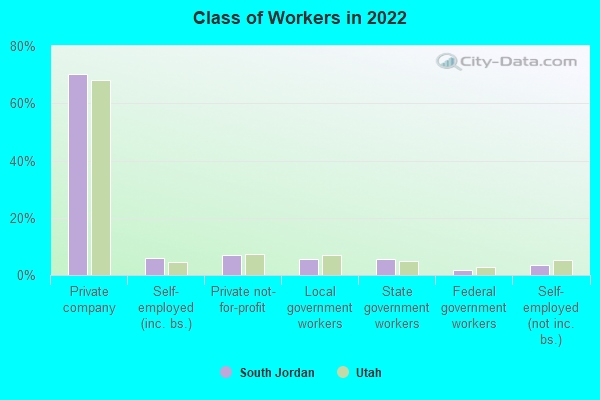
Percentage of workers working in this county: 93.0%
Number of people working at home: 9,099 (22.5% of all workers)
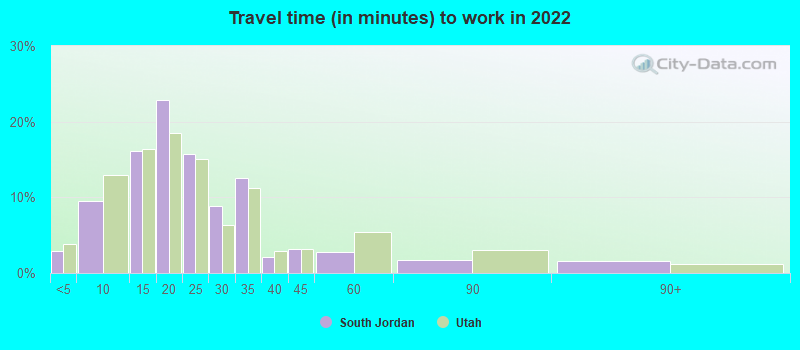
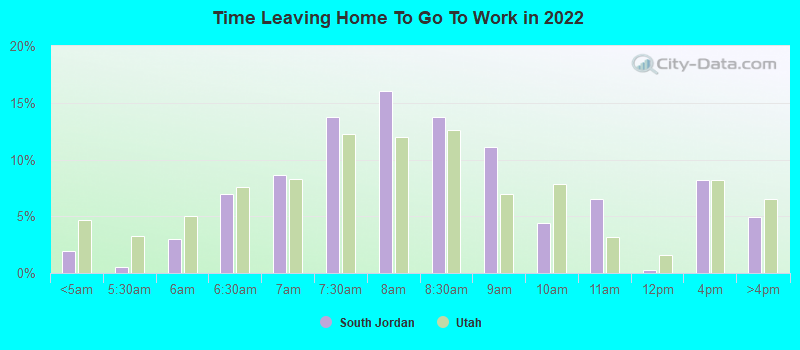
Travel time to work (commute)
- Less than 5 minutes: 1,130
- 5 to 9 minutes: 2,310
- 10 to 14 minutes: 4,193
- 15 to 19 minutes: 5,189
- 20 to 24 minutes: 5,813
- 25 to 29 minutes: 3,248
- 30 to 34 minutes: 4,681
- 35 to 39 minutes: 2,030
- 40 to 44 minutes: 2,702
- 45 to 59 minutes: 2,067
- 60 to 89 minutes: 1,019
- 90 or more minutes: 0
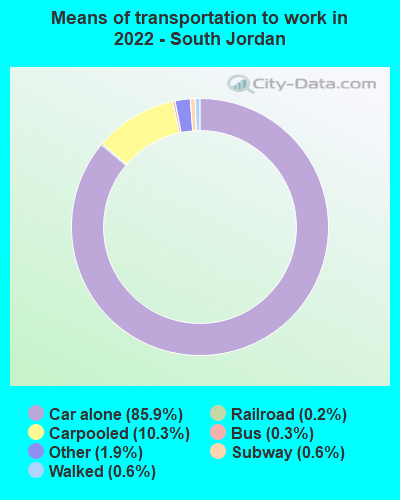
Means of transportation to work:
- Drove a car alone: 20,560 (63.9%)
- Carpooled: 2,656 (8.3%)
- Bus: 59 (0.2%)
- Subway or elevated rail: 12 (0.0%)
- Long-distance train or commuter rail: 83 (0.3%)
- Light rail, streetcar or trolley: 42 (0.1%)
- Ferryboat: 4 (0.0%)
- Taxi: 459 (1.4%)
- Bicycle: 16 (0.0%)
- Walked: 156 (0.5%)
- Worked at home: 9,099 (28.3%)
- Unemployment by race in 2022
- Unemployment rate for White non-Hispanic residents
- 1.5%Males
- 0.8%Females
- Unemployment rate for American Indian and Alaska Native residents
- 19.4%Males
- Unemployment rate for Asian residents
- 3.2%Males
- 0.5%Females
- Unemployment rate for other race residents
- 4.8%Females
- Unemployment rate for two or more race residents
- 2.7%Males
- 2.8%Females
- Unemployment rate for Hispanic or Latino residents
- 0.9%Males
- 1.4%Females
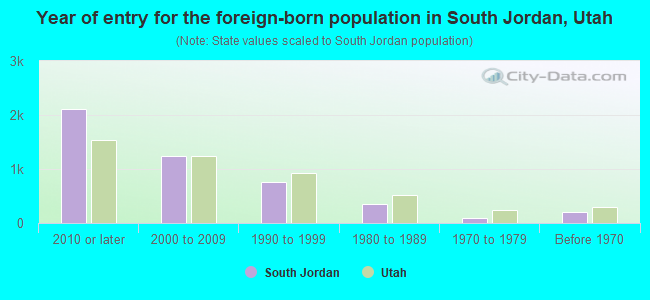
- Year of entry for the foreign-born population in South Jordan, Utah
- 2,1122010 or later
- 1,2352000 to 2009
- 7551990 to 1999
- 3531980 to 1989
- 951970 to 1979
- 198Before 1970
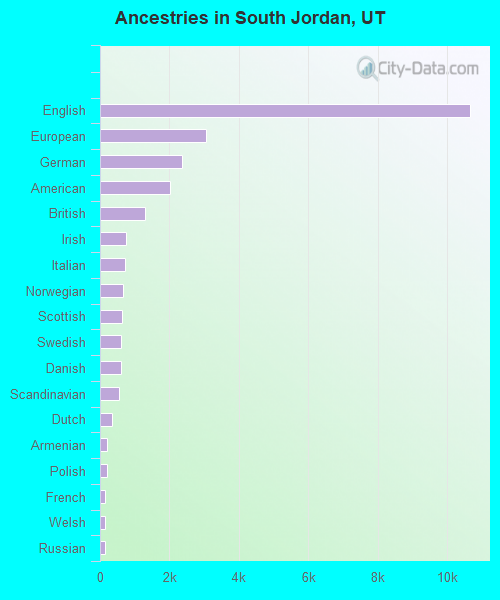
First ancestries reported:
- English: 10,670 (29.3%)
- European: 3,061 (8.4%)
- German: 2,360 (6.5%)
- American: 2,004 (5.5%)
- British: 1,285 (3.5%)
- Irish: 754 (2.1%)
- Italian: 732 (2.0%)
- Norwegian: 655 (1.8%)
- Scottish: 620 (1.7%)
- Swedish: 614 (1.7%)
- Danish: 602 (1.7%)
- Scandinavian: 555 (1.5%)
- Dutch: 355 (1.0%)
- Armenian: 206 (0.6%)
- Polish: 201 (0.6%)
- French: 156 (0.4%)
- Welsh: 153 (0.4%)
- Russian: 139 (0.4%)
- Swiss: 95 (0.3%)
- Brazilian: 87 (0.2%)
- Greek: 84 (0.2%)
- Northern European: 81 (0.2%)
- Finnish: 73 (0.2%)
- Scotch-Irish: 71 (0.2%)
- Palestinian: 62 (0.2%)
- Canadian: 56 (0.2%)
- Iranian: 48 (0.1%)
- Belgian: 46 (0.1%)
- Czechoslovakian: 31 (0.09%)
- Eastern European: 27 (0.07%)
- Lebanese: 26 (0.07%)
- Belizean: 21 (0.06%)
- Israeli: 20 (0.05%)
- Basque: 18 (0.05%)
- Ukrainian: 18 (0.05%)
- Austrian: 16 (0.04%)
- Romanian: 14 (0.04%)
- Portuguese: 12 (0.03%)
- Somali: 12 (0.03%)
- French Canadian: 10 (0.03%)
- Sudanese: 7 (0.02%)
- Croatian: 6 (0.02%)
- Australian: 6 (0.02%)
- Icelander: 4 (0.01%)
Most common places of birth for foreign-born residents (%):
| South Jordan: | 14.9% (783) |
| Utah: | 3.0% (8,294) |
| South Jordan: | 13.2% (693) |
| Utah: | 36.1% (99,740) |
| South Jordan: | 9.4% (496) |
| Utah: | 3.2% (8,804) |
| South Jordan: | 5.7% (299) |
| Utah: | 1.6% (4,524) |
| South Jordan: | 5.0% (263) |
| Utah: | 2.9% (8,017) |
| South Jordan: | 4.3% (225) |
| Utah: | 2.9% (7,901) |
| South Jordan: | 3.9% (203) |
| Utah: | 3.0% (8,341) |
| South Jordan: | 3.5% (183) |
| Utah: | 2.1% (5,902) |
| South Jordan: | 3.3% (172) |
| Utah: | 2.6% (7,211) |
| South Jordan: | 3.0% (156) |
| Utah: | 2.7% (7,472) |
| South Jordan: | 2.2% (115) |
| Utah: | 2.8% (7,644) |
| South Jordan: | 2.1% (112) |
| Utah: | 0.3% (865) |
| South Jordan: | 2.1% (108) |
| Utah: | 2.3% (6,468) |
| South Jordan: | 1.8% (97) |
| Utah: | 0.4% (1,021) |
| South Jordan: | 1.7% (89) |
| Utah: | 0.6% (1,555) |
| South Jordan: | 1.6% (85) |
| Utah: | 0.1% (198) |
| South Jordan: | 1.6% (83) |
| Utah: | 0.1% (351) |
Place of birth for U.S.-born residents:
- This state: 51,452
- Other state: 25,600
- Northeast: 2,792
- Midwest: 5,728
- South: 4,146
- West: 12,934
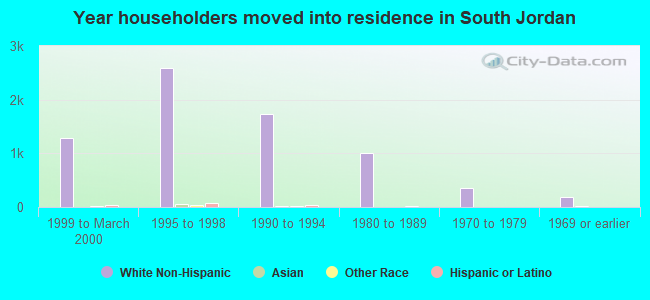
86.1% of South Jordan residents lived in the same house 1 years ago.
Out of people who lived in different houses, 40.4% lived in this county.
Out of people who lived in different counties, 24.8% lived in Utah.
| South Jordan: | 86.1% |
| State average: | 85.7% |
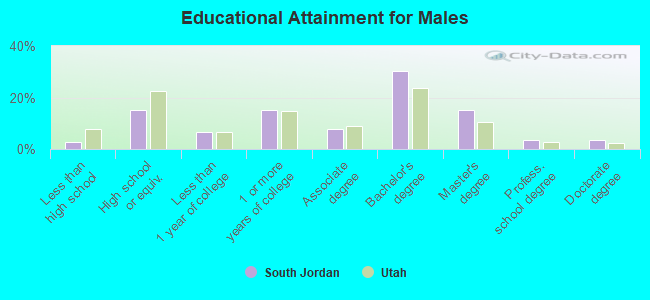
Education attainment for males 25 years and older:
- No schooling: 218
- Nursery to 4th grade: 7
- 5th and 6th grade: 94
- 7th and 8th grade: 75
- 9th grade: 29
- 10th grade: 12
- 11th grade: 77
- 12th grade, no diploma: 180
- High school graduate (or equivalency): 3,665
- Less than 1 year of college: 1,555
- Some college more than 1 year, no degree: 3,694
- Associate degree: 1,889
- Bachelor's degree: 7,319
- Master's degree: 3,685
- Professional school degree: 822
- Doctorate degree: 807
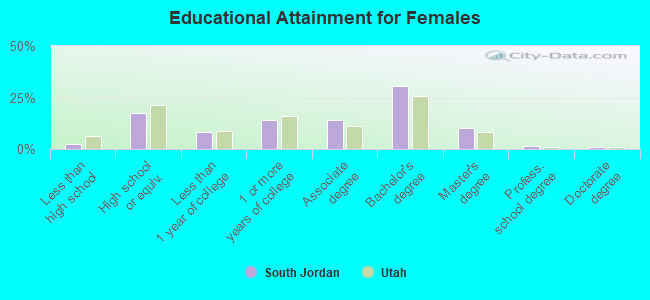
Education attainment for females 25 years and older:
- No schooling: 59
- Nursery to 4th grade: 0
- 5th and 6th grade: 0
- 7th and 8th grade: 133
- 9th grade: 102
- 10th grade: 19
- 11th grade: 92
- 12th grade, no diploma: 197
- High school graduate (or equivalency): 4,486
- Less than 1 year of college: 2,125
- Some college more than 1 year, no degree: 3,650
- Associate degree: 3,578
- Bachelor's degree: 7,817
- Master's degree: 2,565
- Professional school degree: 383
- Doctorate degree: 280
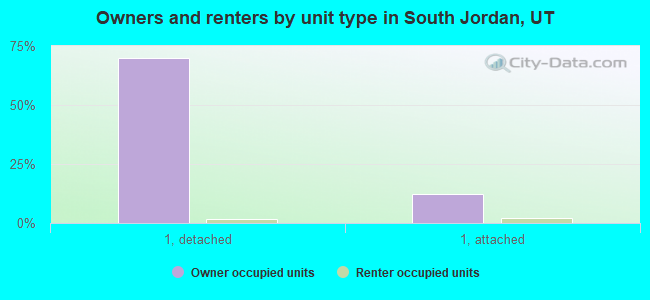
Housing units in structures:
- One, detached: 18,700
- One, attached: 4,924
- 3 or 4: 43
- 5 to 9: 681
- 10 to 19: 776
- 20 to 49: 539
- 50 or more: 2,529
House/condo owner moved in on average 7 years ago
Renter moved in on average 2 years ago
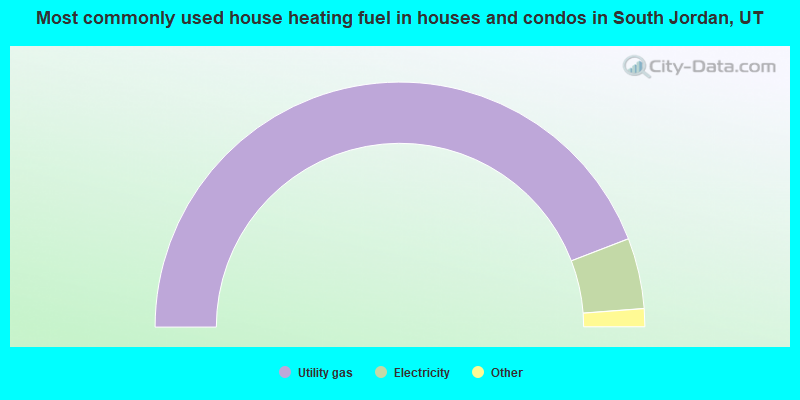
- 88.3%Utility gas
- 9.3%Electricity
- 1.6%Bottled, tank, or LP gas
- 0.4%No fuel used
- 0.3%Solar energy
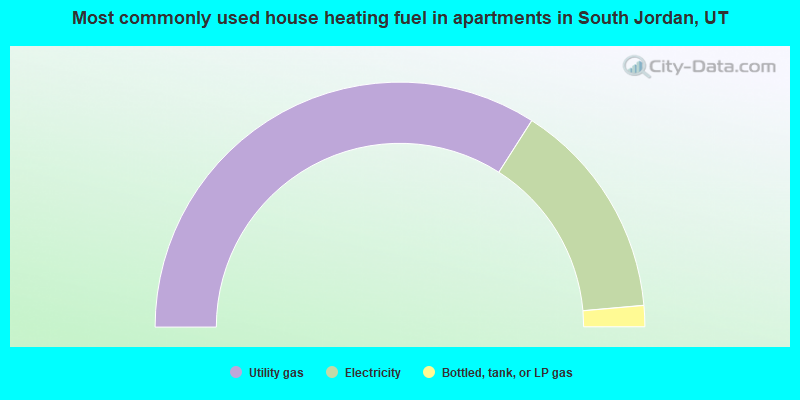
- 68.1%Utility gas
- 29.1%Electricity
- 2.8%Bottled, tank, or LP gas
Private vs. public school enrollment:
| Here: | 6.6% |
| Utah: | 7.2% |
| Here: | 0.0% |
| Utah: | 5.3% |
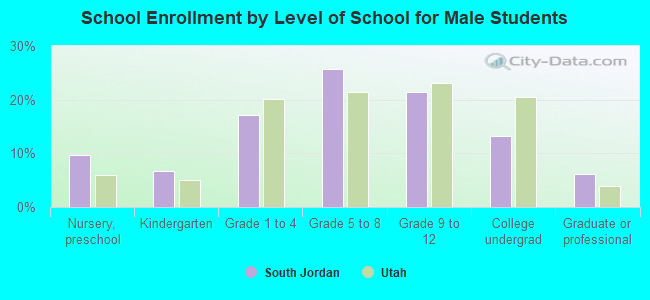
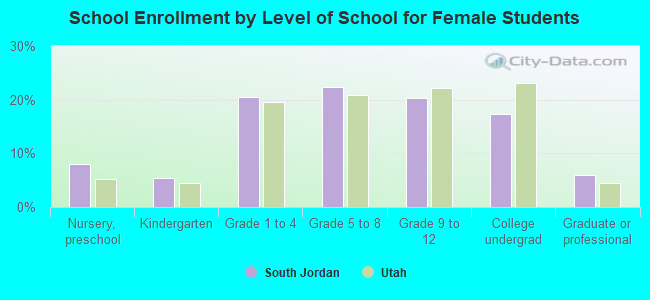
| Here: | 23.4% |
| Utah: | 26.7% |