South Coastside, CA (California) Houses and Residents
| South Coastside: | $1,707,806 |
| California: | $715,900 |
Total population: 28,564 (Urban population: 22,100 (all inside urban clusters), Rural population: 6,912 (218 farm, 6,694 nonfarm))
Houses: 10,515 (9,993 occupied: 7,544 owner occupied, 2,449 renter occupied)
| % of renters here: | 25% |
| State: | 44% |
Housing density: 38 houses/condos per square mile
Median price asked for vacant for-sale houses and condos in 2022 in this county: $912,464.
Median contract rent in 2022: over $2,000 (lower quartile is $1,596, upper quartile is over $2,000)
Median rent asked for vacant for-rent units in 2022: $3,711
Median gross rent in South Coastside, CA in 2022: over $2,000
Housing units in South Coastside with a mortgage: 4,829 (494 second mortgage, 812 home equity loan, 24 both second mortgage and home equity loan)
Houses without a mortgage: 1,116


Household type by relationship:
Households: 709,598- In family households: 600,696 (123,164 male householders, 52,443 female householders)
135,210 spouses, 200,774 children (191,666 natural, 3,650 adopted, 5,458 stepchildren), 13,269 grandchildren, 12,331 brothers or sisters, 11,191 parents, foster children, 18,613 other relatives, 25,142 non-relatives
- In nonfamily households: 108,902 (36,900 male householders (26,483 living alone)), 45,330 female householders (36,736 living alone)), 26,672 nonrelatives
- In group quarters: 8,853 (3,556 institutionalized population)
115,809 married couples with children.
26,091 single-parent households (6,997 men, 19,094 women).
74.8% of residents of South Coastside speak English at home.
17.4% of residents speak Spanish at home (42% speak English very well, 22% speak English well, 19% speak English not well, 16% don't speak English at all).
6.1% of residents speak other Indo-European language at home (70% speak English very well, 15% speak English well, 10% speak English not well, 5% don't speak English at all).
1.5% of residents speak Asian or Pacific Island language at home (71% speak English very well, 20% speak English well, 9% speak English not well).
0.2% of residents speak other language at home (47% speak English very well, 36% speak English well, 18% don't speak English at all).
Foreign born population: 6,069 (20.3%)
(42.5% of them are naturalized citizens)
| Here: | 7.3 |
| State: | 6.0 |
| Here: | 4.7 |
| State: | 3.9 |

- Bedrooms in owner-occupied houses and condos in South Coastside, California
- 54no bedroom
- 3781 bedroom
- 1,6762 bedrooms
- 3,2933 bedrooms
- 1,7524 bedrooms
- 3915+ bedrooms

- Bedrooms in renter-occupied apartments in South Coastside, California
- 278no bedroom
- 5981 bedroom
- 7052 bedrooms
- 7473 bedrooms
- 1214 bedrooms
- 05+ bedrooms

- Cars and other vehicles available in South Coastside in owner-occupied houses/condos
- 108no vehicle
- 1,5021 vehicle
- 3,6752 vehicles
- 1,6673 vehicles
- 4384 vehicles
- 1545+ vehicles

- Cars and other vehicles available in South Coastside in renter-occupied apartments
- 89no vehicle
- 8201 vehicle
- 9722 vehicles
- 4053 vehicles
- 1044 vehicles
- 595+ vehicles

- Rooms in owner-occupied houses in South Coastside, California
- 311 room
- 1342 rooms
- 4033 rooms
- 6944 rooms
- 1,6455 rooms
- 1,5286 rooms
- 1,4597 rooms
- 9108 rooms
- 7409+ rooms

- Rooms in renter-occupied apartments in South Coastside, California
- 1801 room
- 3202 rooms
- 4533 rooms
- 5144 rooms
- 4275 rooms
- 3486 rooms
- 1457 rooms
- 508 rooms
- 129+ rooms


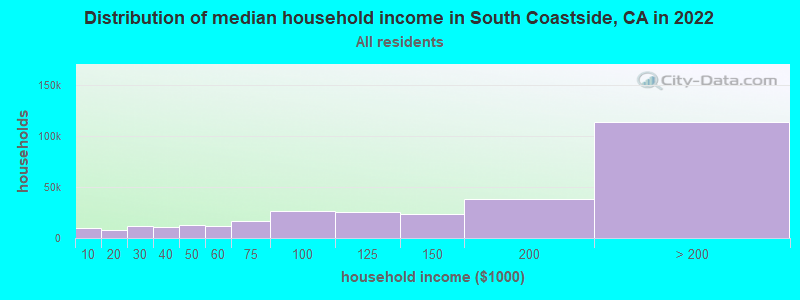
South Coastside, CA household income distribution

- 10,161Less than $10,000
- 8,061$10,000 to $19,999
- 11,663$20,000 to $29,999
- 10,695$30,000 to $39,999
- 13,012$40,000 to $49,999
- 11,865$50,000 to $59,999
- 17,117$60,000 to $74,999
- 26,629$75,000 to $99,999
- 25,651$100,000 to $124,999
- 23,307$125,000 to $149,999
- 37,892$150,000 to $199,999
- 113,649$200,000 or more
Percentage of workers working in this county: 88.8%
Number of people working at home: 4,083 (25.4% of all workers)
Travel time to work (commute)
- Less than 5 minutes: 637
- 5 to 9 minutes: 1,553
- 10 to 14 minutes: 1,266
- 15 to 19 minutes: 919
- 20 to 24 minutes: 871
- 25 to 29 minutes: 574
- 30 to 34 minutes: 2,145
- 35 to 39 minutes: 715
- 40 to 44 minutes: 1,241
- 45 to 59 minutes: 2,425
- 60 to 89 minutes: 1,478
- 90 or more minutes: 291
Means of transportation to work:
- Drove a car alone: 11,154 (73.6%)
- Carpooled: 1,932 (12.7%)
- Bus or trolley bus: 173 (1.1%)
- Streetcar or trolley car: 10 (0.1%)
- Subway or elevated: 123 (0.8%)
- Railroad: 23 (0.2%)
- Motorcycle: 32 (0.2%)
- Bicycle: 128 (0.8%)
- Walked: 480 (3.2%)
- Other means: 60 (0.4%)
- Worked at home: 1,039 (6.9%)


- Year of entry for the foreign-born population in South Coastside, California
- 7281995 to March 2000
- 9741990 to 1994
- 8591985 to 1989
- 6861980 to 1984
- 4501975 to 1979
- 4101970 to 1974
- 4821965 to 1969
- 706Before 1965
Most common places of birth for foreign-born residents (%):
| South Coastside: | 50.6% (2,680) |
| California: | 44.3% (3,928,701) |
| South Coastside: | 7.3% (389) |
| California: | 1.5% (133,090) |
| South Coastside: | 7.0% (369) |
| California: | 0.4% (32,315) |
| South Coastside: | 3.6% (191) |
| California: | 1.6% (141,181) |
| South Coastside: | 3.2% (168) |
| California: | 1.1% (98,160) |
| South Coastside: | 2.9% (154) |
| California: | 7.5% (664,935) |
| South Coastside: | 2.0% (107) |
| California: | 0.4% (38,450) |
| South Coastside: | 1.6% (83) |
| California: | 0.3% (22,311) |
Place of birth for U.S.-born residents:
- This state: 15,134
- Other state: 8,238
- Northeast: 2,504
- Midwest: 2,552
- South: 1,544
- West: 1,638
60% of South Coastside residents lived in the same house 5 years ago.
Out of people who lived in different houses, 55% lived in this county.
Out of people who lived in different counties, 65% lived in California.
Education attainment for males 25 years and older:
- No schooling: 268
- Nursery to 4th grade: 235
- 5th and 6th grade: 327
- 7th and 8th grade: 168
- 9th grade: 117
- 10th grade: 223
- 11th grade: 177
- 12th grade, no diploma: 385
- High school graduate (or equivalency): 1,584
- Less than 1 year of college: 476
- Some college more than 1 year, no degree: 1,498
- Associate degree: 501
- Bachelor's degree: 2,632
- Master's degree: 1,026
- Professional school degree: 230
- Doctorate degree: 355

Education attainment for females 25 years and older:
- No schooling: 129
- Nursery to 4th grade: 139
- 5th and 6th grade: 300
- 7th and 8th grade: 130
- 9th grade: 91
- 10th grade: 116
- 11th grade: 74
- 12th grade, no diploma: 229
- High school graduate (or equivalency): 1,366
- Less than 1 year of college: 599
- Some college more than 1 year, no degree: 1,553
- Associate degree: 800
- Bachelor's degree: 2,484
- Master's degree: 1,115
- Professional school degree: 305
- Doctorate degree: 268


Housing units in structures:
- One, detached: 8,044
- One, attached: 723
- Two: 190
- 3 or 4: 305
- 5 to 9: 252
- 10 to 19: 90
- 20 to 49: 59
- 50 or more: 68
- Mobile homes: 769
- Boats, RVs, vans, etc.: 15
Median worth of mobile homes: $195,557
Housing units lacking complete kitchen facilities: 0.7%

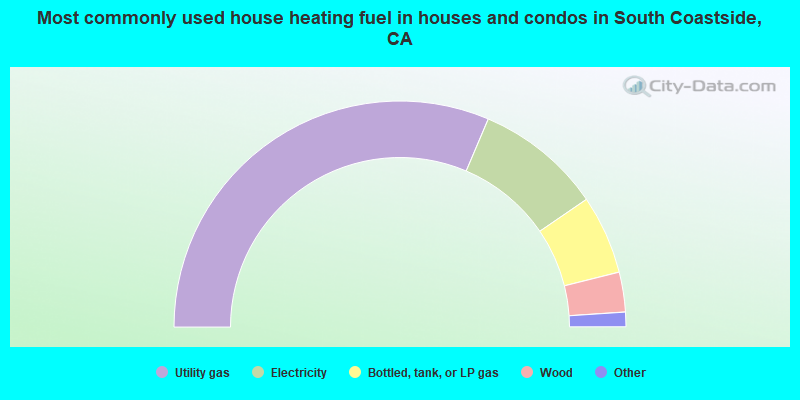
- 62.8%Utility gas
- 18.1%Electricity
- 11.3%Bottled, tank, or LP gas
- 5.7%Wood
- 1.0%Fuel oil, kerosene, etc.
- 0.5%Other fuel
- 0.4%Solar energy
- 0.2%No fuel used

- 41.4%Utility gas
- 32.3%Electricity
- 13.9%Bottled, tank, or LP gas
- 9.6%Wood
- 1.6%No fuel used
- 0.7%Other fuel
- 0.5%Fuel oil, kerosene, etc.
Private vs. public school enrollment:
| Here: | 9.4% |
| California: | 9.9% |
| Here: | 8.1% |
| California: | 7.8% |
| Here: | 12.5% |
| California: | 15.4% |


