Housing density: 1,228 houses/condos per square mile
Median price asked for vacant for-sale houses and condos in 2022 in this county: $1,279,555.
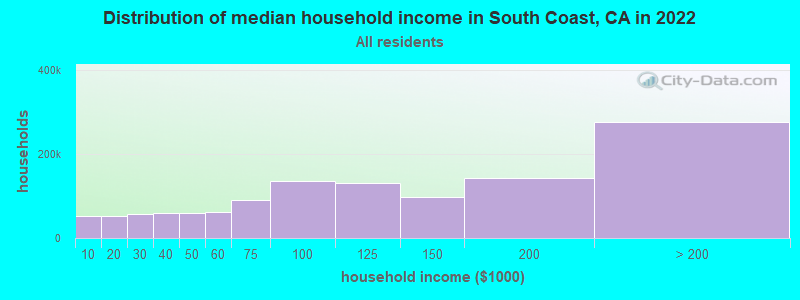
Median contract rent in 2022: over $2,000 (lower quartile is $1,945, upper quartile is over $2,000)
Median rent asked for vacant for-rent units in 2022: $2,949
Median gross rent in South Coast, CA in 2022: over $2,000
Housing units in South Coast with a mortgage: 54,674 (7,560 second mortgage, 5,859 home equity loan, 248 both second mortgage and home equity loan) Houses without a mortgage: 10,715
Compare current foreclosures near South Coast, CA:
In family households: 2,574,637 (510,612 male householders, 197,879 female householders)
538,268 spouses, 917,395 children (868,578 natural, 16,498 adopted, 32,319 stepchildren), 67,543 grandchildren, 54,495 brothers or sisters, 47,670 parents, foster children, 85,984 other relatives, 117,563 non-relatives
In nonfamily households: 396,359 (130,596 male householders (87,348 living alone)), 153,694 female householders (120,501 living alone)), 112,069 nonrelatives
In group quarters: 39,236 (14,531 institutionalized population)
546,370 married couples with children.
125,951 single-parent households (34,925 men, 91,026 women).
78.2% of residents of South Coast speak English at home.
11.7% of residents speak Spanish at home (50% speak English very well, 21% speak English well, 20% speak English not well, 8% don't speak English at all).
5.6% of residents speak other Indo-European language at home (77% speak English very well, 16% speak English well, 6% speak English not well, 1% don't speak English at all).
3.8% of residents speak Asian or Pacific Island language at home (57% speak English very well, 30% speak English well, 12% speak English not well, 1% don't speak English at all).
0.8% of residents speak other language at home (74% speak English very well, 21% speak English well, 4% speak English not well, 1% don't speak English at all).
Foreign born population: 57,480 (18.0%)
(71.5% of them are naturalized citizens)
Percentage of workers working in this county: 93.9% Number of people working at home: 30,365 (17.8% of all workers)
Travel time to work (commute)
Less than 5 minutes: 2,573
5 to 9 minutes: 11,092
10 to 14 minutes: 17,015
15 to 19 minutes: 18,248
20 to 24 minutes: 19,560
25 to 29 minutes: 9,817
30 to 34 minutes: 20,204
35 to 39 minutes: 4,577
40 to 44 minutes: 5,956
45 to 59 minutes: 10,361
60 to 89 minutes: 9,317
90 or more minutes: 3,961
Means of transportation to work:
Drove a car alone: 111,907 (79.2%)
Carpooled: 14,787 (10.5%)
Bus or trolley bus: 1,483 (1.0%)
Streetcar or trolley car: 38 (0.0%)
Subway or elevated: 21 (0.0%)
Railroad: 581 (0.4%)
Ferryboat: 6 (0.0%)
Taxi: 58 (0.0%)
Motorcycle: 236 (0.2%)
Bicycle: 427 (0.3%)
Walked: 2,438 (1.7%)
Other means: 699 (0.5%)
Worked at home: 8,702 (6.2%)
Year of entry for the foreign-born population in South Coast, California
8,9961995 to March 2000
7,1381990 to 1994
8,6191985 to 1989
6,2521980 to 1984
5,6031975 to 1979
3,4061970 to 1974
2,5071965 to 1969
8,736Before 1965
Most common places of birth for foreign-born residents (%):
Mexico
South Coast:
32.0% (16,405)
California:
44.3% (3,928,701)
Iran
South Coast:
7.7% (3,933)
California:
1.8% (158,613)
United Kingdom
South Coast:
5.8% (2,982)
California:
1.5% (133,090)
Canada
South Coast:
5.2% (2,654)
California:
1.6% (141,181)
Philippines
South Coast:
4.3% (2,180)
California:
7.5% (664,935)
Germany
South Coast:
3.2% (1,654)
California:
1.1% (98,160)
Vietnam
South Coast:
3.1% (1,574)
California:
4.7% (418,249)
Korea
South Coast:
2.7% (1,373)
California:
3.0% (268,452)
Taiwan
South Coast:
2.2% (1,106)
California:
1.7% (151,775)
Japan
South Coast:
1.9% (964)
California:
1.3% (112,212)
China, excluding Hong Kong and Taiwan
South Coast:
1.6% (807)
California:
3.7% (327,611)
India
South Coast:
1.5% (774)
California:
2.2% (198,201)
Place of birth for U.S.-born residents:
This state: 135,175
Other state: 98,962
Northeast: 28,410
Midwest: 38,283
South: 17,066
West: 15,203
48% of South Coast residents lived in the same house 5 years ago. Out of people who lived in different houses, 65% lived in this county. Out of people who lived in different counties, 59% lived in California.
Education attainment for males 25 years and older:
No schooling: 755
Nursery to 4th grade: 345
5th and 6th grade: 1,066
7th and 8th grade: 930
9th grade: 819
10th grade: 841
11th grade: 821
12th grade, no diploma: 2,290
High school graduate (or equivalency): 12,374
Less than 1 year of college: 5,402
Some college more than 1 year, no degree: 17,107
Associate degree: 7,563
Bachelor's degree: 28,847
Master's degree: 10,373
Professional school degree: 5,106
Doctorate degree: 2,214
Education attainment for females 25 years and older:
No schooling: 831
Nursery to 4th grade: 311
5th and 6th grade: 1,197
7th and 8th grade: 1,138
9th grade: 858
10th grade: 773
11th grade: 886
12th grade, no diploma: 3,082
High school graduate (or equivalency): 18,471
Less than 1 year of college: 9,019
Some college more than 1 year, no degree: 21,895
Associate degree: 10,561
Bachelor's degree: 27,048
Master's degree: 8,660
Professional school degree: 2,701
Doctorate degree: 1,010
Housing units in structures:
One, detached: 56,983
One, attached: 23,581
Two: 3,746
3 or 4: 10,564
5 to 9: 10,897
10 to 19: 5,268
20 to 49: 3,494
50 or more: 6,630
Mobile homes: 2,726
Boats, RVs, vans, etc.: 142
Median worth of mobile homes: $273,091
Housing units lacking complete plumbing facilities: 0.3%
Housing units lacking complete kitchen facilities: 0.8%