South Charleston, OH (Ohio) Houses and Residents
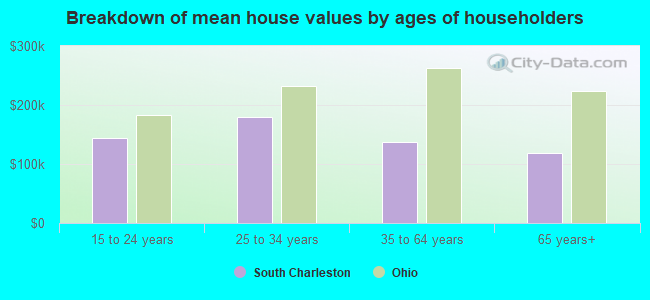
| South Charleston: | $134,853 |
| Ohio: | $204,100 |
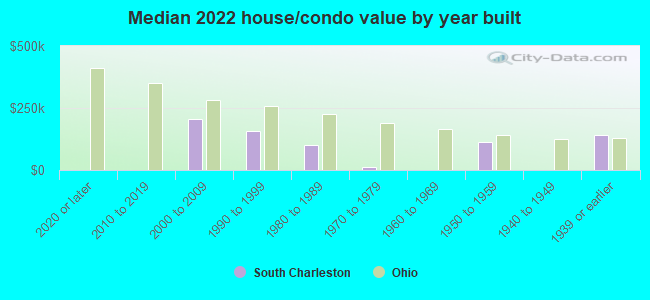
Mean price in 2022:
Detached houses: $147,216
Here: $147,216 State: $254,366 Mobile homes: $58,248
Here: $58,248 State: $62,719
Total population: 1,668 (Urban population: 0, Rural population: 1,809 (all nonfarm))
Houses: 916 (874 occupied: 465 owner occupied, 417 renter occupied)
| % of renters here: | 47% |
| State: | 33% |
Housing density: 706 houses/condos per square mile
Median price asked for vacant for-sale houses and condos in 2022 in this county: $300,061.
Median contract rent in 2022: $529 (lower quartile is $467, upper quartile is $609)
Median rent asked for vacant for-rent units in 2022: $592
Median gross rent in South Charleston, OH in 2022: $686
Housing units in South Charleston with a mortgage: 307 (5 second mortgage, 0 home equity loan, 6 both second mortgage and home equity loan)
Houses without a mortgage: 19
Median household income for houses/condos with a mortgage: $58,742
Median household income for apartments without a mortgage: $41,228
Median monthly housing costs: $656
Compare current foreclosures near South Charleston, OH:
| Photo | Address | Area | Beds / Baths | Price | Details |
|---|---|---|---|---|---|

|
#1
Summerford Rd
South Charleston, OH 45368
|
2,037 sq. feet
|
1 baths 2 beds |
show details | |

|
#2
Berschet Dr
South Charleston, OH 45368
|
1,020 sq. feet
|
1 baths 3 beds |
show details | |

|
#3
Plattsburg Rd
South Charleston, OH 45368
|
1,768 sq. feet
|
2 baths 3 beds |
show details | |

|
#4
S Charleston Pike
South Charleston, OH 45368
|
2,176 sq. feet
|
2 baths 3 beds |
show details | |

|
#5
E Jamestown St
South Charleston, OH 45368
|
- sq. feet
|
- baths - beds |
show details | |

|
#6
Pine St
Springfield, OH 45505
|
1,412 sq. feet
|
2 baths 3 beds |
$41,600
|
show details |

|
#7
Arthur Rd
Springfield, OH 45502
|
2,204 sq. feet
|
2 baths 3 beds |
$354,900
|
show details |

|
#8
Old Xenia Rd SE
London, OH 43140
|
1,602 sq. feet
|
1 baths 3 beds |
$109,900
|
show details |

|
#9
Delaware Ave
Springfield, OH 45506
|
1,951 sq. feet
|
1 baths 4 beds |
$74,900
|
show details |

|
#10
W 2nd St
Springfield, OH 45504
|
832 sq. feet
|
1 baths 2 beds |
show details |
| Photo | Address | Area | Beds / Baths | Price | Details |
|---|---|---|---|---|---|

|
#11
Providence Ave
Springfield, OH 45503
|
1,169 sq. feet
|
1 baths 3 beds |
show details | |

|
#12
Moorefield Rd
Springfield, OH 45502
|
1,786 sq. feet
|
2 baths 3 beds |
show details | |

|
#13
Gallagher St
Springfield, OH 45505
|
1,648 sq. feet
|
1 baths 2 beds |
show details | |

|
#14
E Lincoln Ave
London, OH 43140
|
876 sq. feet
|
1 baths 2 beds |
show details | |

|
#15
Wynn Rd
Springfield, OH 45502
|
1,056 sq. feet
|
1 baths 3 beds |
show details | |

|
#16
E 1st St
London, OH 43140
|
- sq. feet
|
1 baths 3 beds |
show details | |

|
#17
State Route 56
Mechanicsburg, OH 43044
|
2,544 sq. feet
|
2 baths 3 beds |
show details | |

|
#18
Circle Dr
London, OH 43140
|
1,504 sq. feet
|
2 baths 2 beds |
show details | |

|
#19
Reno Rd
Springfield, OH 45503
|
1,075 sq. feet
|
1 baths 3 beds |
show details | |

|
#20
Argonne Ln N
Springfield, OH 45503
|
1,140 sq. feet
|
1 baths 2 beds |
show details |
| Photo | Address | Area | Beds / Baths | Price | Details |
|---|---|---|---|---|---|

|
#21
Delmar Dr
Springfield, OH 45503
|
1,102 sq. feet
|
1 baths 2 beds |
show details | |

|
#22
Argonne Ln N
Springfield, OH 45503
|
1,140 sq. feet
|
1 baths 2 beds |
show details | |

|
#23
Western Ave
Jamestown, OH 45335
|
1,368 sq. feet
|
1 baths 3 beds |
show details | |

|
#24
W High St
Springfield, OH 45506
|
866 sq. feet
|
1 baths 3 beds |
show details | |

|
#25
Linmuth Dr W
Springfield, OH 45503
|
2,120 sq. feet
|
2 baths 4 beds |
show details | |

|
#26
Woodsview Ct
Jeffersonville, OH 43128
|
999 sq. feet
|
1 baths 3 beds |
show details | |

|
#27
W High St
Jeffersonville, OH 43128
|
2,012 sq. feet
|
1 baths 4 beds |
show details | |

|
#28
W 1st St
Springfield, OH 45504
|
672 sq. feet
|
1 baths 2 beds |
show details | |

|
#29
Kewbury Rd
Springfield, OH 45504
|
1,302 sq. feet
|
1 baths 3 beds |
show details | |

|
#30
Home Orchard Dr
Springfield, OH 45503
|
1,305 sq. feet
|
1 baths 3 beds |
show details |
| Photo | Address | Area | Beds / Baths | Price | Details |
|---|---|---|---|---|---|

|
#31
Andrew Ct W
London, OH 43140
|
924 sq. feet
|
1 baths 3 beds |
show details | |

|
#32
Englewood Rd
Springfield, OH 45504
|
2,440 sq. feet
|
2 baths 6 beds |
show details | |

|
#33
Allison Ave
Springfield, OH 45506
|
900 sq. feet
|
1 baths 3 beds |
show details | |

|
#34
Portage Path
Springfield, OH 45506
|
925 sq. feet
|
1 baths 3 beds |
show details | |

|
#35
Portage Path
Springfield, OH 45506
|
1,008 sq. feet
|
1 baths 3 beds |
show details | |

|
#36
Sheffield Blvd
London, OH 43140
|
1,521 sq. feet
|
1 baths 3 beds |
show details | |

|
#37
Halifax Ct
Springfield, OH 45503
|
1,903 sq. feet
|
1 baths 3 beds |
show details | |

|
#38
Robinson Dr
Springfield, OH 45506
|
1,340 sq. feet
|
1 baths 4 beds |
show details | |

|
#39
Iroquois St
Springfield, OH 45506
|
2,160 sq. feet
|
2 baths 4 beds |
show details | |

|
#40
N Main St
Jeffersonville, OH 43128
|
1,535 sq. feet
|
1 baths 3 beds |
show details |
| Photo | Address | Area | Beds / Baths | Price | Details |
|---|---|---|---|---|---|

|
#41
Ridge Rd
Springfield, OH 45503
|
1,053 sq. feet
|
2 baths 3 beds |
show details | |

|
#42
W Jackson Rd
Yellow Springs, OH 45387
|
735 sq. feet
|
1 baths 2 beds |
show details | |

|
#43
Warren Dr
Springfield, OH 45503
|
2,352 sq. feet
|
2 baths 6 beds |
show details | |

|
#44
Margate Cir
London, OH 43140
|
1,956 sq. feet
|
2 baths 3 beds |
show details | |

|
#45
W Choctaw Dr
London, OH 43140
|
2,296 sq. feet
|
2 baths 4 beds |
show details | |

|
#46
W North St
Springfield, OH 45504
|
1,383 sq. feet
|
1 baths 4 beds |
show details | |

|
#47
Hyannis Dr
Springfield, OH 45503
|
1,219 sq. feet
|
2 baths 4 beds |
show details | |

|
#48
Bellefair Ave
Springfield, OH 45506
|
624 sq. feet
|
1 baths 2 beds |
show details | |

|
#49
Englewood Rd
Springfield, OH 45503
|
1,252 sq. feet
|
1 baths 3 beds |
show details | |

|
Check over 1 million property listings on Foreclosure.com!
|
browse all offers | |||


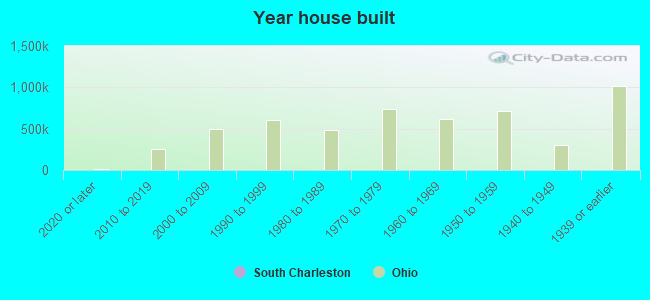
Median year apartment built: 1978
Household type by relationship:
Households: 1,777- Male householders: 439 (211 living alone), Female householders: 426 (195 living alone)
278 spouses (275 opposite-sex spouses), 67 unmarried partners, (62 opposite-sex unmarried partners), 474 children (423 natural, 8 adopted, 41 stepchildren), 23 grandchildren, 1 brothers or sisters, 6 parents, 0 foster children, 11 other relatives, 45 non-relatives
Size of family households: 165 2-persons, 99 3-persons, 59 4-persons, 32 5-persons, 15 6-persons, 7 7-or-more-persons.
Size of nonfamily households: 448 1-person, 58 2-persons, 21 3-persons.
170 married couples with children.
123 single-parent households (86 men, 37 women).
97.6% of residents of South Charleston speak English at home.
0.9% of residents speak Spanish at home (100% speak English very well).
0.6% of residents speak other Indo-European language at home (60% speak English very well, 40% speak English well).
0.5% of residents speak Asian or Pacific Island language at home (100% speak English very well).
Foreign born population: 11 (0.6%)
(90.9% of them are naturalized citizens)
| Here: | 6.0 |
| State: | 6.7 |
| Here: | 4.3 |
| State: | 4.4 |

- Bedrooms in owner-occupied houses and condos in South Charleston, Ohio
- 0no bedroom
- 51 bedroom
- 932 bedrooms
- 2953 bedrooms
- 614 bedrooms
- 115+ bedrooms
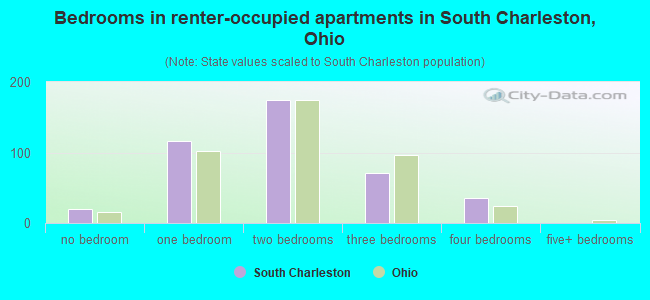
- Bedrooms in renter-occupied apartments in South Charleston, Ohio
- 20no bedroom
- 1161 bedroom
- 1742 bedrooms
- 713 bedrooms
- 364 bedrooms
- 05+ bedrooms
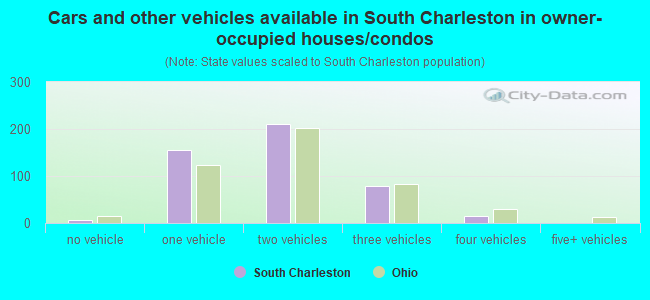
- Cars and other vehicles available in South Charleston in owner-occupied houses/condos
- 6no vehicle
- 1561 vehicle
- 2102 vehicles
- 793 vehicles
- 144 vehicles
- 05+ vehicles
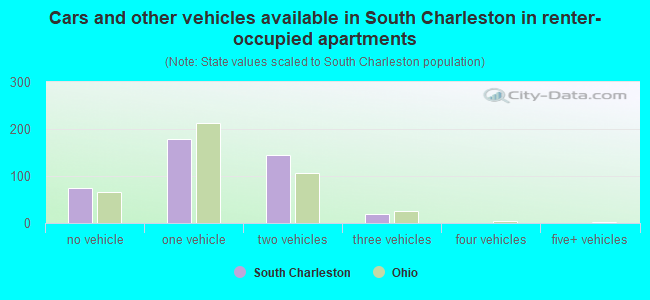
- Cars and other vehicles available in South Charleston in renter-occupied apartments
- 75no vehicle
- 1781 vehicle
- 1452 vehicles
- 203 vehicles
- 04 vehicles
- 05+ vehicles
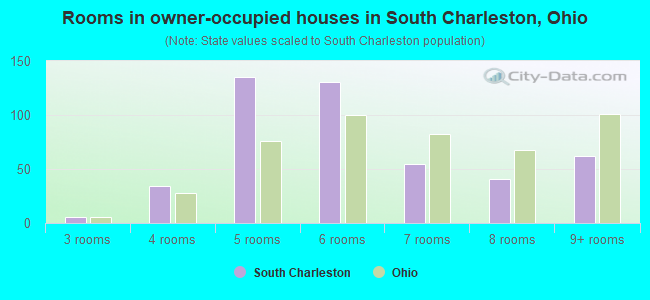
- Rooms in owner-occupied houses in South Charleston, Ohio
- 01 room
- 02 rooms
- 63 rooms
- 344 rooms
- 1355 rooms
- 1316 rooms
- 557 rooms
- 418 rooms
- 629+ rooms
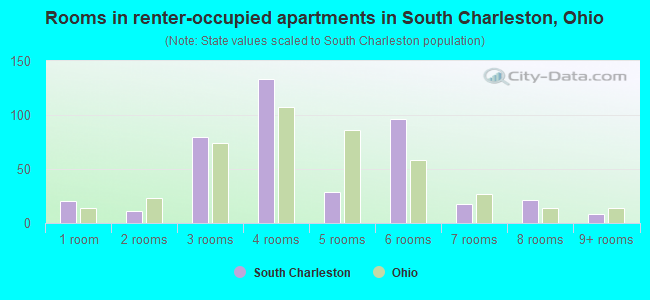
- Rooms in renter-occupied apartments in South Charleston, Ohio
- 201 room
- 112 rooms
- 803 rooms
- 1334 rooms
- 295 rooms
- 966 rooms
- 187 rooms
- 218 rooms
- 89+ rooms
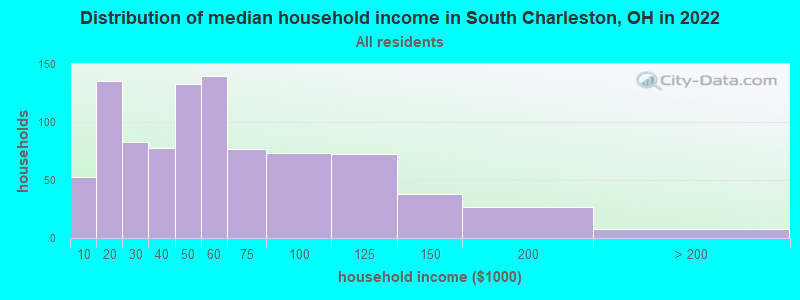
South Charleston, OH household income distribution

- 53Less than $10,000
- 135$10,000 to $19,999
- 83$20,000 to $29,999
- 78$30,000 to $39,999
- 133$40,000 to $49,999
- 140$50,000 to $59,999
- 77$60,000 to $74,999
- 73$75,000 to $99,999
- 72$100,000 to $124,999
- 38$125,000 to $149,999
- 27$150,000 to $199,999
- 8$200,000 or more
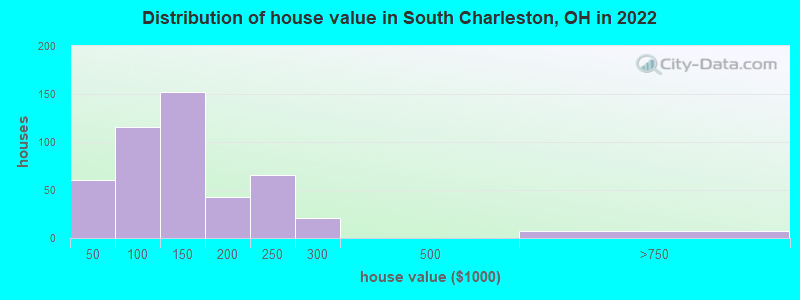
Home value of owner - occupied houses in 2022 in South Charleston, OH
-
- 13Less than $10,000
- 3$10,000 to $14,999
- 3$15,000 to $19,999
- 3$30,000 to $34,999
- 17$35,000 to $39,999
- 17$40,000 to $49,999
- 43$60,000 to $69,999
- 34$70,000 to $79,999
- 19$80,000 to $89,999
- 79$100,000 to $124,999
- 73$125,000 to $149,999
- 31$150,000 to $174,999
- 11$175,000 to $199,999
- 65$200,000 to $249,999
- 20$250,000 to $299,999
- 6$500,000 to $749,999
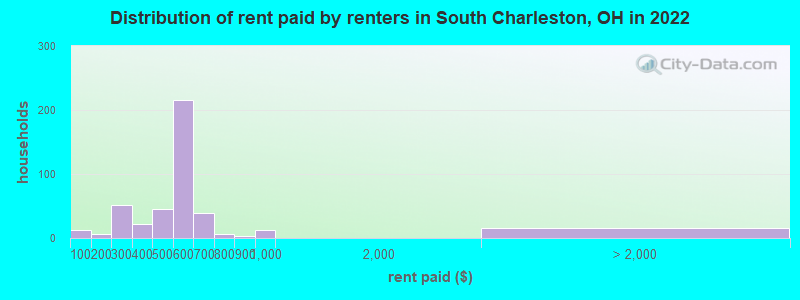
Rent paid by renters in 2022 in South Charleston, OH
-
- 11Less than $100
- 2$100 to $149
- 4$150 to $199
- 35$200 to $249
- 15$250 to $299
- 19$300 to $349
- 2$350 to $399
- 5$400 to $449
- 41$450 to $499
- 156$500 to $549
- 59$550 to $599
- 5$600 to $649
- 33$650 to $699
- 7$700 to $749
- 3$800 to $899
- 11$900 to $999
- 14No cash rent
Percentage of workers working in this county: 56.3%
Number of people working at home: 5 (0.6% of all workers)
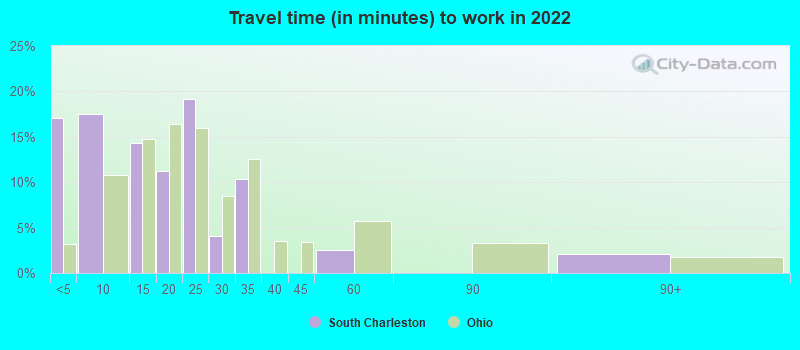
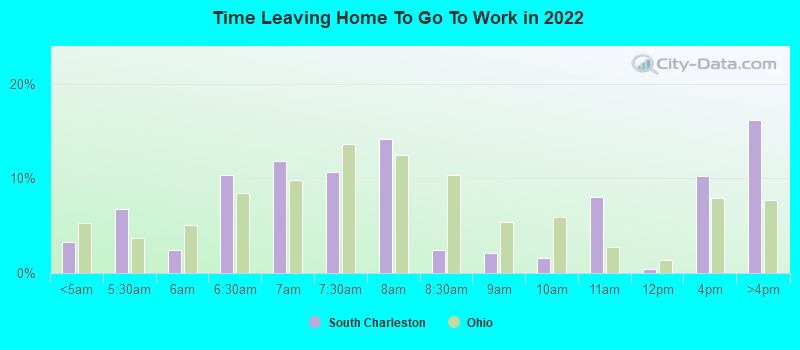
Travel time to work (commute)
- Less than 5 minutes: 129
- 5 to 9 minutes: 87
- 10 to 14 minutes: 44
- 15 to 19 minutes: 107
- 20 to 24 minutes: 216
- 25 to 29 minutes: 64
- 30 to 34 minutes: 83
- 35 to 39 minutes: 57
- 40 to 44 minutes: 47
- 45 to 59 minutes: 29
- 60 to 89 minutes: 6
- 90 or more minutes: 10
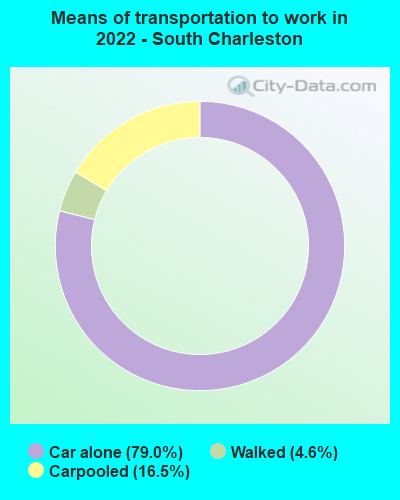
Means of transportation to work:
- Drove a car alone: 372 (78.5%)
- Carpooled: 56 (11.8%)
- Walked: 27 (5.7%)
- Worked at home: 5 (1.1%)
- Unemployment by race in 2022
- Unemployment rate for White non-Hispanic residents
- 3.3%Females
- Unemployment rate for two or more race residents
- 100.0%Females
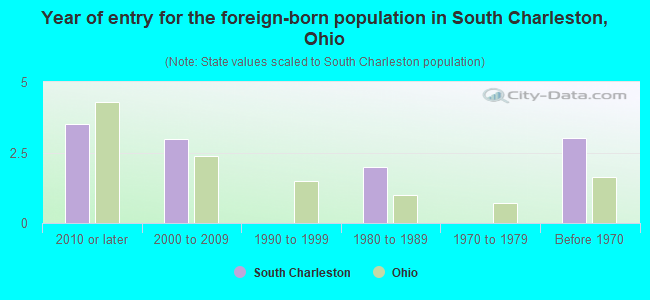
- Year of entry for the foreign-born population in South Charleston, Ohio
- 42010 or later
- 32000 to 2009
- 01990 to 1999
- 21980 to 1989
- 01970 to 1979
- 3Before 1970
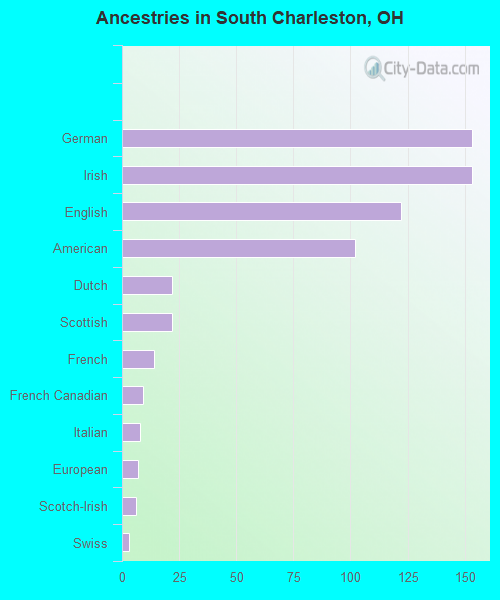
First ancestries reported:
- German: 153 (20.2%)
- Irish: 153 (20.2%)
- English: 122 (16.1%)
- American: 102 (13.5%)
- Dutch: 22 (2.9%)
- Scottish: 22 (2.9%)
- French: 14 (1.9%)
- French Canadian: 9 (1.2%)
- Italian: 8 (1.1%)
- European: 7 (0.9%)
- Scotch-Irish: 6 (0.8%)
- Swiss: 3 (0.4%)
Most common places of birth for foreign-born residents (%):
| South Charleston: | 50.0% (5) |
| Ohio: | 3.1% (17,818) |
| South Charleston: | 20.0% (2) |
| Ohio: | 0.6% (3,223) |
Place of birth for U.S.-born residents:
- This state: 1,547
- Other state: 197
- Northeast: 32
- Midwest: 45
- South: 102
- West: 6
81.1% of South Charleston residents lived in the same house 1 years ago.
Out of people who lived in different houses, 40.5% lived in this county.
Out of people who lived in different counties, 100.0% lived in Ohio.
| South Charleston: | 81.1% |
| State average: | 87.8% |
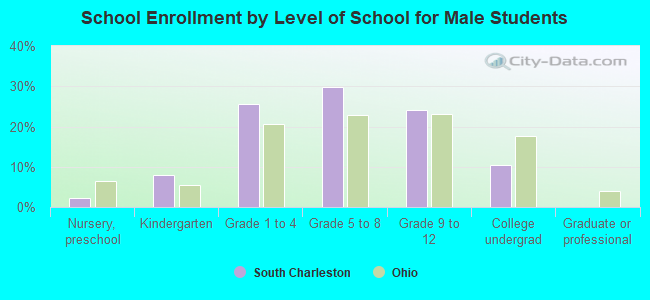
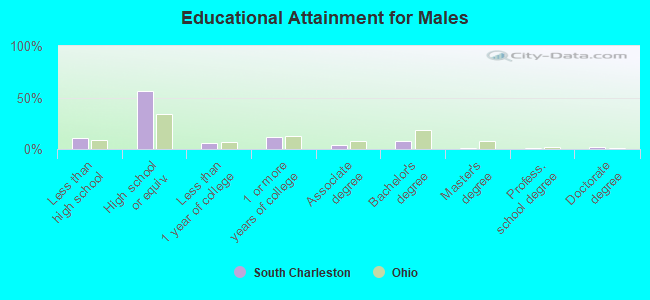
Education attainment for males 25 years and older:
- No schooling: 0
- Nursery to 4th grade: 0
- 5th and 6th grade: 0
- 7th and 8th grade: 3
- 9th grade: 0
- 10th grade: 31
- 11th grade: 10
- 12th grade, no diploma: 17
- High school graduate (or equivalency): 326
- Less than 1 year of college: 34
- Some college more than 1 year, no degree: 65
- Associate degree: 25
- Bachelor's degree: 47
- Master's degree: 6
- Professional school degree: 3
- Doctorate degree: 12
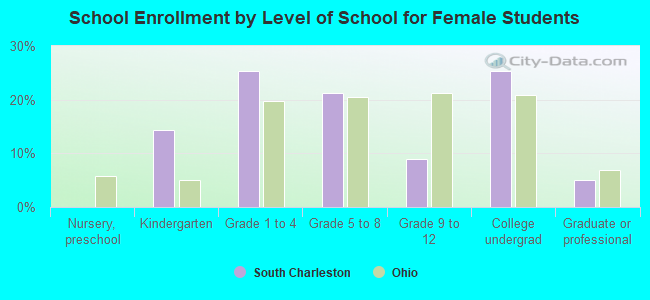
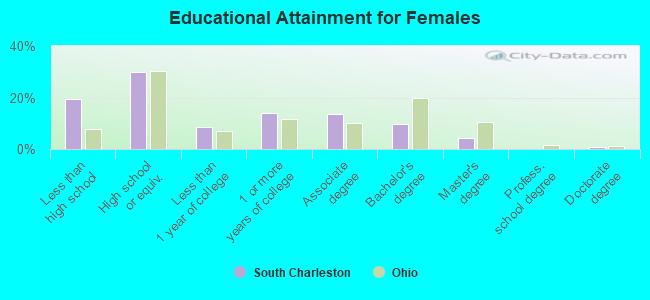
Education attainment for females 25 years and older:
- No schooling: 2
- Nursery to 4th grade: 0
- 5th and 6th grade: 0
- 7th and 8th grade: 8
- 9th grade: 15
- 10th grade: 14
- 11th grade: 76
- 12th grade, no diploma: 4
- High school graduate (or equivalency): 182
- Less than 1 year of college: 51
- Some college more than 1 year, no degree: 86
- Associate degree: 82
- Bachelor's degree: 59
- Master's degree: 26
- Professional school degree: 0
- Doctorate degree: 4


Housing units in structures:
- One, detached: 537
- One, attached: 18
- Two: 19
- 3 or 4: 73
- 5 to 9: 95
- 10 to 19: 54
- 20 to 49: 22
- 50 or more: 69
- Mobile homes: 29
Housing units lacking complete kitchen facilities in 2022: 0.8%
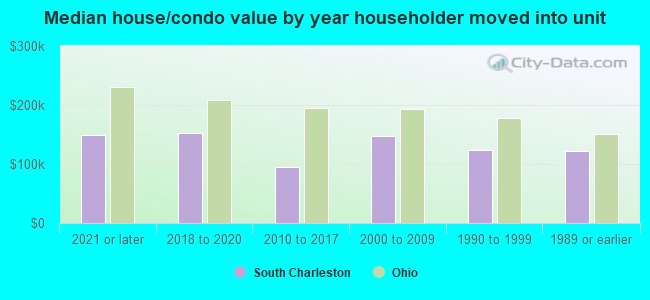
House/condo owner moved in on average 12 years ago
Renter moved in on average 2 years ago
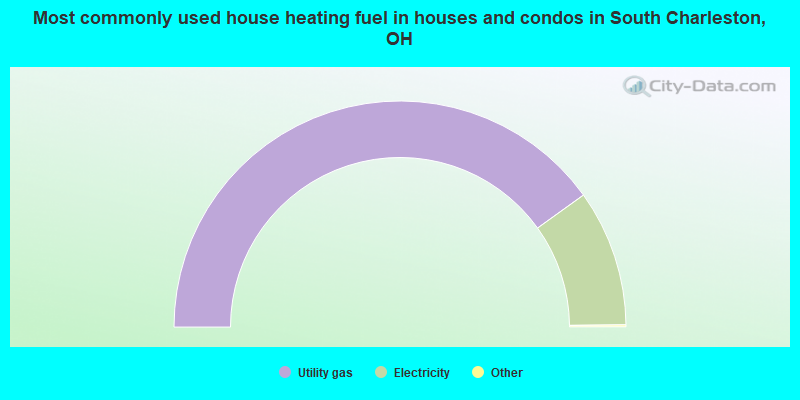
- 80.4%Utility gas
- 19.6%Electricity
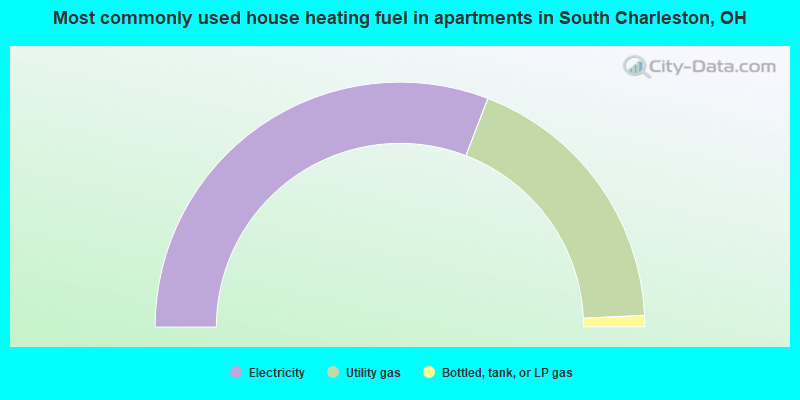
- 61.7%Electricity
- 36.8%Utility gas
- 1.5%Bottled, tank, or LP gas
Private vs. public school enrollment:
| Here: | 3.3% |
| Ohio: | 16.0% |
| Here: | 0.0% |
| Ohio: | 13.1% |
| Here: | 34.5% |
| Ohio: | 22.3% |