South Benton, WA (Washington) Houses and Residents
| South Benton: | $245,312 |
| Washington: | $569,500 |
Total population: 924 (Urban population: 0, Rural population: 866 (83 farm, 783 nonfarm))
Houses: 285 (251 occupied: 161 owner occupied, 90 renter occupied)
| % of renters here: | 36% |
| State: | 36% |
Housing density: 0 houses/condos per square mile
Median price asked for vacant for-sale houses and condos in 2022 in this county: $190,801.
Median contract rent in 2022: $428 (lower quartile is $208, upper quartile is $920)
Median gross rent in South Benton, WA in 2022: $851
Housing units in South Benton with a mortgage: 15 (0 second mortgage, 3 home equity loan, 0 both second mortgage and home equity loan)
Houses without a mortgage: 11
Compare current foreclosures near South Benton, WA:
| Photo | Address | Area | Beds / Baths | Price | Details |
|---|---|---|---|---|---|

|
#1
NE Oregon Ave
Irrigon, OR 97844
|
1,274 sq. feet
|
2 baths 3 beds |
show details | |

|
#2
W Hermiston Ave
Hermiston, OR 97838
|
1,360 sq. feet
|
1 baths 3 beds |
show details | |

|
#3
Summit View Dr
Kennewick, WA 99338
|
4,100 sq. feet
|
3 baths 4 beds |
show details | |

|
#4
Cliff St
Umatilla, OR 97882
|
2,236 sq. feet
|
2 baths 3 beds |
show details | |

|
#5
E Badger Rd
Benton City, WA 99320
|
1,876 sq. feet
|
- baths - beds |
$79,900
|
show details |

|
#6
8th St
Umatilla, OR 97882
|
1,134 sq. feet
|
1 baths 2 beds |
show details | |

|
#7
NE Alora Dr
Hermiston, OR 97838
|
1,120 sq. feet
|
2 baths 3 beds |
show details | |

|
#8
W Poplar Ave
Hermiston, OR 97838
|
2,275 sq. feet
|
2 baths 6 beds |
show details | |

|
#9
NE Montana Ave
Hermiston, OR 97838
|
1,418 sq. feet
|
3 baths 4 beds |
show details | |

|
#10
W Poplar Ave
Hermiston, OR 97838
|
1,272 sq. feet
|
1 baths 3 beds |
show details |
| Photo | Address | Area | Beds / Baths | Price | Details |
|---|---|---|---|---|---|

|
#11
SW Joseph Ave
Hermiston, OR 97838
|
1,824 sq. feet
|
3 baths 5 beds |
show details | |

|
#12
NE 11th St
Hermiston, OR 97838
|
1,353 sq. feet
|
2 baths 3 beds |
show details | |

|
#13
Joy Ln
Hermiston, OR 97838
|
793 sq. feet
|
1 baths 2 beds |
show details | |

|
#14
W Madrona Ave
Hermiston, OR 97838
|
2,579 sq. feet
|
1 baths 3 beds |
show details | |

|
#15
W Orchard Ave
Hermiston, OR 97838
|
864 sq. feet
|
1 baths 2 beds |
show details | |

|
#16
E Sunset Dr
Hermiston, OR 97838
|
738 sq. feet
|
1 baths 2 beds |
show details | |

|
#17
SW 10th Pl
Hermiston, OR 97838
|
1,868 sq. feet
|
1 baths 4 beds |
show details | |

|
#18
Westland Rd
Hermiston, OR 97838
|
- sq. feet
|
2 baths 2 beds |
show details | |

|
#19
Samantha St
Hermiston, OR 97838
|
1,508 sq. feet
|
2 baths 3 beds |
show details | |

|
#20
SW 23rd St
Hermiston, OR 97838
|
1,400 sq. feet
|
1 baths 3 beds |
show details |
| Photo | Address | Area | Beds / Baths | Price | Details |
|---|---|---|---|---|---|

|
#21
NE 11th Pl
Hermiston, OR 97838
|
1,821 sq. feet
|
3 baths 4 beds |
show details | |

|
#22
NW Oregon Avenue
Irrigon, OR 97844
|
- sq. feet
|
2 baths 3 beds |
show details | |

|
#23
E View Dr
Hermiston, OR 97838
|
1,448 sq. feet
|
2 baths 2 beds |
show details | |

|
#24
NW Geer Rd
Hermiston, OR 97838
|
2,469 sq. feet
|
2 baths 4 beds |
show details | |

|
#25
Agnew Rd
Hermiston, OR 97838
|
2,856 sq. feet
|
3 baths 4 beds |
show details | |

|
#26
Martin Dr
Umatilla, OR 97882
|
1,500 sq. feet
|
1 baths 3 beds |
show details | |

|
#27
Madison St
Umatilla, OR 97882
|
988 sq. feet
|
1 baths 3 beds |
show details | |

|
#28
Madison St
Umatilla, OR 97882
|
1,116 sq. feet
|
2 baths 3 beds |
show details | |

|
#29
W Joseph Ave
Hermiston, OR 97838
|
- sq. feet
|
2 baths 3 beds |
show details | |

|
#30
NE 4th St
Hermiston, OR 97838
|
- sq. feet
|
2 baths 3 beds |
show details |
| Photo | Address | Area | Beds / Baths | Price | Details |
|---|---|---|---|---|---|

|
#31
Westland Rd
Hermiston, OR 97838
|
- sq. feet
|
2 baths 3 beds |
show details | |

|
#32
SE 5th St # C
Hermiston, OR 97838
|
- sq. feet
|
- baths - beds |
show details | |

|
#33
Jodie St
Richland, WA 99352
|
- sq. feet
|
- baths - beds |
show details | |

|
#34
NE Marshall Loop
Boardman, OR 97818
|
- sq. feet
|
- baths - beds |
show details | |

|
#35
Ridgeline Dr # P336
Kennewick, WA 99338
|
- sq. feet
|
- baths - beds |
show details | |

|
#36
E Main St # 104
Hermiston, OR 97838
|
- sq. feet
|
- baths - beds |
show details | |

|
#37
NE Emerald Dr
Hermiston, OR 97838
|
- sq. feet
|
- baths - beds |
show details | |

|
#38
Ridgeline Dr # J136
Kennewick, WA 99338
|
- sq. feet
|
- baths - beds |
show details | |

|
#39
SW Coyote Dr
Hermiston, OR 97838
|
- sq. feet
|
- baths - beds |
show details | |

|
#40
NE 8th St
Hermiston, OR 97838
|
- sq. feet
|
- baths - beds |
show details |
| Photo | Address | Area | Beds / Baths | Price | Details |
|---|---|---|---|---|---|

|
#41
SW 11th St Unit 95
Hermiston, OR 97838
|
- sq. feet
|
- baths - beds |
show details | |

|
#42
W Sunland Ave Apt 3
Hermiston, OR 97838
|
- sq. feet
|
- baths - beds |
show details | |

|
#43
Country Heights Dr
Kennewick, WA 99338
|
- sq. feet
|
- baths - beds |
show details | |

|
#44
W Hartley Ave
Hermiston, OR 97838
|
- sq. feet
|
- baths - beds |
show details | |

|
#45
W Juniper Ave Apt 91
Hermiston, OR 97838
|
- sq. feet
|
- baths - beds |
show details | |

|
#46
E Autumn Ave
Hermiston, OR 97838
|
- sq. feet
|
- baths - beds |
show details | |

|
#47
Sagebrush Rd
Hermiston, OR 97838
|
- sq. feet
|
- baths - beds |
show details | |

|
#48
John Day St
Umatilla, OR 97882
|
- sq. feet
|
- baths - beds |
show details | |

|
#49
Orchard St
Umatilla, OR 97882
|
- sq. feet
|
- baths - beds |
show details | |

|
Check over 1 million property listings on Foreclosure.com!
|
browse all offers | |||

Household type by relationship:
Households: 173,751- In family households: 149,464 (33,782 male householders, 11,917 female householders)
35,115 spouses, 54,588 children (50,101 natural, 1,307 adopted, 3,180 stepchildren), 3,467 grandchildren, 1,412 brothers or sisters, 1,200 parents, foster children, 2,096 other relatives, 4,757 non-relatives
- In nonfamily households: 24,287 (9,924 male householders (7,642 living alone)), 9,681 female householders (8,230 living alone)), 4,682 nonrelatives
- In group quarters: 1,426 (1,128 institutionalized population)
30,135 married couples with children.
9,151 single-parent households (2,416 men, 6,735 women).
76.6% of residents of South Benton speak English at home.
20.9% of residents speak Spanish at home (21% speak English very well, 16% speak English well, 28% speak English not well, 36% don't speak English at all).
2.5% of residents speak other Indo-European language at home (100% speak English very well).
Foreign born population: 352 (27.2%)
(26.4% of them are naturalized citizens)
| Here: | 5.7 |
| State: | 6.5 |
| Here: | 6.4 |
| State: | 3.9 |

- Bedrooms in owner-occupied houses and condos in South Benton, Washington
- 2no bedroom
- 291 bedroom
- 272 bedrooms
- 743 bedrooms
- 264 bedrooms
- 35+ bedrooms

- Bedrooms in renter-occupied apartments in South Benton, Washington
- 2no bedroom
- 21 bedroom
- 172 bedrooms
- 503 bedrooms
- 114 bedrooms
- 85+ bedrooms

- Cars and other vehicles available in South Benton in owner-occupied houses/condos
- 23no vehicle
- 131 vehicle
- 872 vehicles
- 293 vehicles
- 94 vehicles
- 05+ vehicles

- Cars and other vehicles available in South Benton in renter-occupied apartments
- 7no vehicle
- 231 vehicle
- 472 vehicles
- 133 vehicles
- 04 vehicles
- 05+ vehicles

- Rooms in owner-occupied houses in South Benton, Washington
- 21 room
- 62 rooms
- 233 rooms
- 204 rooms
- 335 rooms
- 366 rooms
- 177 rooms
- 128 rooms
- 129+ rooms

- Rooms in renter-occupied apartments in South Benton, Washington
- 01 room
- 22 rooms
- 03 rooms
- 294 rooms
- 95 rooms
- 66 rooms
- 127 rooms
- 248 rooms
- 89+ rooms


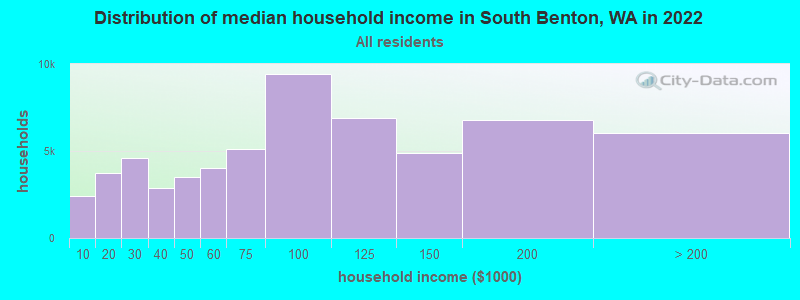
South Benton, WA household income distribution

- 2,414Less than $10,000
- 3,734$10,000 to $19,999
- 4,602$20,000 to $29,999
- 2,854$30,000 to $39,999
- 3,489$40,000 to $49,999
- 4,030$50,000 to $59,999
- 5,138$60,000 to $74,999
- 9,441$75,000 to $99,999
- 6,882$100,000 to $124,999
- 4,885$125,000 to $149,999
- 6,791$150,000 to $199,999
- 6,022$200,000 or more
Percentage of workers working in this county: 81.2%
Number of people working at home: 72 (13.6% of all workers)
Travel time to work (commute)
- Less than 5 minutes: 80
- 5 to 9 minutes: 54
- 10 to 14 minutes: 31
- 15 to 19 minutes: 110
- 20 to 24 minutes: 14
- 25 to 29 minutes: 18
- 30 to 34 minutes: 11
- 35 to 39 minutes: 5
- 40 to 44 minutes: 4
- 45 to 59 minutes: 4
- 60 to 89 minutes: 6
- 90 or more minutes: 4
Means of transportation to work:
- Drove a car alone: 290 (82.9%)
- Carpooled: 22 (6.3%)
- Walked: 29 (8.3%)
- Worked at home: 9 (2.6%)


- Year of entry for the foreign-born population in South Benton, Washington
- 631995 to March 2000
- 541990 to 1994
- 121985 to 1989
- 81980 to 1984
- 41975 to 1979
- 151970 to 1974
- 41965 to 1969
- 11Before 1965
Most common places of birth for foreign-born residents (%):
| South Benton: | 95.3% (163) |
| Washington: | 24.1% (148,115) |
| South Benton: | 2.3% (4) |
| Washington: | 3.3% (20,530) |
| South Benton: | 2.3% (4) |
| Washington: | 0.1% (739) |
Place of birth for U.S.-born residents:
- This state: 392
- Other state: 302
- Northeast: 8
- Midwest: 33
- South: 40
- West: 221
46% of South Benton residents lived in the same house 5 years ago.
Out of people who lived in different houses, 29% lived in this county.
Out of people who lived in different counties, 47% lived in Washington.
Education attainment for males 25 years and older:
- No schooling: 31
- Nursery to 4th grade: 7
- 5th and 6th grade: 17
- 7th and 8th grade: 18
- 9th grade: 8
- 10th grade: 17
- 11th grade: 8
- 12th grade, no diploma: 8
- High school graduate (or equivalency): 59
- Less than 1 year of college: 9
- Some college more than 1 year, no degree: 23
- Associate degree: 23
- Bachelor's degree: 13
- Master's degree: 10
- Professional school degree: 0
- Doctorate degree: 11

Education attainment for females 25 years and older:
- No schooling: 21
- Nursery to 4th grade: 1
- 5th and 6th grade: 6
- 7th and 8th grade: 4
- 9th grade: 2
- 10th grade: 0
- 11th grade: 2
- 12th grade, no diploma: 13
- High school graduate (or equivalency): 115
- Less than 1 year of college: 12
- Some college more than 1 year, no degree: 37
- Associate degree: 12
- Bachelor's degree: 10
- Master's degree: 0
- Professional school degree: 0
- Doctorate degree: 0


Housing units in structures:
- One, detached: 79
- One, attached: 2
- Mobile homes: 197
- Boats, RVs, vans, etc.: 7
Median worth of mobile homes: $132,158
Housing units lacking complete kitchen facilities: 1.1%

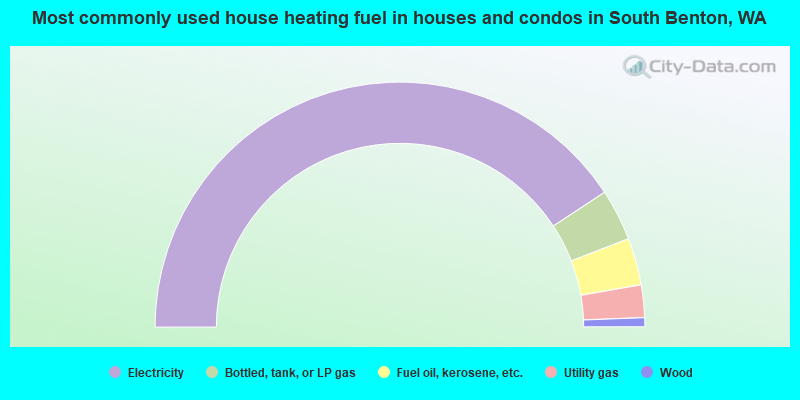
- 81.4%Electricity
- 6.8%Bottled, tank, or LP gas
- 6.2%Fuel oil, kerosene, etc.
- 4.3%Utility gas
- 1.2%Wood
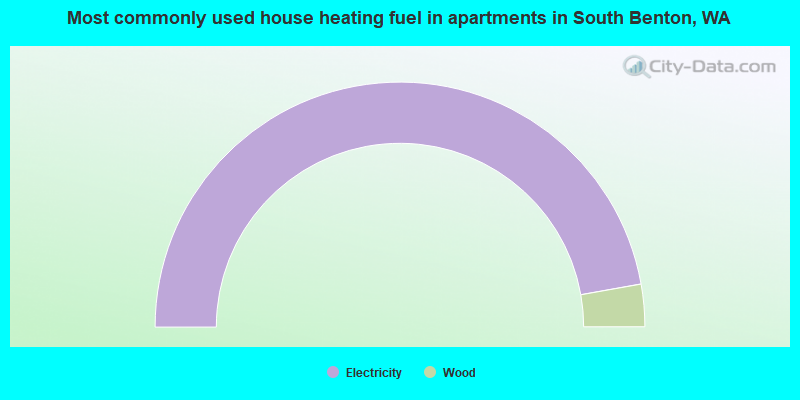
- 94.4%Electricity
- 5.6%Wood
Private vs. public school enrollment:
| Here: | 11.4% |
| Washington: | 9.2% |
| Here: | 10.1% |
| Washington: | 7.0% |
| Here: | 0.0% |
| Washington: | 15.7% |


