Smyrna, DE (Delaware) Houses and Residents
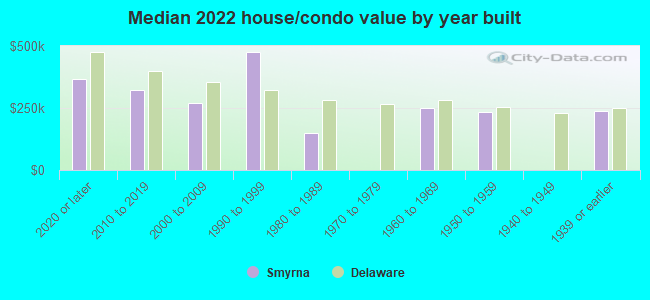
| Smyrna: | $278,795 |
| Delaware: | $337,200 |
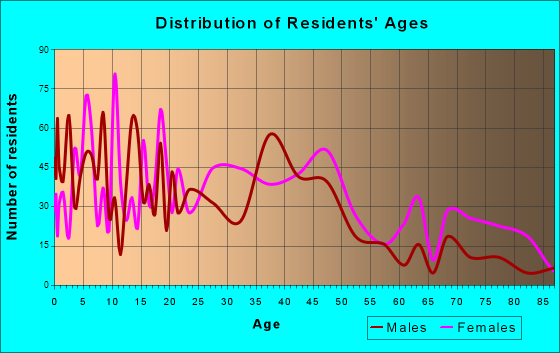
Total population: 11,170 (Urban population: 5,326 (all inside urban clusters), Rural population: 51 (all nonfarm))
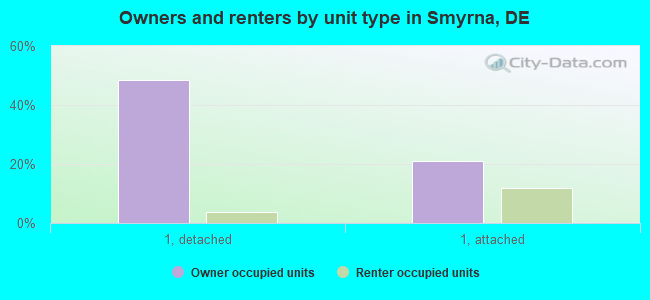
Houses: 5,306 (4,972 occupied: 3,465 owner occupied, 1,624 renter occupied)
| % of renters here: | 32% |
| State: | 26% |
Housing density: 1,441 houses/condos per square mile
Median price asked for vacant for-sale houses and condos in 2022: $212,356.
Median contract rent in 2022: $1,176 (lower quartile is $834, upper quartile is $1,356)
Median rent asked for vacant for-rent units in 2022: $1,565
Median gross rent in Smyrna, DE in 2022: $1,369
Housing units in Smyrna with a mortgage: 2,918 (107 second mortgage, 0 home equity loan, 110 both second mortgage and home equity loan)
Houses without a mortgage: 92
Median household income for houses/condos with a mortgage: $80,138
Median household income for apartments without a mortgage: $61,341
Median monthly housing costs: $1,410
Compare current foreclosures in Smyrna, DE:
| Photo | Address | Area | Beds / Baths | Price | Details |
|---|---|---|---|---|---|

|
#1
Bryn Zion Rd
Smyrna, DE 19977
|
3,228 sq. feet
|
4 baths 3 beds |
show details | |

|
#2
E North St
Smyrna, DE 19977
|
1,189 sq. feet
|
1 baths 4 beds |
show details | |

|
#3
Red Maple Rd
Smyrna, DE 19977
|
2,557 sq. feet
|
1 baths 3 beds |
show details | |

|
#4
Garrisons Lake Blvd
Smyrna, DE 19977
|
1,722 sq. feet
|
2 baths 3 beds |
show details | |

|
#5
Arctic Ln
Smyrna, DE 19977
|
1,684 sq. feet
|
3 baths 3 beds |
show details | |

|
#6
E Frazier St
Smyrna, DE 19977
|
1,222 sq. feet
|
1 baths 3 beds |
show details | |

|
#7
Cedarbrook Dr
Smyrna, DE 19977
|
1,061 sq. feet
|
1 baths 2 beds |
show details | |

|
#8
Pebble Creek Dr
Smyrna, DE 19977
|
4,002 sq. feet
|
2 baths 3 beds |
show details | |

|
#9
Boxwood Dr
Smyrna, DE 19977
|
2,088 sq. feet
|
2 baths 3 beds |
show details | |

|
#10
Rons Way
Smyrna, DE 19977
|
1,232 sq. feet
|
2 baths 3 beds |
show details |
| Photo | Address | Area | Beds / Baths | Price | Details |
|---|---|---|---|---|---|

|
#11
White Rabbit Dr
Smyrna, DE 19977
|
1,462 sq. feet
|
2 baths 3 beds |
show details | |

|
#12
Apoorva Ln
Smyrna, DE 19977
|
3,300 sq. feet
|
2 baths 4 beds |
show details | |

|
#13
Nugent Loop
Smyrna, DE 19977
|
1,708 sq. feet
|
2 baths 4 beds |
show details | |

|
#14
Sequoia Dr
Smyrna, DE 19977
|
1,738 sq. feet
|
2 baths 3 beds |
show details | |

|
#15
Paul Dr
Smyrna, DE 19977
|
1,581 sq. feet
|
1 baths 4 beds |
show details | |

|
#16
E Braeburn Dr
Smyrna, DE 19977
|
2,384 sq. feet
|
2 baths 4 beds |
show details | |

|
#17
Salerno Dr
Smyrna, DE 19977
|
1,200 sq. feet
|
2 baths 3 beds |
show details | |

|
#18
Montclair Ave
Smyrna, DE 19977
|
1,447 sq. feet
|
2 baths 3 beds |
show details | |

|
#19
Sheridan Ln
Smyrna, DE 19977
|
2,968 sq. feet
|
3 baths 4 beds |
show details | |

|
#20
W South St
Smyrna, DE 19977
|
2,177 sq. feet
|
2 baths 3 beds |
show details |
| Photo | Address | Area | Beds / Baths | Price | Details |
|---|---|---|---|---|---|

|
#21
Liborio Ln
Smyrna, DE 19977
|
1,428 sq. feet
|
2 baths 3 beds |
show details | |

|
#22
Sorrell Cir
Smyrna, DE 19977
|
1,413 sq. feet
|
2 baths 2 beds |
show details | |

|
#23
Michael Dr
Smyrna, DE 19977
|
- sq. feet
|
2 baths 3 beds |
show details | |

|
#24
Malvern Ln Apt 11
Smyrna, DE 19977
|
- sq. feet
|
- baths - beds |
show details | |

|
#25
Buckeye Ln
Smyrna, DE 19977
|
- sq. feet
|
- baths - beds |
show details | |

|
#26
Loren St
Smyrna, DE 19977
|
- sq. feet
|
- baths - beds |
show details | |

|
#27
Zelkova Rd
Smyrna, DE 19977
|
- sq. feet
|
- baths - beds |
show details | |

|
#28
Streamside Cir Apt 2
Smyrna, DE 19977
|
- sq. feet
|
- baths - beds |
show details | |

|
#29
Cambria Ln
Smyrna, DE 19977
|
- sq. feet
|
- baths - beds |
show details | |

|
#30
Willowwood Dr
Smyrna, DE 19977
|
- sq. feet
|
- baths - beds |
show details |
| Photo | Address | Area | Beds / Baths | Price | Details |
|---|---|---|---|---|---|

|
#31
Sedmont Cir
Smyrna, DE 19977
|
- sq. feet
|
- baths - beds |
show details | |

|
#32
Felix View Ct
Smyrna, DE 19977
|
- sq. feet
|
- baths - beds |
show details | |

|
#33
Addison Rd
Smyrna, DE 19977
|
- sq. feet
|
- baths - beds |
show details | |

|
#34
Malvern Ln # 5
Smyrna, DE 19977
|
- sq. feet
|
- baths - beds |
show details | |

|
#35
Trouble Ln
Smyrna, DE 19977
|
- sq. feet
|
- baths - beds |
show details | |

|
#36
Loder Dr
Smyrna, DE 19977
|
- sq. feet
|
- baths - beds |
show details | |

|
#37
Alexandria Way
Smyrna, DE 19977
|
- sq. feet
|
- baths - beds |
show details | |

|
#38
Nursery Ln
Smyrna, DE 19977
|
- sq. feet
|
- baths - beds |
show details | |

|
#39
Foxtrail Rd
Smyrna, DE 19977
|
- sq. feet
|
- baths - beds |
show details | |

|
#40
S Howard St
Smyrna, DE 19977
|
- sq. feet
|
- baths - beds |
show details |
| Photo | Address | Area | Beds / Baths | Price | Details |
|---|---|---|---|---|---|

|
#41
Grant Ln
Smyrna, DE 19977
|
- sq. feet
|
- baths - beds |
show details | |

|
#42
Heritage Trce
Smyrna, DE 19977
|
- sq. feet
|
- baths - beds |
show details | |

|
#43
Climbing Vine Ave
Smyrna, DE 19977
|
- sq. feet
|
- baths - beds |
show details | |

|
#44
Bryn Ln
Smyrna, DE 19977
|
- sq. feet
|
- baths - beds |
show details | |

|
#45
Climbing Vine Ave
Smyrna, DE 19977
|
- sq. feet
|
- baths - beds |
show details | |

|
#46
E Constitution Dr
Smyrna, DE 19977
|
- sq. feet
|
- baths - beds |
show details | |

|
Check over 1 million property listings on Foreclosure.com!
|
browse all offers | |||

Latest news about housing in Smyrna, DE collected exclusively by city-data.com from local newspapers, TV, and radio stations


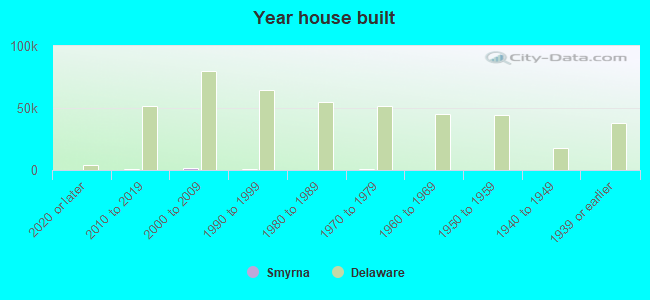
Median year apartment built: 1999
Household type by relationship:
Households: 13,190- Male householders: 1,997 (545 living alone), Female householders: 2,880 (729 living alone)
2,367 spouses (2,333 opposite-sex spouses), 371 unmarried partners, (371 opposite-sex unmarried partners), 3,916 children (3,728 natural, 32 adopted, 154 stepchildren), 515 grandchildren, 243 brothers or sisters, 69 parents, 1 foster children, 204 other relatives, 434 non-relatives
- In group quarters: 188
Size of family households: 1,339 2-persons, 735 3-persons, 939 4-persons, 531 5-persons, 20 6-persons, 31 7-or-more-persons.
Size of nonfamily households: 1,326 1-person, 134 2-persons, 55 3-persons, 18 5-persons.
1,824 married couples with children.
962 single-parent households (286 men, 676 women).
94.9% of residents of Smyrna speak English at home.
1.1% of residents speak Spanish at home (62% speak English very well, 21% speak English well, 17% speak English not well).
1.6% of residents speak other Indo-European language at home (2% speak English very well, 88% speak English well, 10% speak English not well).
2.5% of residents speak Asian or Pacific Island language at home (48% speak English very well, 25% speak English well, 26% speak English not well).
Foreign born population: 716 (5.4%)
(76.0% of them are naturalized citizens)
| Here: | 6.4 |
| State: | 6.9 |
| Here: | 4.8 |
| State: | 4.4 |
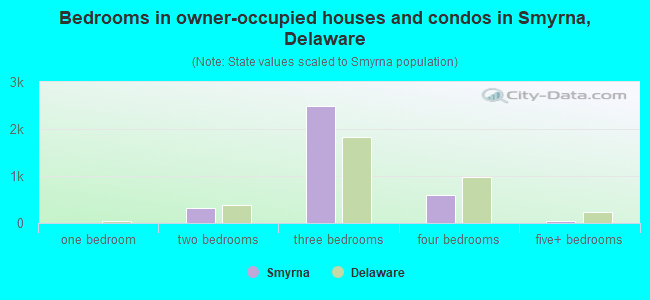
- Bedrooms in owner-occupied houses and condos in Smyrna, Delaware
- 0no bedroom
- 01 bedroom
- 3292 bedrooms
- 2,4963 bedrooms
- 5944 bedrooms
- 475+ bedrooms
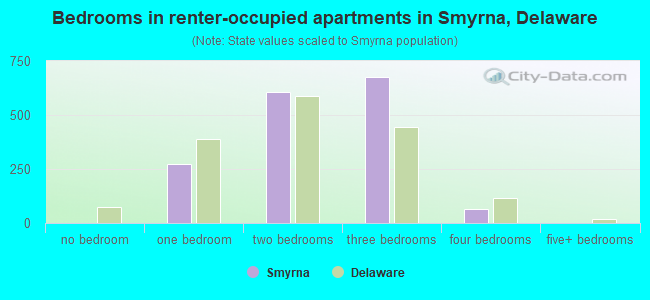
- Bedrooms in renter-occupied apartments in Smyrna, Delaware
- 0no bedroom
- 2751 bedroom
- 6082 bedrooms
- 6763 bedrooms
- 664 bedrooms
- 05+ bedrooms
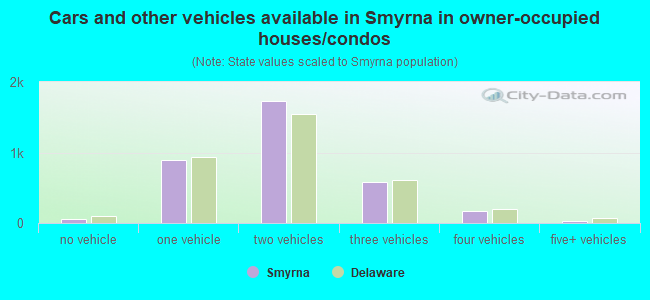
- Cars and other vehicles available in Smyrna in owner-occupied houses/condos
- 61no vehicle
- 8991 vehicle
- 1,7262 vehicles
- 5823 vehicles
- 1704 vehicles
- 295+ vehicles
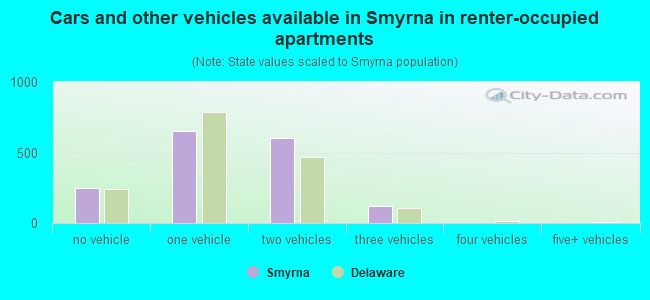
- Cars and other vehicles available in Smyrna in renter-occupied apartments
- 251no vehicle
- 6491 vehicle
- 6042 vehicles
- 1203 vehicles
- 04 vehicles
- 05+ vehicles
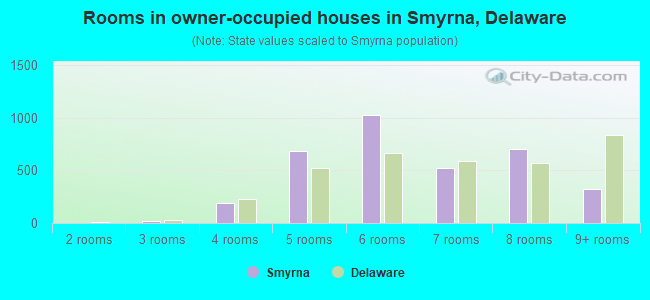
- Rooms in owner-occupied houses in Smyrna, Delaware
- 01 room
- 02 rooms
- 183 rooms
- 1934 rooms
- 6825 rooms
- 1,0286 rooms
- 5217 rooms
- 7018 rooms
- 3239+ rooms
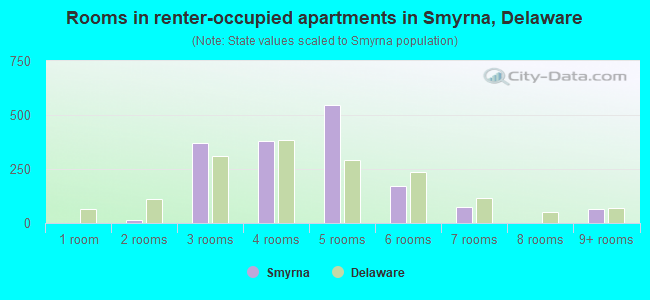
- Rooms in renter-occupied apartments in Smyrna, Delaware
- 01 room
- 162 rooms
- 3723 rooms
- 3784 rooms
- 5465 rooms
- 1716 rooms
- 767 rooms
- 08 rooms
- 669+ rooms
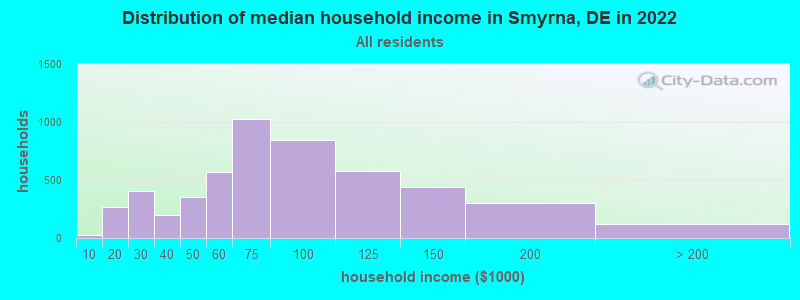
Smyrna, DE household income distribution

- 22Less than $10,000
- 265$10,000 to $19,999
- 406$20,000 to $29,999
- 194$30,000 to $39,999
- 351$40,000 to $49,999
- 565$50,000 to $59,999
- 1,030$60,000 to $74,999
- 841$75,000 to $99,999
- 580$100,000 to $124,999
- 436$125,000 to $149,999
- 306$150,000 to $199,999
- 118$200,000 or more
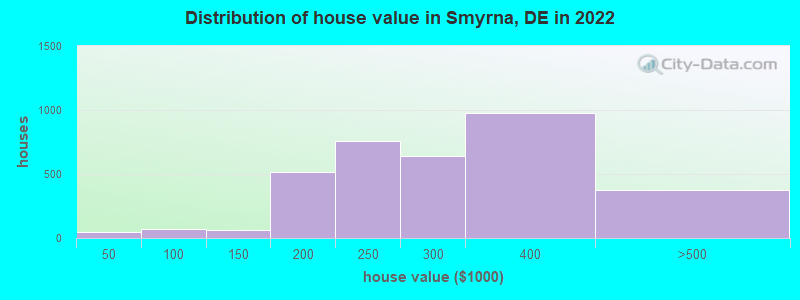
Home value of owner - occupied houses in 2022 in Smyrna, DE
-
- 25$20,000 to $24,999
- 24$35,000 to $39,999
- 66$70,000 to $79,999
- 7$90,000 to $99,999
- 31$100,000 to $124,999
- 29$125,000 to $149,999
- 58$150,000 to $174,999
- 457$175,000 to $199,999
- 755$200,000 to $249,999
- 643$250,000 to $299,999
- 978$300,000 to $399,999
- 376$400,000 to $499,999
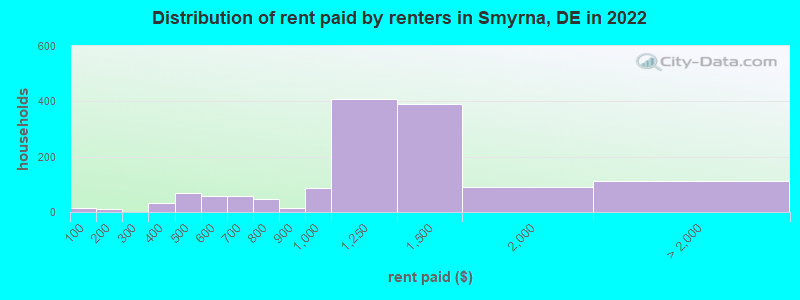
Rent paid by renters in 2022 in Smyrna, DE
-
- 14Less than $100
- 10$100 to $149
- 1$150 to $199
- 5$300 to $349
- 25$350 to $399
- 67$400 to $449
- 58$550 to $599
- 58$650 to $699
- 20$700 to $749
- 26$750 to $799
- 15$800 to $899
- 85$900 to $999
- 408$1,000 to $1,249
- 389$1,250 to $1,499
- 89$1,500 to $1,999
- 17$2,000 to $2,499
- 92No cash rent
Percentage of workers working in this county: 57.9%
Number of people working at home: 566 (8.3% of all workers)
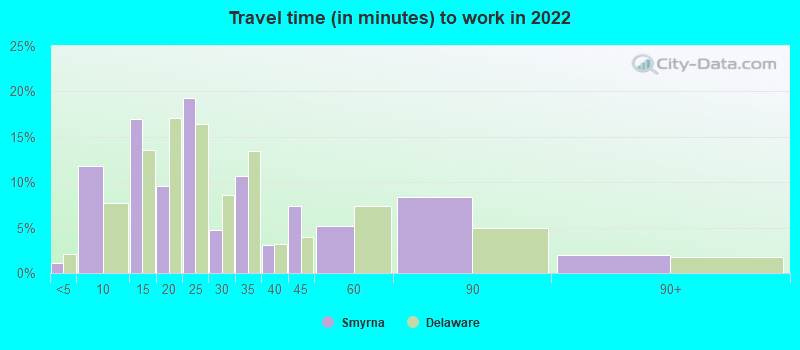
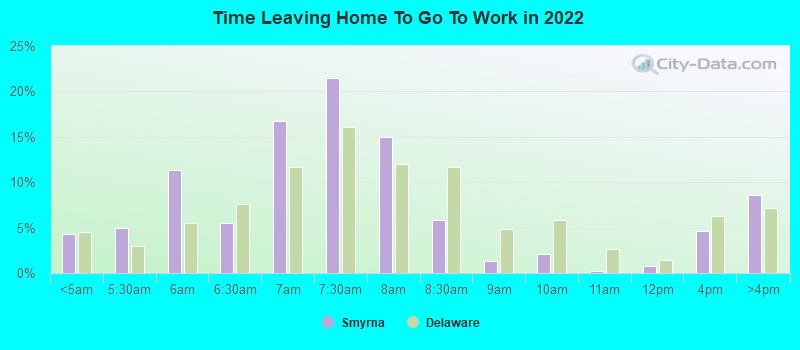
Travel time to work (commute)
- Less than 5 minutes: 63
- 5 to 9 minutes: 581
- 10 to 14 minutes: 299
- 15 to 19 minutes: 654
- 20 to 24 minutes: 994
- 25 to 29 minutes: 671
- 30 to 34 minutes: 1,060
- 35 to 39 minutes: 219
- 40 to 44 minutes: 132
- 45 to 59 minutes: 818
- 60 to 89 minutes: 526
- 90 or more minutes: 329
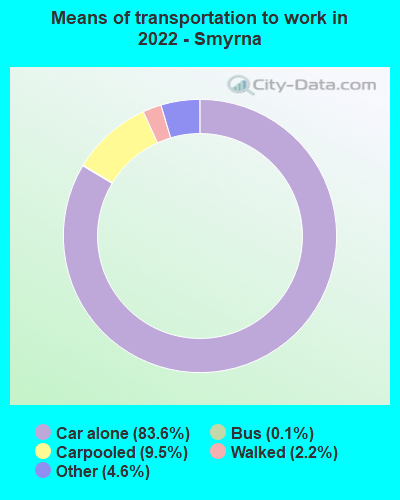
Means of transportation to work:
- Drove a car alone: 4,063 (74.5%)
- Carpooled: 489 (9.0%)
- Bus: 7 (0.1%)
- Taxi: 282 (5.2%)
- Walked: 91 (1.7%)
- Worked at home: 566 (10.4%)
- Unemployment by race in 2022
- Unemployment rate for White non-Hispanic residents
- 0.6%Males
- 9.1%Females
- Unemployment rate for Black residents
- 0.8%Males
- 13.0%Females
- Unemployment rate for Asian residents
- 23.5%Males
- 2.6%Females
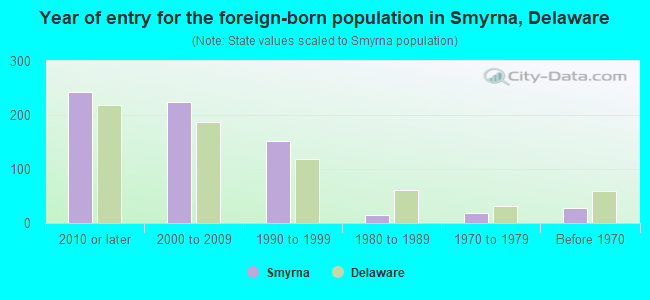
- Year of entry for the foreign-born population in Smyrna, Delaware
- 2422010 or later
- 2242000 to 2009
- 1511990 to 1999
- 151980 to 1989
- 191970 to 1979
- 27Before 1970
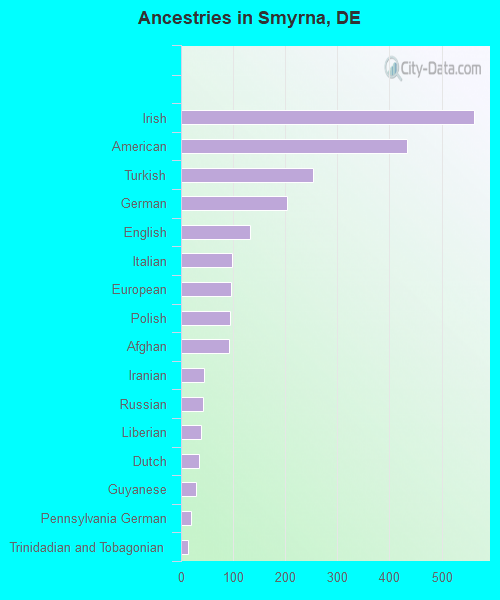
First ancestries reported:
- Irish: 563 (9.2%)
- American: 433 (7.1%)
- Turkish: 253 (4.1%)
- German: 204 (3.3%)
- English: 133 (2.2%)
- Italian: 98 (1.6%)
- European: 96 (1.6%)
- Polish: 95 (1.6%)
- Afghan: 92 (1.5%)
- Iranian: 44 (0.7%)
- Russian: 43 (0.7%)
- Liberian: 38 (0.6%)
- Dutch: 34 (0.6%)
- Guyanese: 28 (0.5%)
- Pennsylvania German: 20 (0.3%)
- Trinidadian and Tobagonian: 14 (0.2%)
- Nigerian: 5 (0.08%)
- British: 4 (0.07%)
- Haitian: 3 (0.05%)
- African: 1 (0.02%)
Most common places of birth for foreign-born residents (%):
| Smyrna: | 24.6% (165) |
| Delaware: | 0.2% (174) |
| Smyrna: | 21.9% (147) |
| Delaware: | 1.6% (1,518) |
| Smyrna: | 19.1% (128) |
| Delaware: | 1.1% (1,064) |
| Smyrna: | 7.5% (50) |
| Delaware: | 1.4% (1,373) |
| Smyrna: | 6.3% (42) |
| Delaware: | 0.7% (659) |
| Smyrna: | 5.5% (37) |
| Delaware: | 5.7% (5,583) |
| Smyrna: | 4.5% (30) |
| Delaware: | 3.2% (3,065) |
| Smyrna: | 4.5% (30) |
| Delaware: | 15.3% (14,887) |
| Smyrna: | 3.7% (25) |
| Delaware: | 0.5% (503) |
| Smyrna: | 3.3% (22) |
| Delaware: | 0.9% (911) |
| Smyrna: | 2.1% (14) |
| Delaware: | 1.4% (1,386) |
Place of birth for U.S.-born residents:
- This state: 7,881
- Other state: 4,403
- Northeast: 3,279
- Midwest: 180
- South: 1,073
- West: 26
90.2% of Smyrna residents lived in the same house 1 years ago.
Out of people who lived in different houses, 28.8% lived in this county.
Out of people who lived in different counties, 74.3% lived in Delaware.
| Smyrna: | 90.2% |
| State average: | 89.2% |
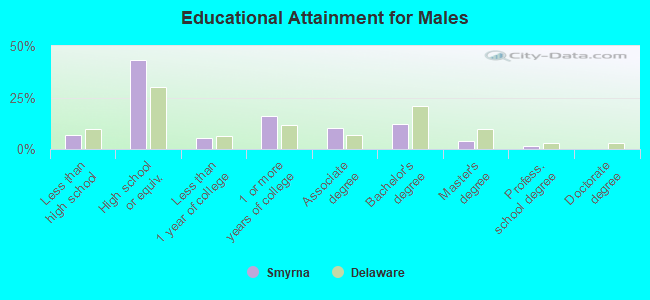
Education attainment for males 25 years and older:
- No schooling: 0
- Nursery to 4th grade: 0
- 5th and 6th grade: 0
- 7th and 8th grade: 3
- 9th grade: 26
- 10th grade: 115
- 11th grade: 55
- 12th grade, no diploma: 89
- High school graduate (or equivalency): 1,779
- Less than 1 year of college: 223
- Some college more than 1 year, no degree: 668
- Associate degree: 424
- Bachelor's degree: 499
- Master's degree: 169
- Professional school degree: 59
- Doctorate degree: 0
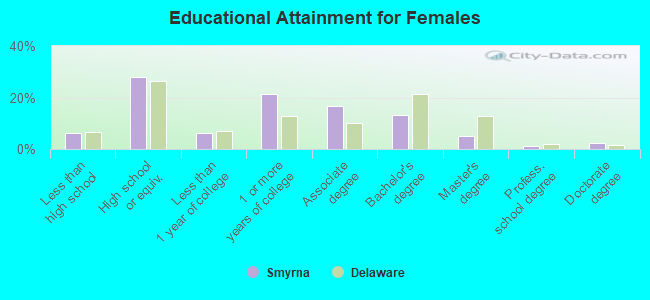
Education attainment for females 25 years and older:
- No schooling: 81
- Nursery to 4th grade: 0
- 5th and 6th grade: 0
- 7th and 8th grade: 7
- 9th grade: 23
- 10th grade: 32
- 11th grade: 54
- 12th grade, no diploma: 115
- High school graduate (or equivalency): 1,407
- Less than 1 year of college: 303
- Some college more than 1 year, no degree: 1,066
- Associate degree: 842
- Bachelor's degree: 666
- Master's degree: 251
- Professional school degree: 58
- Doctorate degree: 115
Housing units in structures:
- One, detached: 2,525
- One, attached: 1,596
- Two: 189
- 3 or 4: 263
- 5 to 9: 446
- 10 to 19: 182
- 20 to 49: 3
- 50 or more: 12
- Mobile homes: 87
Housing units lacking complete kitchen facilities in 2022: 3.2%
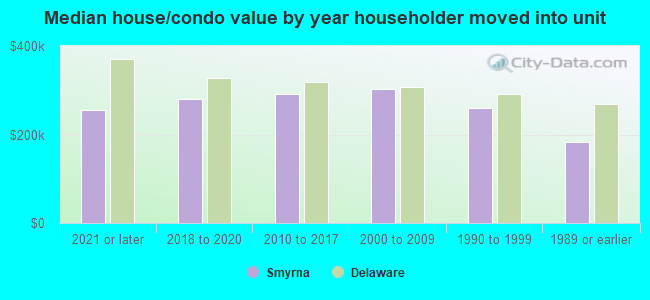
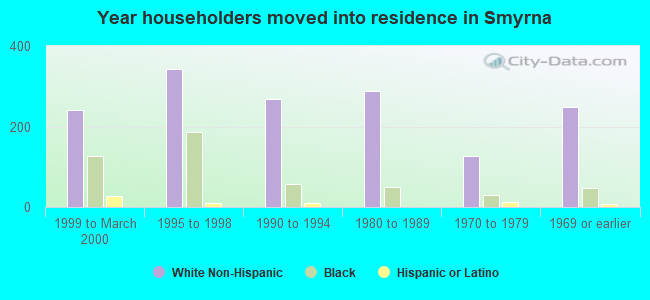
House/condo owner moved in on average 7 years ago
Renter moved in on average 5 years ago
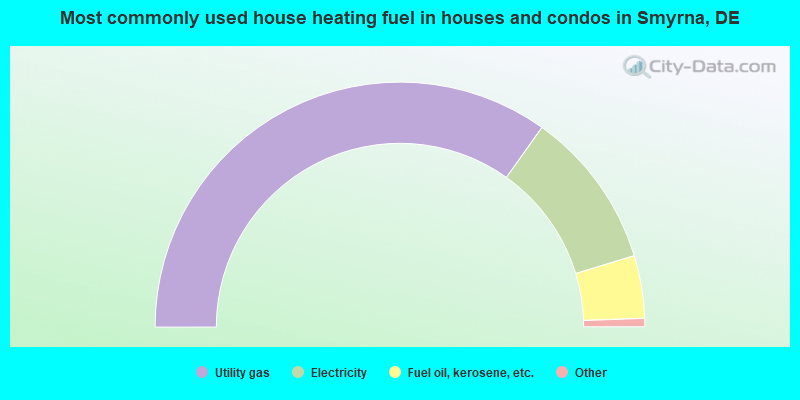
- 69.7%Utility gas
- 20.9%Electricity
- 8.3%Fuel oil, kerosene, etc.
- 0.6%Other fuel
- 0.5%Bottled, tank, or LP gas
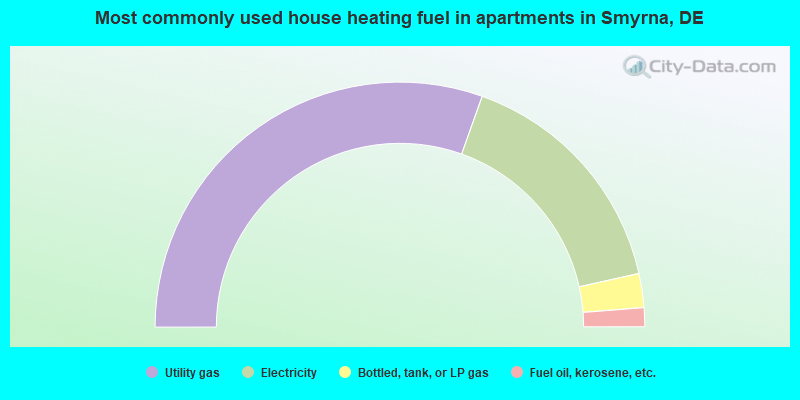
- 60.9%Utility gas
- 32.1%Electricity
- 4.5%Bottled, tank, or LP gas
- 2.5%Fuel oil, kerosene, etc.
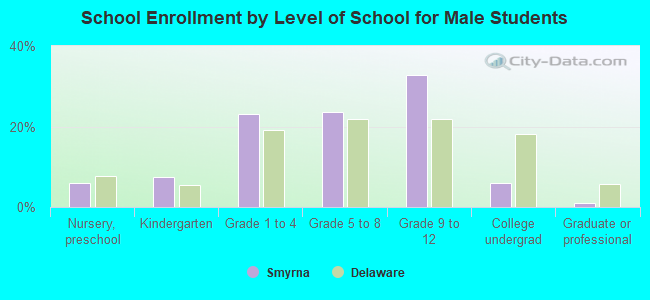
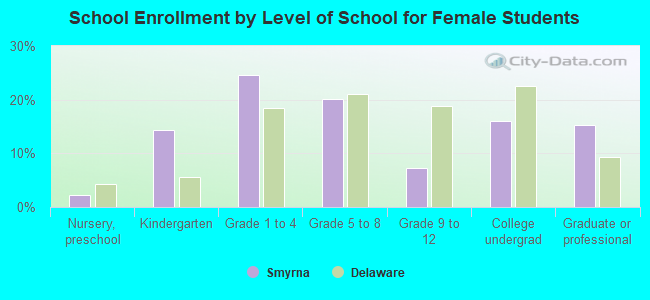
Private vs. public school enrollment:
| Here: | 11.2% |
| Delaware: | 11.5% |
| Here: | 5.8% |
| Delaware: | 12.1% |
| Here: | 23.9% |
| Delaware: | 19.2% |