Housing density: 258 houses/condos per square mile
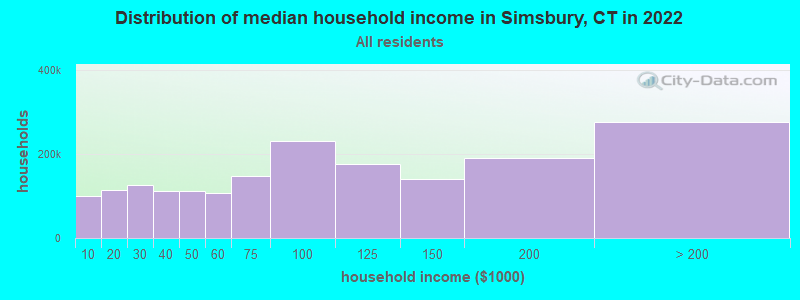
Median price asked for vacant for-sale houses and condos in 2022 in this county: $360,195.
Median contract rent in 2022: $1,392 (lower quartile is $1,083, upper quartile is $1,851)
Median rent asked for vacant for-rent units in 2022: $852
Median gross rent in Simsbury, CT in 2022: $1,607
Housing units in Simsbury with a mortgage: 5,269 (530 second mortgage, 801 home equity loan, 44 both second mortgage and home equity loan) Houses without a mortgage: 1,453
In family households: 715,089 (143,179 male householders, 84,652 female householders)
161,327 spouses, 258,438 children (243,975 natural, 5,783 adopted, 8,680 stepchildren), 15,602 grandchildren, 8,779 brothers or sisters, 9,385 parents, foster children, 10,085 other relatives, 18,701 non-relatives
In nonfamily households: 150,698 (54,155 male householders (41,831 living alone)), 68,868 female householders (58,693 living alone)), 27,675 nonrelatives
In group quarters: 28,227 (15,383 institutionalized population)
135,700 married couples with children.
56,984 single-parent households (8,611 men, 48,373 women).
91.6% of residents of Simsbury speak English at home.
1.7% of residents speak Spanish at home (68% speak English very well, 19% speak English well, 13% speak English not well).
5.2% of residents speak other Indo-European language at home (78% speak English very well, 17% speak English well, 5% speak English not well).
1.2% of residents speak Asian or Pacific Island language at home (64% speak English very well, 19% speak English well, 17% speak English not well).
0.3% of residents speak other language at home (85% speak English very well, 15% speak English well).
Foreign born population: 2,311 (9.4%)
(75.9% of them are naturalized citizens)
Year of entry for the foreign-born population in Simsbury, Connecticut
2861995 to March 2000
1291990 to 1994
1751985 to 1989
1511980 to 1984
1151975 to 1979
681970 to 1974
1921965 to 1969
384Before 1965
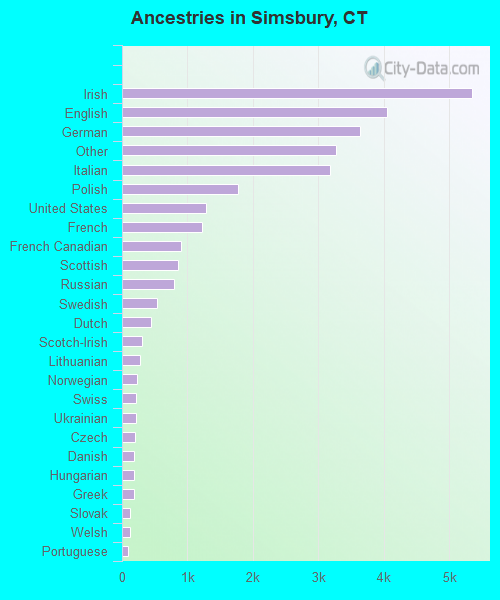
First ancestries reported:
Irish: 5,341 (17.9%)
English: 4,053 (13.6%)
German: 3,636 (12.2%)
Other: 3,273 (11.0%)
Italian: 3,172 (10.6%)
Polish: 1,775 (6.0%)
United States: 1,282 (4.3%)
French: 1,223 (4.1%)
French Canadian: 902 (3.0%)
Scottish: 853 (2.9%)
Russian: 797 (2.7%)
Swedish: 534 (1.8%)
Dutch: 444 (1.5%)
Scotch-Irish: 308 (1.0%)
Lithuanian: 269 (0.9%)
Norwegian: 229 (0.8%)
Swiss: 220 (0.7%)
Ukrainian: 208 (0.7%)
Czech: 196 (0.7%)
Danish: 184 (0.6%)
Hungarian: 178 (0.6%)
Greek: 176 (0.6%)
Slovak: 126 (0.4%)
Welsh: 120 (0.4%)
Portuguese: 91 (0.3%)
Subsaharan African: 79 (0.3%)
Arab: 73 (0.2%)
West Indian: 67 (0.2%)
Most common places of birth for foreign-born residents (%):
India
Simsbury:
11.9% (178)
Connecticut:
4.1% (15,108)
Canada
Simsbury:
10.4% (156)
Connecticut:
5.2% (19,083)
Germany
Simsbury:
7.5% (113)
Connecticut:
3.1% (11,432)
Poland
Simsbury:
7.2% (108)
Connecticut:
6.9% (25,507)
United Kingdom
Simsbury:
5.8% (87)
Connecticut:
4.4% (16,395)
China, excluding Hong Kong and Taiwan
Simsbury:
5.1% (77)
Connecticut:
2.5% (9,358)
Other Western Europe
Simsbury:
4.3% (64)
Connecticut:
0.5% (1,983)
Italy
Simsbury:
3.9% (59)
Connecticut:
7.0% (26,023)
Vietnam
Simsbury:
3.7% (56)
Connecticut:
1.8% (6,680)
Sweden
Simsbury:
2.4% (36)
Connecticut:
0.4% (1,374)
Other Eastern Europe
Simsbury:
2.3% (34)
Connecticut:
2.1% (7,596)
Korea
Simsbury:
2.1% (31)
Connecticut:
1.5% (5,508)
Jamaica
Simsbury:
2.1% (31)
Connecticut:
7.2% (26,819)
Spain
Simsbury:
2.0% (30)
Connecticut:
0.4% (1,463)
Ukraine
Simsbury:
1.9% (28)
Connecticut:
1.0% (3,822)
South Africa
Simsbury:
1.9% (28)
Connecticut:
0.3% (1,269)
Ireland
Simsbury:
1.7% (26)
Connecticut:
1.2% (4,344)
Israel
Simsbury:
1.7% (26)
Connecticut:
0.3% (1,242)
Yugoslavia
Simsbury:
1.6% (24)
Connecticut:
0.5% (1,894)
Place of birth for U.S.-born residents:
This state: 10,993
Other state: 10,522
Northeast: 6,749
Midwest: 1,656
South: 1,431
West: 686
62% of Simsbury residents lived in the same house 5 years ago. Out of people who lived in different houses, 60% lived in this county. Out of people who lived in different counties, 22% lived in Connecticut.
Education attainment for males 25 years and older:
No schooling: 21
Nursery to 4th grade: 6
5th and 6th grade: 30
7th and 8th grade: 60
9th grade: 35
10th grade: 34
11th grade: 45
12th grade, no diploma: 74
High school graduate (or equivalency): 781
Less than 1 year of college: 191
Some college more than 1 year, no degree: 667
Associate degree: 350
Bachelor's degree: 2,817
Master's degree: 1,343
Professional school degree: 646
Doctorate degree: 181
Education attainment for females 25 years and older:
No schooling: 27
Nursery to 4th grade: 4
5th and 6th grade: 45
7th and 8th grade: 111
9th grade: 103
10th grade: 50
11th grade: 47
12th grade, no diploma: 157
High school graduate (or equivalency): 1,108
Less than 1 year of college: 387
Some college more than 1 year, no degree: 992
Associate degree: 676
Bachelor's degree: 2,712
Master's degree: 1,571
Professional school degree: 200
Doctorate degree: 63
Housing units in structures:
One, detached: 7,111
One, attached: 347
Two: 188
3 or 4: 336
5 to 9: 413
10 to 19: 149
20 to 49: 157
50 or more: 19
Mobile homes: 14
Boats, RVs, vans, etc.: 5
Median worth of mobile homes: $1,025,970
Housing units lacking complete kitchen facilities: 0.2%