Housing density: 1,078 houses/condos per square mile
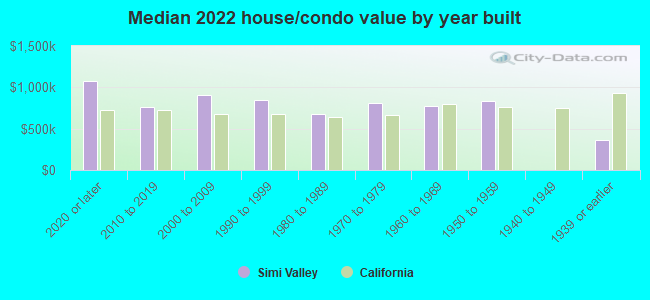
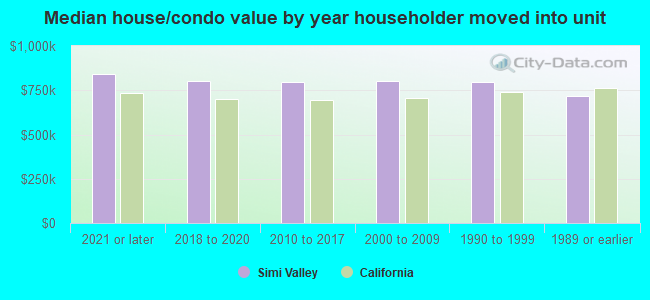
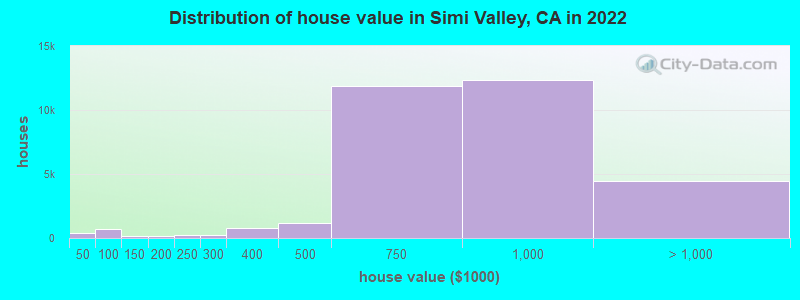
Median price asked for vacant for-sale houses and condos in 2022: $993,067.
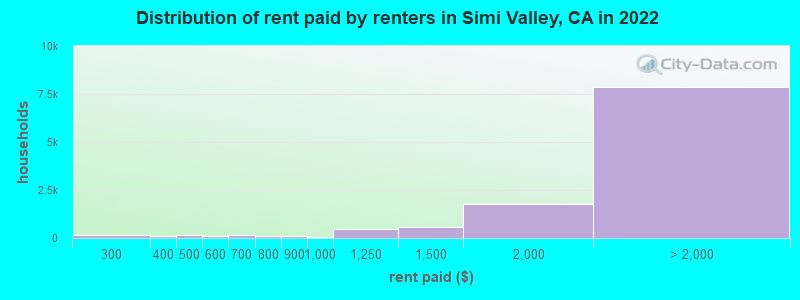
Median contract rent in 2022: over $2,000 (lower quartile is $1,634, upper quartile is over $2,000)
Median rent asked for vacant for-rent units in 2022: $1,878
Median gross rent in Simi Valley, CA in 2022: over $2,000
Housing units in Simi Valley with a mortgage: 21,908 (2,052 second mortgage, 0 home equity loan, 1,899 both second mortgage and home equity loan) Houses without a mortgage: 309
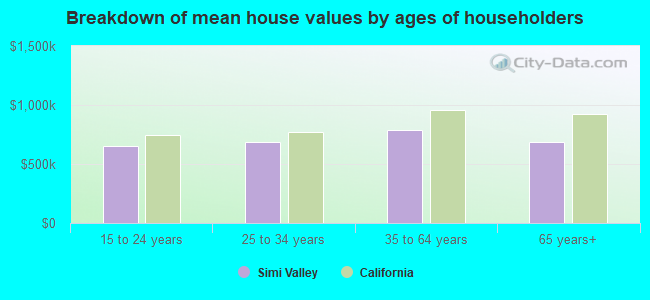
Median household income for houses/condos with a mortgage: $138,877
Median household income for apartments without a mortgage: $84,489
19,469 married couples with children.
4,117 single-parent households (1,230 men, 2,887 women).
72.2% of residents of Simi Valley speak English at home.
15.6% of residents speak Spanish at home (60% speak English very well, 20% speak English well, 13% speak English not well, 6% don't speak English at all).
5.6% of residents speak other Indo-European language at home (74% speak English very well, 17% speak English well, 6% speak English not well, 3% don't speak English at all).
5.9% of residents speak Asian or Pacific Island language at home (66% speak English very well, 22% speak English well, 9% speak English not well, 3% don't speak English at all).
0.8% of residents speak other language at home (57% speak English very well, 29% speak English well, 14% speak English not well).
Foreign born population: 26,794 (21.5%)
(58.6% of them are naturalized citizens)
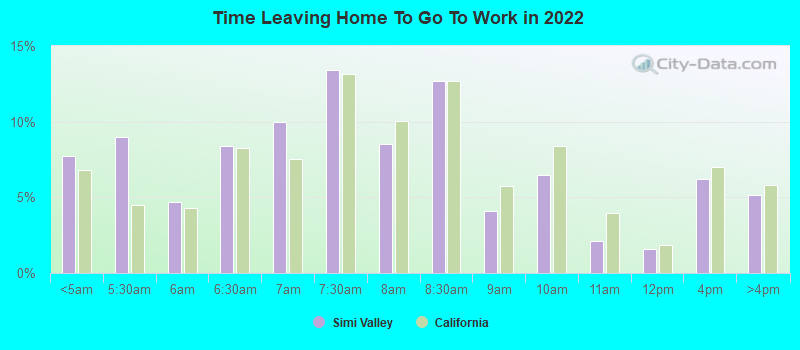
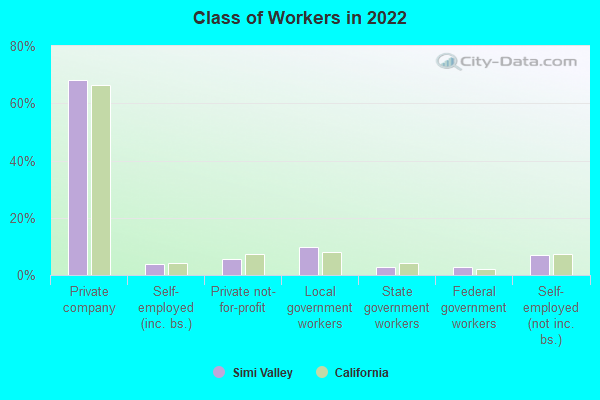
Percentage of workers working in this county: 69.1% Number of people working at home: 11,683 (17.7% of all workers)
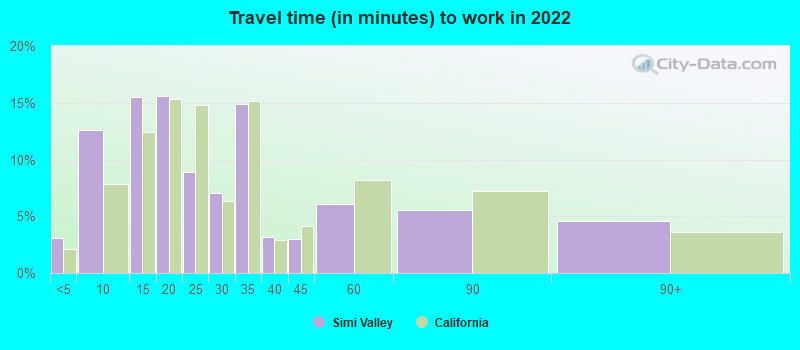
Travel time to work (commute)
Less than 5 minutes: 914
5 to 9 minutes: 5,328
10 to 14 minutes: 6,331
15 to 19 minutes: 6,463
20 to 24 minutes: 6,658
25 to 29 minutes: 6,620
30 to 34 minutes: 7,721
35 to 39 minutes: 1,718
40 to 44 minutes: 2,475
45 to 59 minutes: 5,445
60 to 89 minutes: 3,132
90 or more minutes: 803
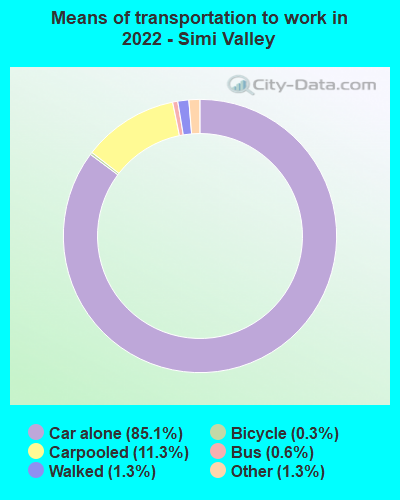
Means of transportation to work:
Drove a car alone: 29,521 (63.6%)
Carpooled: 4,642 (10.0%)
Bus: 226 (0.5%)
Subway or elevated rail: 14 (0.0%)
Long-distance train or commuter rail: 6 (0.0%)
Taxi: 552 (1.2%)
Bicycle: 109 (0.2%)
Walked: 509 (1.1%)
Worked at home: 11,683 (25.2%)
Unemployment by race in 2022
Unemployment rate for White non-Hispanic residents
1.6%Males
6.4%Females
Unemployment rate for Black residents
1.8%Males
6.5%Females
Unemployment rate for American Indian and Alaska Native residents
4.9%Females
Unemployment rate for Asian residents
8.1%Males
7.3%Females
Unemployment rate for other race residents
4.7%Males
2.9%Females
Unemployment rate for two or more race residents
2.7%Males
1.1%Females
Unemployment rate for Hispanic or Latino residents
5.1%Males
1.9%Females
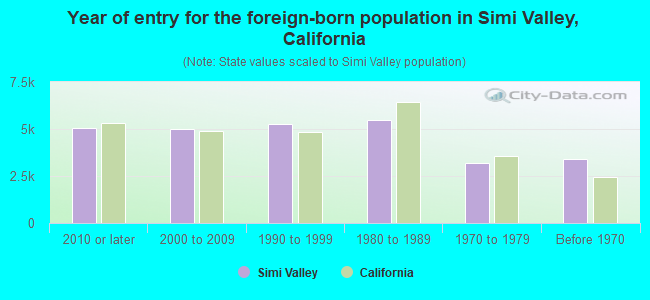
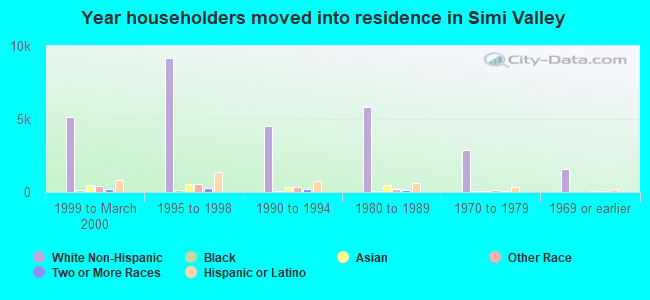
Year of entry for the foreign-born population in Simi Valley, California
5,0642010 or later
5,0122000 to 2009
5,2471990 to 1999
5,4841980 to 1989
3,1911970 to 1979
3,409Before 1970
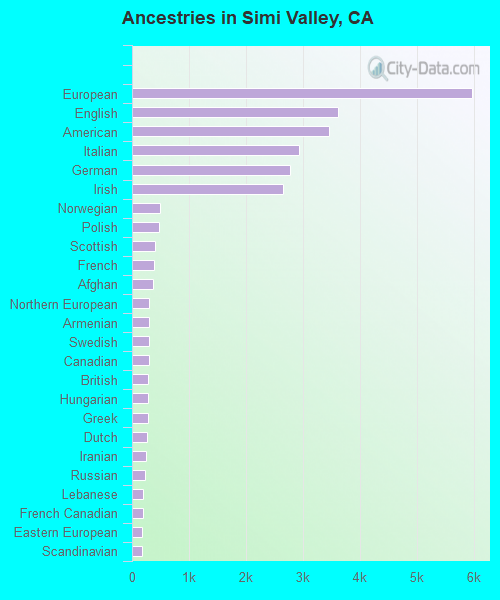
First ancestries reported:
European: 5,970 (9.3%)
English: 3,616 (5.6%)
American: 3,462 (5.4%)
Italian: 2,940 (4.6%)
German: 2,771 (4.3%)
Irish: 2,660 (4.1%)
Norwegian: 489 (0.8%)
Polish: 477 (0.7%)
Scottish: 407 (0.6%)
French: 381 (0.6%)
Afghan: 375 (0.6%)
Northern European: 303 (0.5%)
Armenian: 302 (0.5%)
Swedish: 297 (0.5%)
Canadian: 296 (0.5%)
British: 286 (0.4%)
Hungarian: 278 (0.4%)
Greek: 277 (0.4%)
Dutch: 262 (0.4%)
Iranian: 250 (0.4%)
Russian: 226 (0.4%)
Lebanese: 185 (0.3%)
French Canadian: 185 (0.3%)
Eastern European: 181 (0.3%)
Scandinavian: 169 (0.3%)
Palestinian: 163 (0.3%)
Turkish: 146 (0.2%)
Danish: 145 (0.2%)
Scotch-Irish: 127 (0.2%)
Portuguese: 102 (0.2%)
Ukrainian: 100 (0.2%)
Welsh: 82 (0.1%)
Romanian: 77 (0.1%)
Austrian: 76 (0.1%)
Czech: 74 (0.1%)
German Russian: 66 (0.1%)
Syrian: 66 (0.1%)
Swiss: 64 (0.10%)
Egyptian: 58 (0.09%)
Albanian: 56 (0.09%)
African: 51 (0.08%)
Trinidadian and Tobagonian: 50 (0.08%)
Jordanian: 49 (0.08%)
Serbian: 44 (0.07%)
Nigerian: 44 (0.07%)
Lithuanian: 33 (0.05%)
Moroccan: 33 (0.05%)
Sudanese: 32 (0.05%)
Jamaican: 30 (0.05%)
Croatian: 27 (0.04%)
Belgian: 27 (0.04%)
Brazilian: 25 (0.04%)
Finnish: 24 (0.04%)
Australian: 21 (0.03%)
Haitian: 18 (0.03%)
Slovak: 14 (0.02%)
Icelander: 13 (0.02%)
Guyanese: 13 (0.02%)
Czechoslovakian: 11 (0.02%)
Celtic: 10 (0.02%)
Latvian: 10 (0.02%)
Slovene: 8 (0.01%)
Yugoslavian: 8 (0.01%)
New Zealander: 5 (0.01%)
Cajun: 5 (0.01%)
Most common places of birth for foreign-born residents (%):
Mexico
Simi Valley:
23.7% (5,396)
California:
37.2% (3,881,193)
India
Simi Valley:
11.3% (2,564)
California:
5.2% (539,184)
Philippines
Simi Valley:
7.9% (1,788)
California:
7.8% (818,297)
El Salvador
Simi Valley:
5.4% (1,236)
California:
4.2% (440,287)
Vietnam
Simi Valley:
4.0% (899)
California:
4.9% (512,335)
China, excluding Hong Kong and Taiwan
Simi Valley:
3.3% (757)
California:
6.6% (684,672)
Guatemala
Simi Valley:
3.2% (738)
California:
2.8% (290,436)
Afghanistan
Simi Valley:
2.7% (607)
California:
0.5% (53,260)
Canada
Simi Valley:
2.4% (535)
California:
1.2% (127,477)
Korea
Simi Valley:
2.3% (527)
California:
3.0% (315,248)
Peru
Simi Valley:
2.3% (522)
California:
0.7% (74,025)
Iran
Simi Valley:
1.9% (441)
California:
2.0% (206,004)
Nicaragua
Simi Valley:
1.9% (432)
California:
0.6% (58,161)
Pakistan
Simi Valley:
1.8% (407)
California:
0.5% (49,399)
Place of birth for U.S.-born residents:
This state: 77,352
Other state: 19,009
Northeast: 5,007
Midwest: 6,764
South: 3,948
West: 3,290
89.3% of Simi Valley residents lived in the same house 1 years ago. Out of people who lived in different houses, 36.1% lived in this county. Out of people who lived in different counties, 86.0% lived in California.
Simi Valley:
89.3%
State average:
88.9%
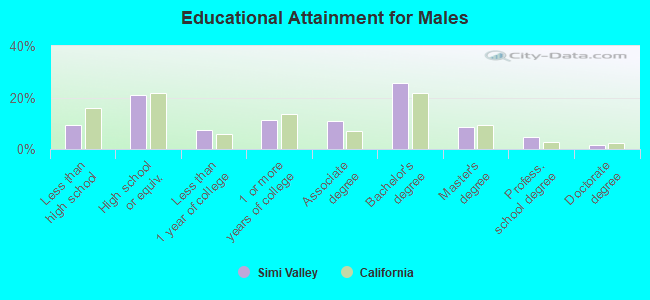
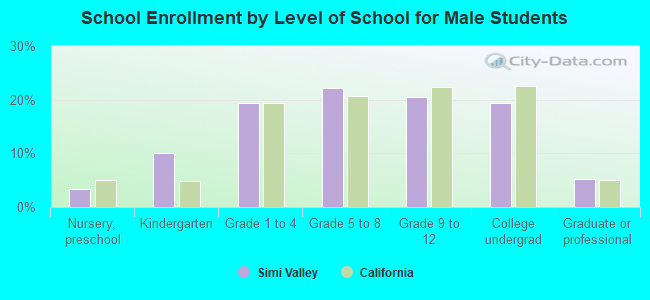
Education attainment for males 25 years and older:
No schooling: 470
Nursery to 4th grade: 825
5th and 6th grade: 531
7th and 8th grade: 0
9th grade: 520
10th grade: 242
11th grade: 480
12th grade, no diploma: 934
High school graduate (or equivalency): 8,972
Less than 1 year of college: 3,107
Some college more than 1 year, no degree: 4,798
Associate degree: 4,610
Bachelor's degree: 11,042
Master's degree: 3,692
Professional school degree: 1,977
Doctorate degree: 658
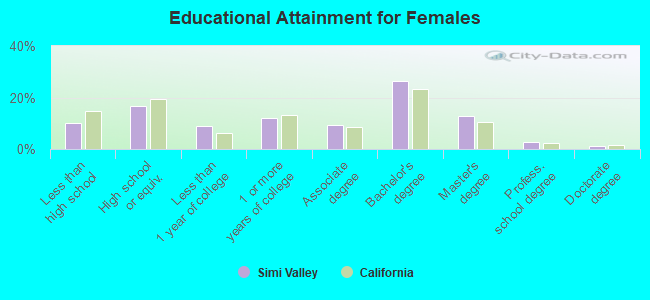
Education attainment for females 25 years and older:
No schooling: 906
Nursery to 4th grade: 485
5th and 6th grade: 264
7th and 8th grade: 350
9th grade: 148
10th grade: 388
11th grade: 531
12th grade, no diploma: 1,222
High school graduate (or equivalency): 7,282
Less than 1 year of college: 3,882
Some college more than 1 year, no degree: 5,273
Associate degree: 3,991
Bachelor's degree: 11,307
Master's degree: 5,569
Professional school degree: 1,095
Doctorate degree: 427
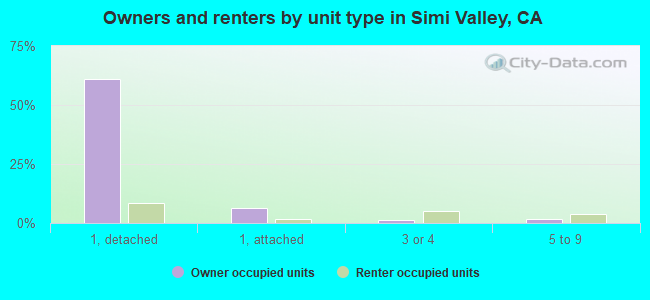
Housing units in structures:
One, detached: 29,450
One, attached: 3,370
Two: 633
3 or 4: 2,615
5 to 9: 2,307
10 to 19: 711
20 to 49: 883
50 or more: 1,807
Mobile homes: 425
Boats, RVs, vans, etc.: 51
Median worth of mobile homes: $136,500
Housing units lacking complete plumbing facilities in 2022: 0.2%
Housing units lacking complete kitchen facilities in 2022: 0.8%
House/condo owner moved in on average 14 years ago