Sierra Vista Southeast, AZ (Arizona) Houses and Residents
| Sierra Vista Southeast: | $275,025 |
| Arizona: | $402,800 |
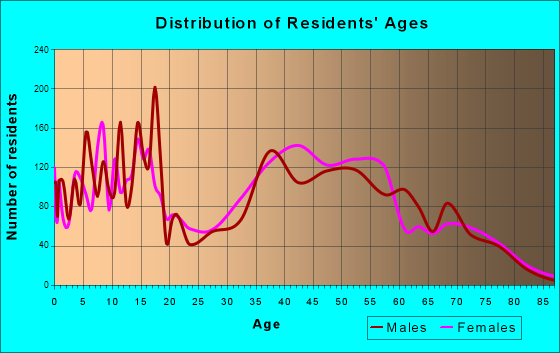
Total population: 14,797 (Urban population: 7,368 (all inside urban clusters), Rural population: 7,443 (38 farm, 7,405 nonfarm))
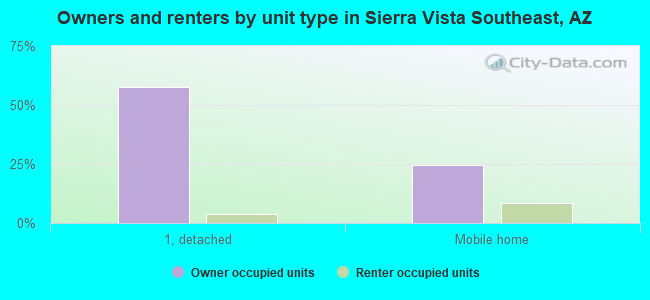
Houses: 6,545 (6,123 occupied: 5,051 owner occupied, 1,035 renter occupied)
| % of renters here: | 17% |
| State: | 33% |
Housing density: 58 houses/condos per square mile
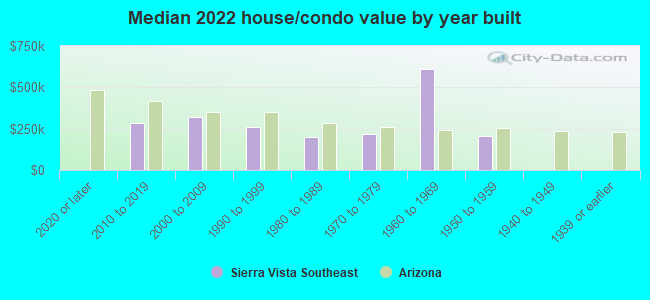
Median price asked for vacant for-sale houses and condos in 2022: $563,610.
Median contract rent in 2022: $730 (lower quartile is $493, upper quartile is $892)
Median rent asked for vacant for-rent units in 2022: $871
Median gross rent in Sierra Vista Southeast, AZ in 2022: $904
Housing units in Sierra Vista Southeast with a mortgage: 2,510 (120 second mortgage, 0 home equity loan, 74 both second mortgage and home equity loan)
Houses without a mortgage: 22
Median household income for houses/condos with a mortgage: $90,852
Median household income for apartments without a mortgage: $56,131
Median monthly housing costs: $826
Compare current foreclosures near Sierra Vista Southeast, AZ:
| Photo | Address | Area | Beds / Baths | Price | Details |
|---|---|---|---|---|---|

|
#1
Monte Vista Ave
Sierra Vista, AZ 85635
|
1,633 sq. feet
|
2 baths 3 beds |
show details | |

|
#2
Patton
Huachuca City, AZ 85616
|
3,295 sq. feet
|
2 baths 4 beds |
show details | |

|
#3
W Brown Dr
Sierra Vista, AZ 85635
|
880 sq. feet
|
1 baths 3 beds |
show details | |

|
#4
N 3rd St
Sierra Vista, AZ 85635
|
1,056 sq. feet
|
2 baths 3 beds |
show details | |

|
#5
Graham Dr
Sierra Vista, AZ 85635
|
1,096 sq. feet
|
2 baths 2 beds |
show details | |

|
#6
E Chippewa St
Hereford, AZ 85615
|
1,490 sq. feet
|
3 baths 3 beds |
show details | |

|
#7
Evergreen Dr
Sierra Vista, AZ 85635
|
1,533 sq. feet
|
2 baths 4 beds |
show details | |

|
#8
Santa Catalina Dr
Sierra Vista, AZ 85635
|
1,288 sq. feet
|
2 baths 3 beds |
show details | |

|
#9
E Calle Cupula
Hereford, AZ 85615
|
2,488 sq. feet
|
2 baths 4 beds |
show details | |

|
#10
Evergreen Dr
Sierra Vista, AZ 85635
|
1,041 sq. feet
|
2 baths 3 beds |
show details |
| Photo | Address | Area | Beds / Baths | Price | Details |
|---|---|---|---|---|---|

|
#11
Steppe Pl
Sierra Vista, AZ 85635
|
1,475 sq. feet
|
- baths - beds |
show details | |

|
#12
Steffen St
Sierra Vista, AZ 85635
|
1,045 sq. feet
|
- baths - beds |
show details | |

|
#13
Ridgeview Pl
Huachuca City, AZ 85616
|
1,724 sq. feet
|
- baths - beds |
show details | |

|
#14
S Santa Aurelia Ave
Sierra Vista, AZ 85650
|
2,275 sq. feet
|
- baths - beds |
show details | |

|
#15
Colombo Ave Apt 15201
Sierra Vista, AZ 85635
|
- sq. feet
|
- baths - beds |
show details | |

|
#16
Evergreen Dr
Sierra Vista, AZ 85635
|
1,533 sq. feet
|
- baths - beds |
show details | |

|
#17
E Karen Dr
Sierra Vista, AZ 85635
|
- sq. feet
|
- baths - beds |
show details | |

|
#18
Terra Dr
Sierra Vista, AZ 85635
|
1,696 sq. feet
|
- baths - beds |
show details | |

|
#19
Cascadia Dr
Sierra Vista, AZ 85635
|
- sq. feet
|
- baths - beds |
show details | |

|
#20
S Carmichael Ave Apt C203
Sierra Vista, AZ 85635
|
- sq. feet
|
- baths - beds |
show details |
| Photo | Address | Area | Beds / Baths | Price | Details |
|---|---|---|---|---|---|

|
#21
N Calle Quinto
Huachuca City, AZ 85616
|
- sq. feet
|
- baths - beds |
show details | |

|
#22
Railroad Ave
Sierra Vista, AZ 85635
|
- sq. feet
|
- baths - beds |
show details | |

|
#23
Carl Hayden Dr
Sierra Vista, AZ 85635
|
2,444 sq. feet
|
- baths - beds |
show details | |

|
#24
Charles Young Way
Sierra Vista, AZ 85635
|
1,805 sq. feet
|
- baths - beds |
show details | |

|
#25
S Carmichael Ave # 403c
Sierra Vista, AZ 85635
|
- sq. feet
|
- baths - beds |
show details | |

|
#26
Santa Rosa Dr
Sierra Vista, AZ 85635
|
1,965 sq. feet
|
- baths - beds |
show details | |

|
#27
N Garden Ave Apt 44
Sierra Vista, AZ 85635
|
- sq. feet
|
- baths - beds |
show details | |

|
#28
Wolfe St
Sierra Vista, AZ 85635
|
850 sq. feet
|
- baths - beds |
show details | |

|
#29
E Spring Rd
Hereford, AZ 85615
|
- sq. feet
|
- baths - beds |
show details | |

|
#30
Fort Ave, Trlr 63
Sierra Vista, AZ 85635
|
- sq. feet
|
- baths - beds |
show details |
| Photo | Address | Area | Beds / Baths | Price | Details |
|---|---|---|---|---|---|

|
#31
S Honeysuckle Dr
Hereford, AZ 85615
|
- sq. feet
|
- baths - beds |
show details | |

|
#32
Merila Loop # B
Fort Huachuca, AZ 85613
|
- sq. feet
|
- baths - beds |
show details | |

|
#33
Leonard Wood Rd
Fort Huachuca, AZ 85613
|
- sq. feet
|
- baths - beds |
show details | |

|
#34
E Vista De San Jose
Hereford, AZ 85615
|
- sq. feet
|
- baths - beds |
show details | |

|
#35
N Skyline Dr
Huachuca City, AZ 85616
|
1,260 sq. feet
|
- baths - beds |
show details | |

|
#36
Suffolk Dr
Sierra Vista, AZ 85635
|
- sq. feet
|
- baths - beds |
show details | |

|
#37
N Martha Ln
Sierra Vista, AZ 85635
|
1,067 sq. feet
|
- baths - beds |
show details | |

|
#38
Loma Loop
Sierra Vista, AZ 85635
|
1,371 sq. feet
|
- baths - beds |
show details | |

|
#39
Bluebell Dr
Sierra Vista, AZ 85635
|
1,713 sq. feet
|
- baths - beds |
show details | |

|
#40
Thunderbird Dr
Sierra Vista, AZ 85650
|
2,242 sq. feet
|
- baths - beds |
show details |
| Photo | Address | Area | Beds / Baths | Price | Details |
|---|---|---|---|---|---|

|
#41
Northridge St
Sierra Vista, AZ 85650
|
1,720 sq. feet
|
- baths - beds |
show details | |

|
#42
E Alhambra Dr
Sierra Vista, AZ 85650
|
- sq. feet
|
- baths - beds |
show details | |

|
#43
S Kiefer Trl
Hereford, AZ 85615
|
- sq. feet
|
- baths - beds |
show details | |

|
#44
Corte Encantada Apt A
Sierra Vista, AZ 85635
|
- sq. feet
|
- baths - beds |
show details | |

|
#45
Quail Pl
Sierra Vista, AZ 85635
|
1,602 sq. feet
|
- baths - beds |
show details | |

|
#46
Plaza Miura
Sierra Vista, AZ 85635
|
1,428 sq. feet
|
- baths - beds |
show details | |

|
#47
Encanto Dr
Sierra Vista, AZ 85635
|
- sq. feet
|
- baths - beds |
show details | |

|
#48
E Yokut St
Sierra Vista, AZ 85650
|
2,264 sq. feet
|
- baths - beds |
show details | |

|
#49
San Simeon Dr
Sierra Vista, AZ 85635
|
- sq. feet
|
- baths - beds |
show details | |

|
Check over 1 million property listings on Foreclosure.com!
|
browse all offers | |||


 | Moving from Michigan to Sierra Vista (45 replies) |
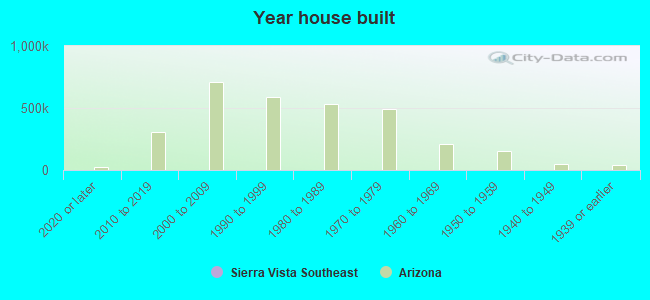
Median year apartment built: 1990
Household type by relationship:
Households: 14,416- Male householders: 3,231 (976 living alone), Female householders: 2,826 (1,186 living alone)
2,914 spouses (2,885 opposite-sex spouses), 253 unmarried partners, (253 opposite-sex unmarried partners), 4,140 children (3,721 natural, 172 adopted, 246 stepchildren), 179 grandchildren, 161 brothers or sisters, 273 parents, 24 foster children, 247 other relatives, 115 non-relatives
- In group quarters: 50
Size of family households: 2,099 2-persons, 646 3-persons, 472 4-persons, 334 5-persons, 124 6-persons, 162 7-or-more-persons.
Size of nonfamily households: 2,015 1-person, 258 2-persons.
2,272 married couples with children.
643 single-parent households (92 men, 551 women).
82.6% of residents of Sierra Vista Southeast speak English at home.
13.7% of residents speak Spanish at home (67% speak English very well, 26% speak English well, 5% speak English not well, 2% don't speak English at all).
1.7% of residents speak other Indo-European language at home (85% speak English very well, 15% speak English well).
1.9% of residents speak Asian or Pacific Island language at home (46% speak English very well, 20% speak English well, 34% speak English not well).
0.1% of residents speak other language at home (100% speak English very well).
Foreign born population: 1,085 (7.5%)
(67.8% of them are naturalized citizens)
| Here: | 6.5 |
| State: | 6.0 |
| Here: | 4.9 |
| State: | 4.1 |
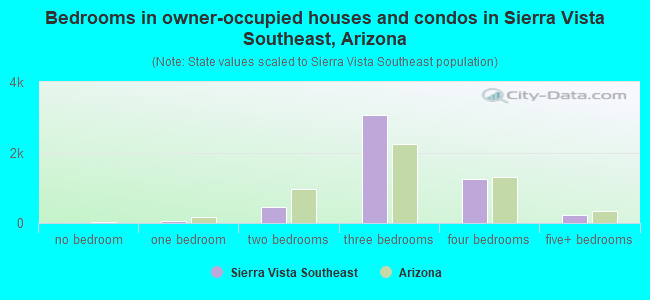
- Bedrooms in owner-occupied houses and condos in Sierra Vista Southeast, Arizona
- 7no bedroom
- 521 bedroom
- 4652 bedrooms
- 3,0783 bedrooms
- 1,2354 bedrooms
- 2145+ bedrooms
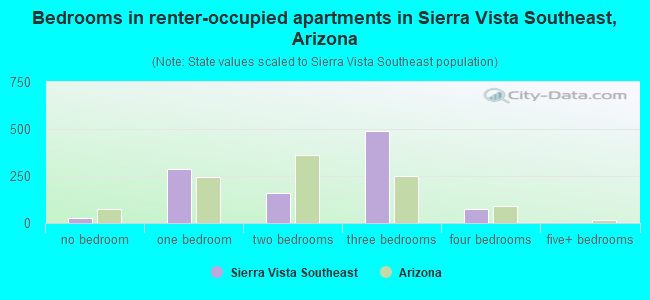
- Bedrooms in renter-occupied apartments in Sierra Vista Southeast, Arizona
- 25no bedroom
- 2861 bedroom
- 1622 bedrooms
- 4883 bedrooms
- 744 bedrooms
- 05+ bedrooms
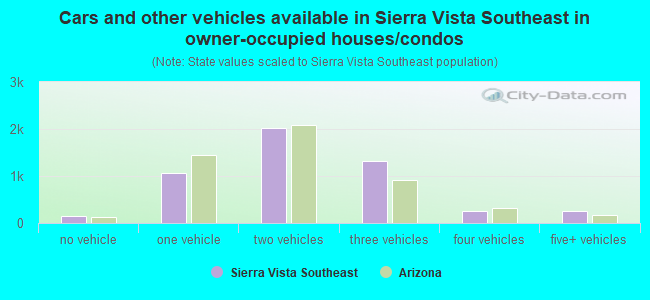
- Cars and other vehicles available in Sierra Vista Southeast in owner-occupied houses/condos
- 144no vehicle
- 1,0641 vehicle
- 2,0142 vehicles
- 1,3103 vehicles
- 2634 vehicles
- 2575+ vehicles
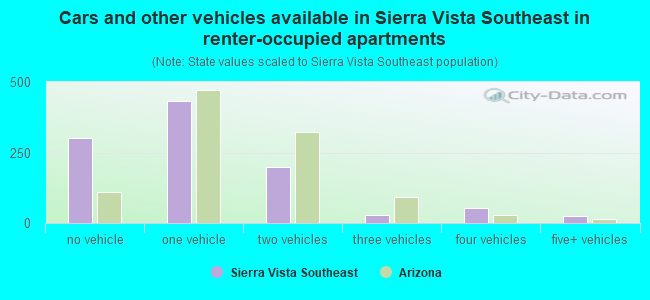
- Cars and other vehicles available in Sierra Vista Southeast in renter-occupied apartments
- 303no vehicle
- 4311 vehicle
- 1972 vehicles
- 273 vehicles
- 524 vehicles
- 255+ vehicles
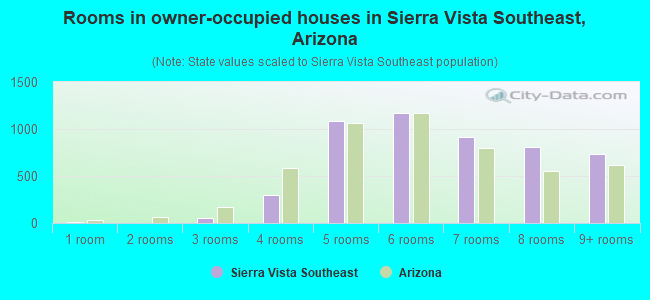
- Rooms in owner-occupied houses in Sierra Vista Southeast, Arizona
- 71 room
- 02 rooms
- 503 rooms
- 2954 rooms
- 1,0825 rooms
- 1,1666 rooms
- 9107 rooms
- 8118 rooms
- 7309+ rooms
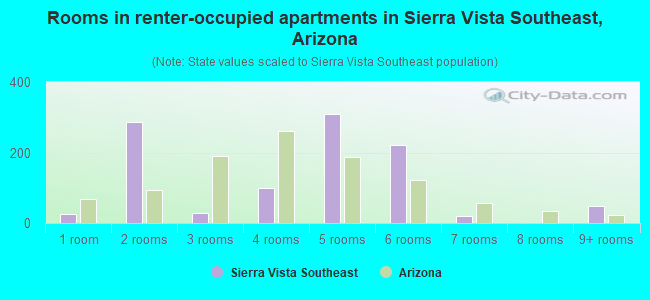
- Rooms in renter-occupied apartments in Sierra Vista Southeast, Arizona
- 251 room
- 2862 rooms
- 273 rooms
- 1004 rooms
- 3085 rooms
- 2226 rooms
- 207 rooms
- 08 rooms
- 479+ rooms
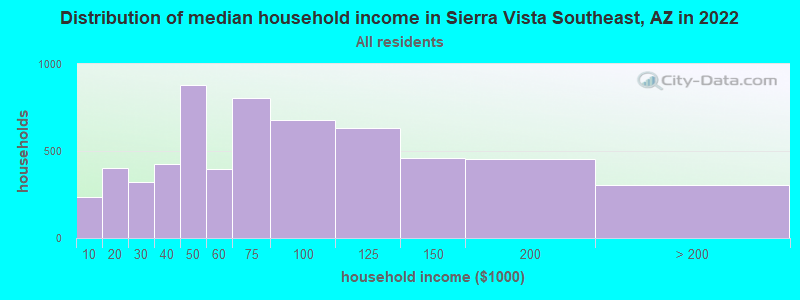
Sierra Vista Southeast, AZ household income distribution

- 234Less than $10,000
- 404$10,000 to $19,999
- 323$20,000 to $29,999
- 427$30,000 to $39,999
- 881$40,000 to $49,999
- 397$50,000 to $59,999
- 807$60,000 to $74,999
- 676$75,000 to $99,999
- 634$100,000 to $124,999
- 459$125,000 to $149,999
- 456$150,000 to $199,999
- 305$200,000 or more
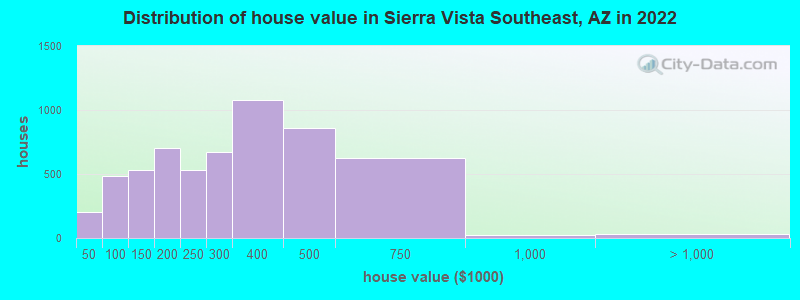
Home value of owner - occupied houses in 2022 in Sierra Vista Southeast, AZ
-
- 54Less than $10,000
- 15$10,000 to $14,999
- 28$20,000 to $24,999
- 21$30,000 to $34,999
- 4$35,000 to $39,999
- 79$40,000 to $49,999
- 35$50,000 to $59,999
- 125$60,000 to $69,999
- 20$70,000 to $79,999
- 148$80,000 to $89,999
- 73$90,000 to $99,999
- 349$100,000 to $124,999
- 180$125,000 to $149,999
- 484$150,000 to $174,999
- 221$175,000 to $199,999
- 534$200,000 to $249,999
- 668$250,000 to $299,999
- 1,074$300,000 to $399,999
- 857$400,000 to $499,999
- 622$500,000 to $749,999
- 26$750,000 to $999,999
- 28$1,000,000 to $1,499,999
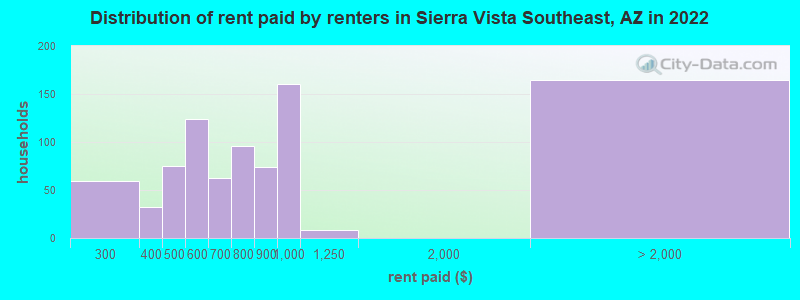
Rent paid by renters in 2022 in Sierra Vista Southeast, AZ
-
- 59$250 to $299
- 32$300 to $349
- 10$400 to $449
- 65$450 to $499
- 76$500 to $549
- 48$550 to $599
- 61$650 to $699
- 69$700 to $749
- 26$750 to $799
- 74$800 to $899
- 160$900 to $999
- 8$1,000 to $1,249
- 164No cash rent
Percentage of workers working in this county: 97.3%
Number of people working at home: 722 (14.4% of all workers)
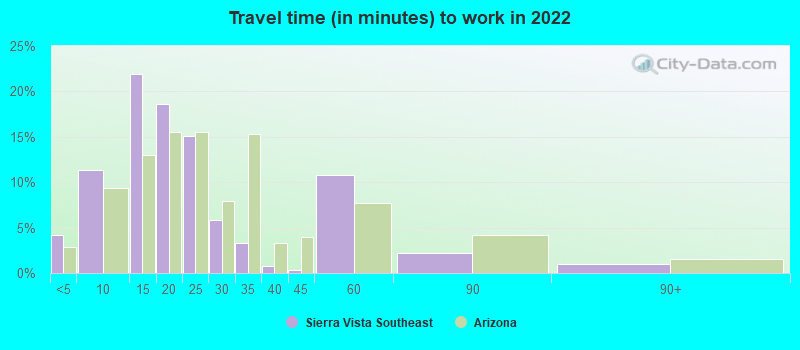
Travel time to work (commute)
- Less than 5 minutes: 225
- 5 to 9 minutes: 333
- 10 to 14 minutes: 356
- 15 to 19 minutes: 1,358
- 20 to 24 minutes: 629
- 25 to 29 minutes: 279
- 30 to 34 minutes: 443
- 35 to 39 minutes: 142
- 40 to 44 minutes: 51
- 45 to 59 minutes: 212
- 60 to 89 minutes: 101
- 90 or more minutes: 106
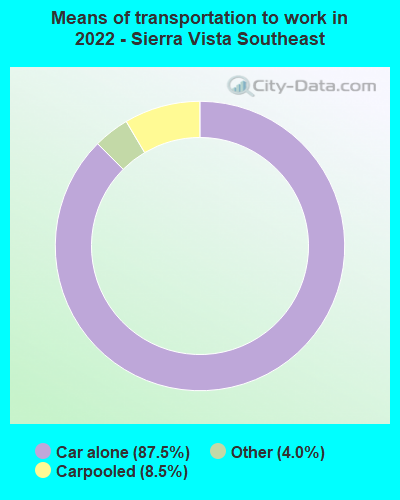
Means of transportation to work:
- Drove a car alone: 727 (52.9%)
- Carpooled: 74 (5.4%)
- Taxi: 38 (2.8%)
- Worked at home: 653 (47.5%)
- Unemployment by race in 2022
- Unemployment rate for White non-Hispanic residents
- 1.5%Males
- 1.6%Females
- Unemployment rate for other race residents
- 36.9%Females
- Unemployment rate for two or more race residents
- 12.6%Males
- Unemployment rate for Hispanic or Latino residents
- 10.2%Males
- 6.3%Females
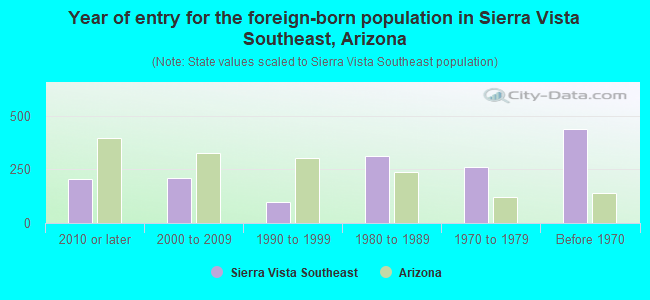
- Year of entry for the foreign-born population in Sierra Vista Southeast, Arizona
- 2072010 or later
- 2112000 to 2009
- 981990 to 1999
- 3111980 to 1989
- 2591970 to 1979
- 438Before 1970
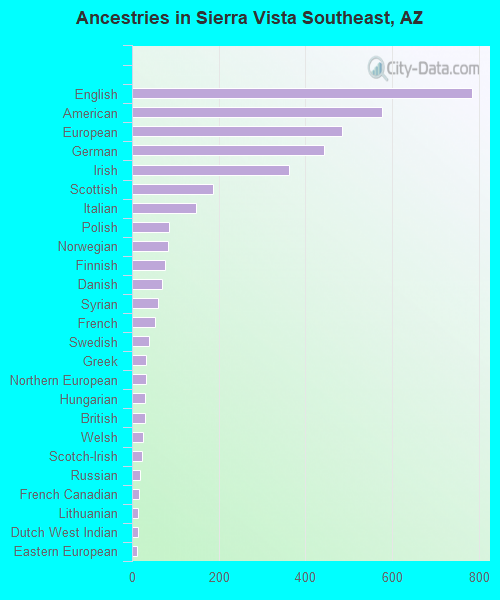
First ancestries reported:
- English: 784 (10.8%)
- American: 577 (8.0%)
- European: 485 (6.7%)
- German: 442 (6.1%)
- Irish: 363 (5.0%)
- Scottish: 187 (2.6%)
- Italian: 147 (2.0%)
- Polish: 85 (1.2%)
- Norwegian: 83 (1.1%)
- Finnish: 76 (1.0%)
- Danish: 70 (1.0%)
- Syrian: 60 (0.8%)
- French: 52 (0.7%)
- Swedish: 40 (0.6%)
- Greek: 33 (0.5%)
- Northern European: 33 (0.5%)
- Hungarian: 31 (0.4%)
- British: 30 (0.4%)
- Welsh: 25 (0.3%)
- Scotch-Irish: 24 (0.3%)
- Russian: 18 (0.2%)
- French Canadian: 17 (0.2%)
- Lithuanian: 14 (0.2%)
- Dutch West Indian: 14 (0.2%)
- Eastern European: 12 (0.2%)
- Haitian: 11 (0.2%)
- Portuguese: 9 (0.1%)
- Dutch: 8 (0.1%)
- Romanian: 1 (0.01%)
Most common places of birth for foreign-born residents (%):
| Sierra Vista Southeast: | 37.8% (407) |
| Arizona: | 53.4% (500,086) |
| Sierra Vista Southeast: | 13.9% (150) |
| Arizona: | 1.5% (14,058) |
| Sierra Vista Southeast: | 7.6% (82) |
| Arizona: | 1.2% (11,275) |
| Sierra Vista Southeast: | 7.4% (80) |
| Arizona: | 3.2% (30,378) |
| Sierra Vista Southeast: | 4.2% (45) |
| Arizona: | 0.7% (6,565) |
| Sierra Vista Southeast: | 3.9% (42) |
| Arizona: | 0.6% (6,077) |
| Sierra Vista Southeast: | 3.7% (40) |
| Arizona: | 1.0% (8,899) |
| Sierra Vista Southeast: | 3.1% (33) |
| Arizona: | 4.3% (40,102) |
| Sierra Vista Southeast: | 3.0% (32) |
| Arizona: | 0.2% (1,678) |
| Sierra Vista Southeast: | 2.9% (31) |
| Arizona: | 0.1% (584) |
| Sierra Vista Southeast: | 2.8% (30) |
| Arizona: | 1.2% (10,932) |
| Sierra Vista Southeast: | 1.6% (17) |
| Arizona: | 0.1% (1,156) |
Place of birth for U.S.-born residents:
- This state: 4,183
- Other state: 8,698
- Northeast: 1,244
- Midwest: 1,830
- South: 1,860
- West: 3,797
97.7% of Sierra Vista Southeast residents lived in the same house 1 years ago.
Out of people who lived in different houses, 40.5% lived in this county.
Out of people who lived in different counties, 49.1% lived in Arizona.
| Sierra Vista Southeast: | 97.7% |
| State average: | 86.0% |
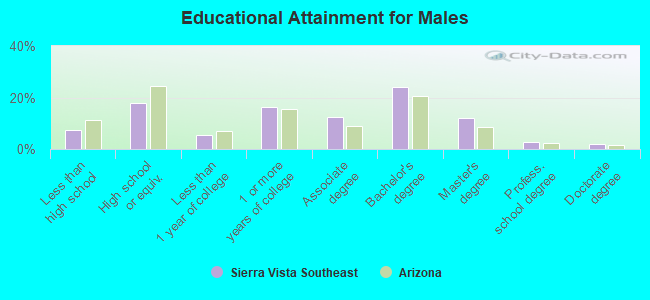
Education attainment for males 25 years and older:
- No schooling: 12
- Nursery to 4th grade: 0
- 5th and 6th grade: 20
- 7th and 8th grade: 21
- 9th grade: 34
- 10th grade: 13
- 11th grade: 88
- 12th grade, no diploma: 165
- High school graduate (or equivalency): 839
- Less than 1 year of college: 258
- Some college more than 1 year, no degree: 770
- Associate degree: 597
- Bachelor's degree: 1,133
- Master's degree: 565
- Professional school degree: 136
- Doctorate degree: 89
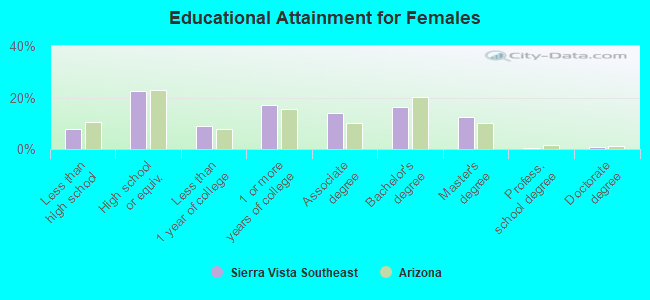
Education attainment for females 25 years and older:
- No schooling: 38
- Nursery to 4th grade: 0
- 5th and 6th grade: 0
- 7th and 8th grade: 32
- 9th grade: 0
- 10th grade: 180
- 11th grade: 9
- 12th grade, no diploma: 150
- High school graduate (or equivalency): 1,211
- Less than 1 year of college: 478
- Some college more than 1 year, no degree: 920
- Associate degree: 740
- Bachelor's degree: 882
- Master's degree: 656
- Professional school degree: 14
- Doctorate degree: 44
Housing units in structures:
- One, detached: 3,835
- One, attached: 90
- 3 or 4: 18
- Mobile homes: 2,601
Median worth of mobile homes: $101,970
Housing units lacking complete kitchen facilities in 2022: 1.3%
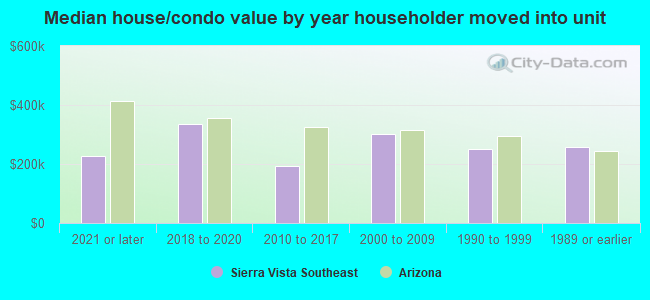
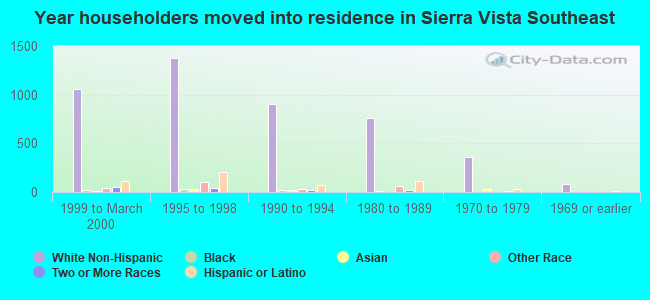
House/condo owner moved in on average 11 years ago
Renter moved in on average 7 years ago
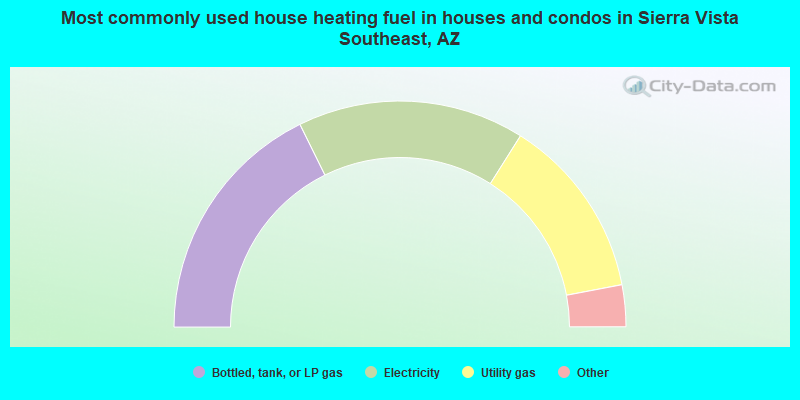
- 35.4%Bottled, tank, or LP gas
- 32.5%Electricity
- 26.1%Utility gas
- 2.5%Wood
- 2.4%Solar energy
- 1.1%Other fuel
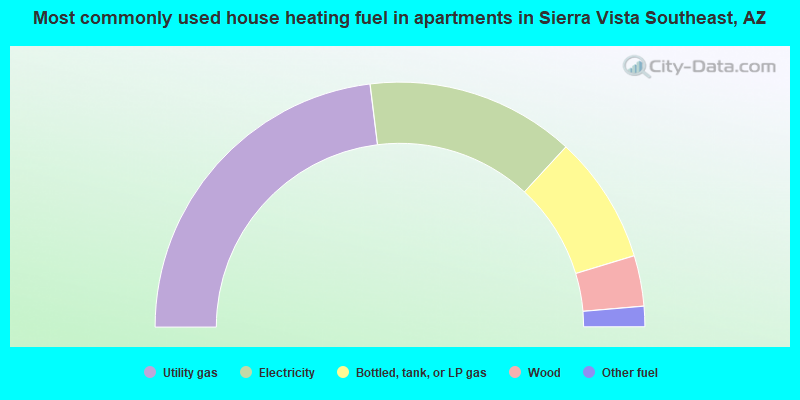
- 46.1%Utility gas
- 27.6%Electricity
- 16.9%Bottled, tank, or LP gas
- 6.7%Wood
- 2.7%Other fuel
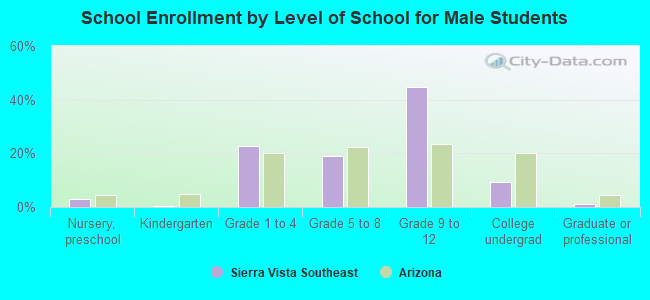
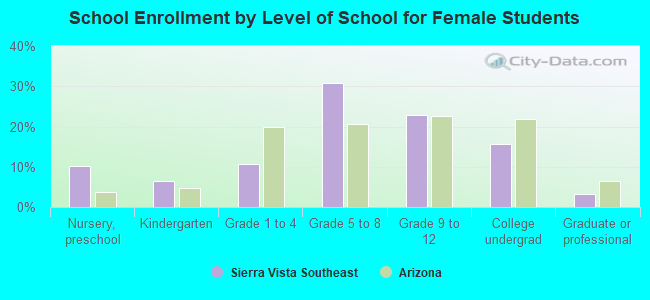
Private vs. public school enrollment:
| Here: | 15.6% |
| Arizona: | 10.4% |
| Here: | 5.9% |
| Arizona: | 8.8% |
| Here: | 12.0% |
| Arizona: | 13.1% |