Shreveport, LA (Louisiana) Houses and Residents
Estimated median house or condo value in 2022: $167,600 (it was $70,700 in 2000 )
Shreveport:
$167,600Louisiana:
$209,200
Lower value quartile - upper value quartile: $95,600 - $273,800Mean price in 2022: Detached houses: $273,659 Here:
$273,659State:
$273,555
Townhouses or other attached units: $239,978 Here:
$239,978State:
$297,713
In 2-unit structures: $142,966 Here:
$142,966State:
$325,117
In 3-to-4-unit structures: $268,104 Here:
$268,104State:
$213,088
In 5-or-more-unit structures: $310,851 Here:
$310,851State:
$257,054
Mobile homes: $71,334 Here:
$71,334State:
$89,857
Occupied boats, RVs, vans, etc.: $13,166 Here:
$13,166State:
$73,931
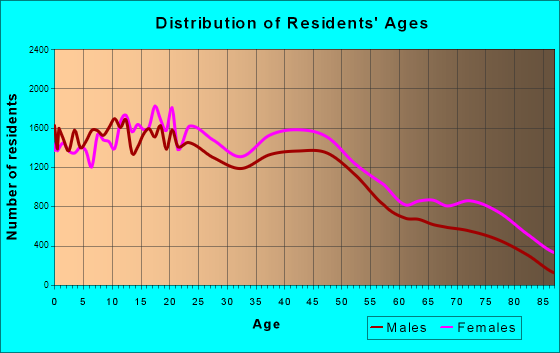
Total population: 198,242 (All urban)
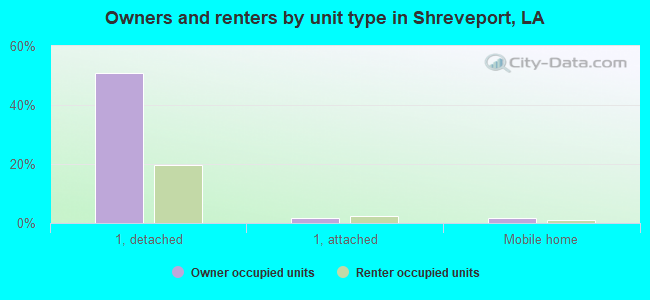
Houses: 92,362 (77,552 occupied: 40,670 owner occupied, 36,882 renter occupied )
% of renters here:
48%State:
32%
Housing density: 895 houses/condos per square mile
Median price asked for vacant for-sale houses and condos in 2022: $292,799.
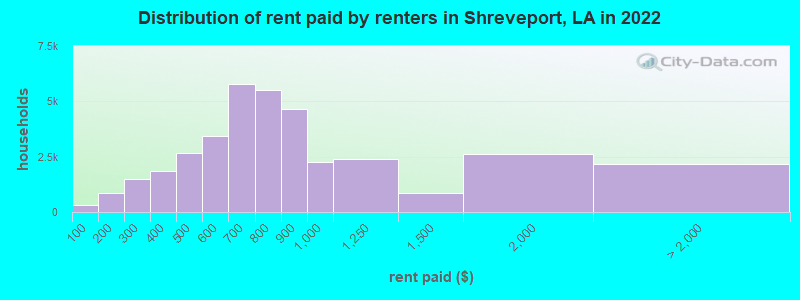
Median contract rent in 2022: $717 (lower quartile is $539, upper quartile is $899)
Median rent asked for vacant for-rent units in 2022: $746
Median gross rent in Shreveport, LA in 2022: $951
Housing units in Shreveport with a mortgage: 23,440 (3,090 second mortgage, 116 home equity loan, 1,614 both second mortgage and home equity loan )Houses without a mortgage: 526
Median household income for houses/condos with a mortgage: $82,094
Median household income for apartments without a mortgage: $43,898
Median monthly housing costs: $946
Data:
Median house or condo value ($)
Median house or condo value ($ change since 2000)
Median house or condo value ($) - White
Median house or condo value ($) - Black or African American
Median house or condo value ($) - Asian
Median house or condo value ($) - Hispanic or Latino
Median house or condo value ($) - American Indian and Alaska Native
Median house or condo value ($) - Multirace
Median house or condo value ($) - Other Race
Median price asked for mobile homes ($)
Household density (households per square mile)
Mean house or condo value by units in structure - 1, detached ($)
Mean house or condo value by units in structure - 1, attached ($)
Mean house or condo value by units in structure - 2 ($)
Mean house or condo value by units in structure by units in structure - 3 or 4 ($)
Mean house or condo value by units in structure - 5 or more ($)
Mean house or condo value by units in structure - Boat, RV, van, etc. ($)
Mean house or condo value by units in structure - Mobile home ($)
Median contract rent ($)
Median contract rent - Lower quartile ($)
Median contract rent - Upper quartile ($)
Median gross rent ($)
Urban houses (%)
Rural houses (%)
Houses occupied (%)
Houses occupied (% change since 2000)
Houses owner occupied (%)
Houses owner occupied (% change since 2000)
Houses renter occupied (%)
Houses renter occupied (% change since 2000)
Vacant housing units - For rent (%)
Vacant housing units - For rent (% change since 2000)
Vacant housing units - For sale only (%)
Vacant housing units - For sale only (% change since 2000)
Vacant housing units - Rented or sold, not occupied (%)
Vacant housing units - Rented or sold, not occupied (% change since 2000)
Vacant housing units - For seasonal, recreational, or occasional use (%)
Vacant housing units - For seasonal, recreational, or occasional use (% change since 2000)
Vacant housing units - For migrant workers (%)
Vacant housing units - For migrant workers (% change since 2000)
Vacant housing units - Other vacant (%)
Vacant housing units - Other vacant (% change since 2000)
Median monthly housing costs ($)
Median household income for houses/condos with a mortgage ($)
Median household income for houses/condos without a mortgage ($)
Median household income ($)
Median household income ($) - White
Median household income ($) - Black or African American
Median household income ($) - Asian
Median household income ($) - Hispanic or Latino
Median household income ($) - American Indian and Alaska Native
Median household income ($) - Multirace
Median household income ($) - Other Race
Mortgage status - with mortgage (%)
Mortgage status - with second mortgage (%)
Mortgage status - with home equity loan (%)
Mortgage status - with both second mortgage and home equity loan (%)
Mortgage status - without a mortgage (%)
Median year house/condo built
Median year apartment built
Household type by relationship - Male householder living alone (%)
Household type by relationship - Male householder not living alone (%)
Household type by relationship - Female householder living alone (%)
Household type by relationship - Female householder not living alone (%)
Household type by relationship - Opposite-Sex spouse (%)
Household type by relationship - Same-Sex spouse (%)
Household type by relationship - Opposite-Sex unmarried partner (%)
Household type by relationship - Same-Sex unmarried partner (%)
Household type by relationship - In group quarters (%)
Size of family households - 2-person household (%)
Size of family households - 3-person household (%)
Size of family households - 4-person household (%)
Size of family households - 5-person household (%)
Size of family households - 6-person household (%)
Size of family households - 7-or-more-person household (%)
Size of nonfamily households - 1-person household (%)
Size of nonfamily households - 2-person household (%)
Size of nonfamily households - 3-person household (%)
Size of nonfamily households - 4-person household (%)
Size of nonfamily households - 5-person household (%)
Size of nonfamily households - 6-person household (%)
Size of nonfamily households - 7-or-moreperson household (%)
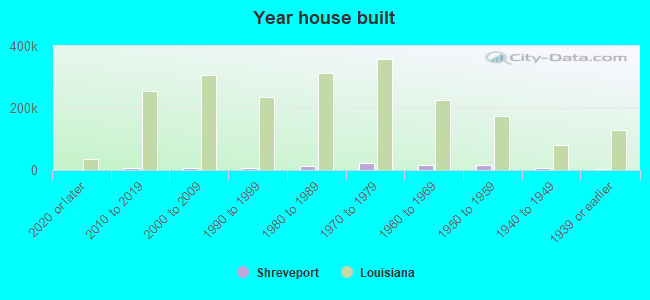
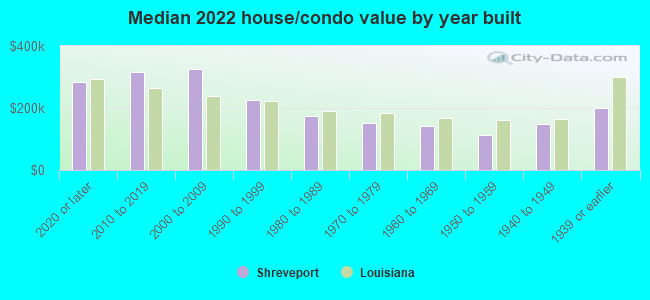
Year house built - Built 2010 or later (%)
Year house built - Built 2000 to 2009 (%)
Year house built - Built 1990 to 1999 (%)
Year house built - Built 1980 to 1989 (%)
Year house built - Built 1970 to 1979 (%)
Year house built - Built 1960 to 1969 (%)
Year house built - Built 1950 to 1959 (%)
Year house built - Built 1940 to 1949 (%)
Year house built - Built 1939 or earlier (%)
Median number of rooms in houses and condos
Median number of rooms in apartments
Median number of bedrooms in owner occupied houses
Mean number of bedrooms in owner occupied houses
Median number of bedrooms in renter occupied houses
Mean number of bedrooms in renter occupied houses
Median number of vehichles in owner occupied houses
Mean number of vehichles in owner occupied houses
Median number of vehichles in renter occupied houses
Mean number of vehichles in renter occupied houses
Rooms in owner-occupied houses - 1 room (%)
Rooms in owner-occupied houses - 2 rooms (%)
Rooms in owner-occupied houses - 3 rooms (%)
Rooms in owner-occupied houses - 4 rooms (%)
Rooms in owner-occupied houses - 5 rooms (%)
Rooms in owner-occupied houses - 6 rooms (%)
Rooms in owner-occupied houses - 7 rooms (%)
Rooms in owner-occupied houses - 8 rooms (%)
Rooms in owner-occupied houses - 9+ rooms (%)
Rooms in renter-occupied houses - 1 room (%)
Rooms in renter-occupied houses - 2 rooms (%)
Rooms in renter-occupied houses - 3 rooms (%)
Rooms in renter-occupied houses - 4 rooms (%)
Rooms in renter-occupied houses - 5 rooms (%)
Rooms in renter-occupied houses - 6 rooms (%)
Rooms in renter-occupied houses - 7 rooms (%)
Rooms in renter-occupied houses - 8 rooms (%)
Rooms in renter-occupied houses - 9+ rooms (%)
Bedrooms in owner-occupied houses - no bedrooms (%)
Bedrooms in owner-occupied houses - 1 bedroom (%)
Bedrooms in owner-occupied houses - 2 bedrooms (%)
Bedrooms in owner-occupied houses - 3 bedrooms (%)
Bedrooms in owner-occupied houses - 4 bedrooms (%)
Bedrooms in owner-occupied houses - 5+ bedrooms (%)
Bedrooms in renter-occupied houses - no bedrooms (%)
Bedrooms in renter-occupied houses - 1 bedroom (%)
Bedrooms in renter-occupied houses - 2 bedrooms (%)
Bedrooms in renter-occupied houses - 3 bedrooms (%)
Bedrooms in renter-occupied houses - 4 bedrooms (%)
Bedrooms in renter-occupied houses - 5+ bedrooms (%)
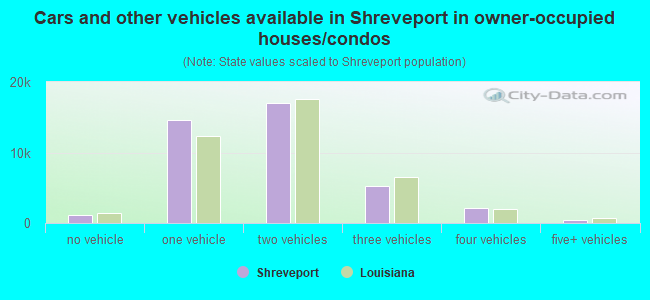
Vehicles available in owner-occupied houses - no vehicle available (%)
Vehicles available in owner-occupied houses - 1 vehicle available(%)
Vehicles available in owner-occupied houses - 2 Vehicles available (%)
Vehicles available in owner-occupied houses - 3 Vehicles available (%)
Vehicles available in owner-occupied houses - 4 Vehicles available (%)
Vehicles available in owner-occupied houses - 5+ Vehicles available (%)
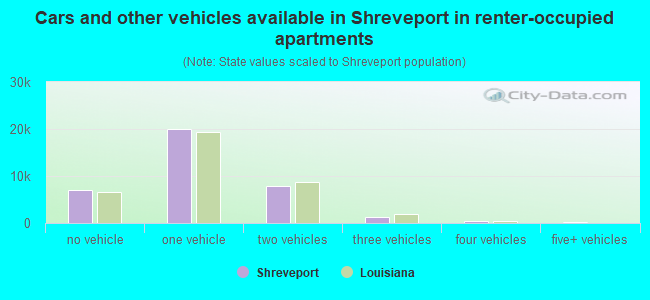
Vehicles available in renter-occupied houses - no vehicle available (%)
Vehicles available in renter-occupied houses - 1 vehicle available (%)
Vehicles available in renter-occupied houses - 2 Vehicles available (%)
Vehicles available in renter-occupied houses - 3 Vehicles available (%)
Vehicles available in renter-occupied houses - 4 Vehicles available (%)
Vehicles available in renter-occupied houses - 5+ Vehicles available (%)
Housing units in structures - 1, detached (%)
Housing units in structures - 1, attached (%)
Housing units in structures - 2 (%)
Housing units in structures - 3 or 4 (%)
Housing units in structures - 5 to 9 (%)
Housing units in structures - 10 to 19 (%)
Housing units in structures - 20 to 49 (%)
Housing units in structures - 50 or more (%)
Housing units in structures - Mobile home (%)
Housing units in structures - Boat, RV, van, etc. (%)
Housing units in structures - Owners - 1, detached (%)
Housing units in structures - Owners - 1, attached (%)
Housing units in structures - Owners - 2 (%)
Housing units in structures - Owners - 3 or 4 (%)
Housing units in structures - Owners - 5 to 9 (%)
Housing units in structures - Owners - 10 to 19 (%)
Housing units in structures - Owners - 20 to 49 (%)
Housing units in structures - Owners - 50 or more (%)
Housing units in structures - Owners - Mobile home (%)
Housing units in structures - Owners - Boat, RV, van, etc. (%)
Housing units in structures - Renters - 1, detached (%)
Housing units in structures - Renters - 1, attached (%)
Housing units in structures - Renters - 2 (%)
Housing units in structures - Renters - 3 or 4 (%)
Housing units in structures - Renters - 5 to 9 (%)
Housing units in structures - Renters - 10 to 19 (%)
Housing units in structures - Renters - 20 to 49 (%)
Housing units in structures - Renters - 50 or more (%)
Housing units in structures - Renters - Mobile home (%)
Housing units in structures - Renters - Boat, RV, van, etc. (%)
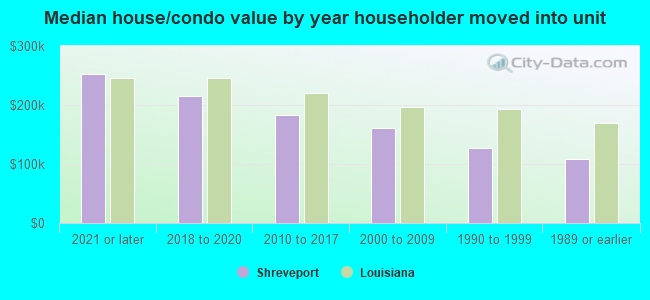
House/condo owner moved in on average (years ago)
Renter moved in on average (years ago)
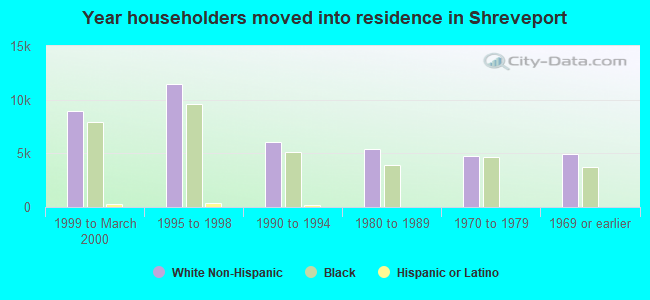
Year householder moved into unit - Moved in 1999 to March 2000 (%)
Year householder moved into unit - Moved in 1999 to March 2000 (%) - White
Year householder moved into unit - Moved in 1999 to March 2000 (%) - Black or African American
Year householder moved into unit - Moved in 1999 to March 2000 (%) - Asian
Year householder moved into unit - Moved in 1999 to March 2000 (%) - Hispanic or Latino
Year householder moved into unit - Moved in 1999 to March 2000 (%) - American Indian and Alaska Native
Year householder moved into unit - Moved in 1999 to March 2000 (%) - Multirace
Year householder moved into unit - Moved in 1999 to March 2000 (%) - Other Race
Year householder moved into unit - Moved in 1995 to 1998 (%)
Year householder moved into unit - Moved in 1995 to 1998 (%) - White
Year householder moved into unit - Moved in 1995 to 1998 (%) - Black or African American
Year householder moved into unit - Moved in 1995 to 1998 (%) - Asian
Year householder moved into unit - Moved in 1995 to 1998 (%) - Hispanic or Latino
Year householder moved into unit - Moved in 1995 to 1998 (%) - American Indian and Alaska Native
Year householder moved into unit - Moved in 1995 to 1998 (%) - Multirace
Year householder moved into unit - Moved in 1995 to 1998 (%) - Other Race
Year householder moved into unit - Moved in 1990 to 1994 (%)
Year householder moved into unit - Moved in 1990 to 1994 (%) - White
Year householder moved into unit - Moved in 1990 to 1994 (%) - Black or African American
Year householder moved into unit - Moved in 1990 to 1994 (%) - Asian
Year householder moved into unit - Moved in 1990 to 1994 (%) - Hispanic or Latino
Year householder moved into unit - Moved in 1990 to 1994 (%) - American Indian and Alaska Native
Year householder moved into unit - Moved in 1990 to 1994 (%) - Multirace
Year householder moved into unit - Moved in 1990 to 1994 (%) - Other Race
Year householder moved into unit - Moved in 1980 to 1989 (%)
Year householder moved into unit - Moved in 1980 to 1989 (%) - White
Year householder moved into unit - Moved in 1980 to 1989 (%) - Black or African American
Year householder moved into unit - Moved in 1980 to 1989 (%) - Asian
Year householder moved into unit - Moved in 1980 to 1989 (%) - Hispanic or Latino
Year householder moved into unit - Moved in 1980 to 1989 (%) - American Indian and Alaska Native
Year householder moved into unit - Moved in 1980 to 1989 (%) - Multirace
Year householder moved into unit - Moved in 1980 to 1989 (%) - Other Race
Year householder moved into unit - Moved in 1970 to 1979 (%)
Year householder moved into unit - Moved in 1970 to 1979 (%) - White
Year householder moved into unit - Moved in 1970 to 1979 (%) - Black or African American
Year householder moved into unit - Moved in 1970 to 1979 (%) - Asian
Year householder moved into unit - Moved in 1970 to 1979 (%) - Hispanic or Latino
Year householder moved into unit - Moved in 1970 to 1979 (%) - American Indian and Alaska Native
Year householder moved into unit - Moved in 1970 to 1979 (%) - Multirace
Year householder moved into unit - Moved in 1970 to 1979 (%) - Other Race
Year householder moved into unit - Moved in 1969 or earlier (%)
Year householder moved into unit - Moved in 1969 or earlier (%) - White
Year householder moved into unit - Moved in 1969 or earlier (%) - Black or African American
Year householder moved into unit - Moved in 1969 or earlier (%) - Asian
Year householder moved into unit - Moved in 1969 or earlier (%) - Hispanic or Latino
Year householder moved into unit - Moved in 1969 or earlier (%) - American Indian and Alaska Native
Year householder moved into unit - Moved in 1969 or earlier (%) - Multirace
Year householder moved into unit - Moved in 1969 or earlier (%) - Other Race
Housing units lacking complete plumbing facilities (%)
Housing units lacking complete kitchen facilities (%)
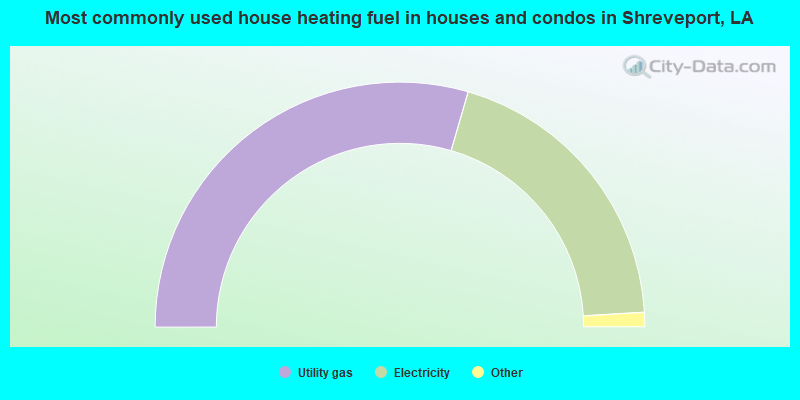
House heating fuel used in houses and condos - Utility gas (%)
House heating fuel used in houses and condos - Bottled, tank, or LP gas (%)
House heating fuel used in houses and condos - Electricity (%)
House heating fuel used in houses and condos - Fuel oil, kerosene, etc. (%)
House heating fuel used in houses and condos - Coal or coke (%)
House heating fuel used in houses and condos - Wood (%)
House heating fuel used in houses and condos - Solar energy (%)
House heating fuel used in houses and condos - Other fuel (%)
House heating fuel used in houses and condos - No fuel used (%)
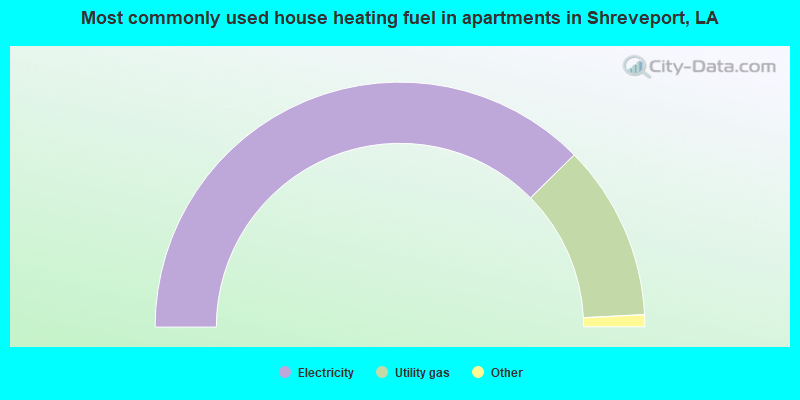
House heating fuel used in apartments - Utility gas (%)
House heating fuel used in apartments - Bottled, tank, or LP gas (%)
House heating fuel used in apartments - Electricity (%)
House heating fuel used in apartments - Fuel oil, kerosene, etc. (%)
House heating fuel used in apartments - Coal or coke (%)
House heating fuel used in apartments - Wood (%)
House heating fuel used in apartments - Solar energy (%)
House heating fuel used in apartments - Other fuel (%)
House heating fuel used in apartments - No fuel used (%)
Latest news about housing in Shreveport, LA collected exclusively by city-data.com from local newspapers, TV, and radio stations
Median year house/condo built: 1972Median year apartment built: 1975Household type by relationship:
Households: 179,551
Male householders: 30,617 (12,709 living alone ), Female householders: 46,935 (16,450 living alone )21,624 spouses (21,490 opposite-sex spouses ), 6,328 unmarried partners , (5,722 opposite-sex unmarried partners ), 52,212 children (49,914 natural , 621 adopted , 1,677 stepchildren ), 6,695 grandchildren , 2,445 brothers or sisters , 1,865 parents , 0 foster children , 2,084 other relatives , 3,343 non-relatives In group quarters: 5,403
Size of family households: 23,523 2-persons , 9,866 3-persons , 5,791 4-persons , 2,933 5-persons , 370 6-persons , 481 7-or-more-persons .
Size of nonfamily households: 29,159 1-person , 4,739 2-persons , 690 3-persons .
9,911 married couples with children. single-parent households (2,569 men , 21,675 women ).
96.2% of residents of Shreveport speak English at home. of residents speak Spanish at home (61% speak English very well , 27% speak English well , 8% speak English not well , 4% don't speak English at all ).of residents speak other Indo-European language at home (79% speak English very well , 15% speak English well , 7% speak English not well ).of residents speak Asian or Pacific Island language at home (55% speak English very well , 34% speak English well , 8% speak English not well , 2% don't speak English at all ).of residents speak other language at home (83% speak English very well , 17% speak English not well ).
Foreign born population: 4,786 (2.7%)of them are naturalized citizens )
Median number of rooms in houses and condos:
Median number of rooms in apartments
Owner-occupied Renter-occupied
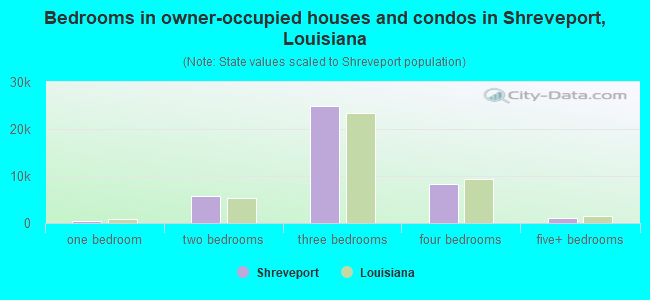
Bedrooms in owner-occupied houses and condos in Shreveport, Louisiana
99 no bedroom 423 1 bedroom 5,722 2 bedrooms 24,936 3 bedrooms 8,349 4 bedrooms 1,141 5+ bedrooms
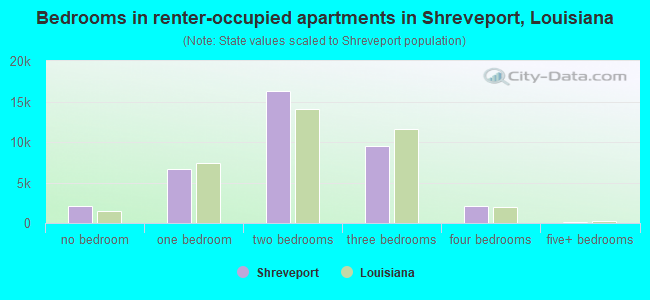
Bedrooms in renter-occupied apartments in Shreveport, Louisiana
2,114 no bedroom 6,667 1 bedroom 16,346 2 bedrooms 9,530 3 bedrooms 2,047 4 bedrooms 178 5+ bedrooms
Owner-occupied Renter-occupied
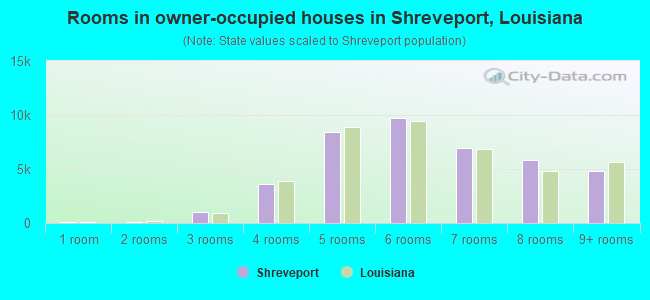
Rooms in owner-occupied houses in Shreveport, Louisiana
99 1 room 114 2 rooms 1,048 3 rooms 3,635 4 rooms 8,394 5 rooms 9,751 6 rooms 6,962 7 rooms 5,846 8 rooms 4,821 9+ rooms
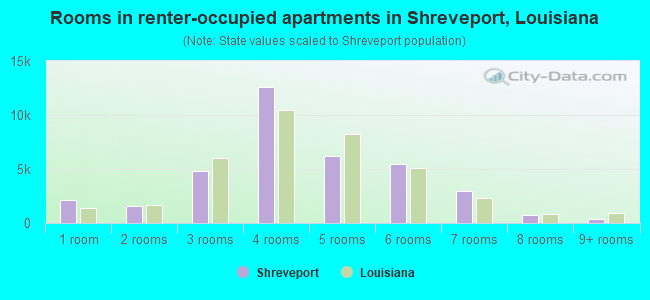
Rooms in renter-occupied apartments in Shreveport, Louisiana
2,089 1 room 1,560 2 rooms 4,809 3 rooms 12,606 4 rooms 6,243 5 rooms 5,498 6 rooms 2,963 7 rooms 768 8 rooms 346 9+ rooms
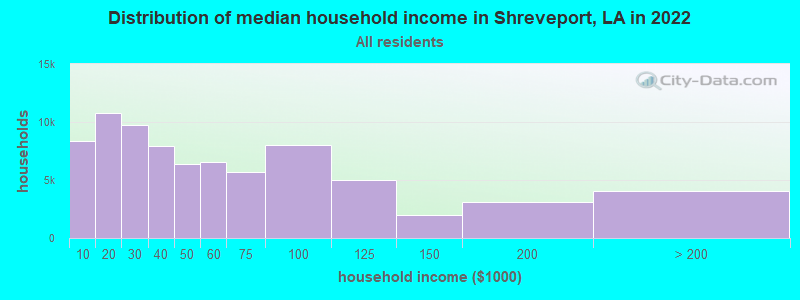
Shreveport, LA household income distribution 8,382 Less than $10,00010,759 $10,000 to $19,9999,710 $20,000 to $29,9997,905 $30,000 to $39,9996,389 $40,000 to $49,9996,516 $50,000 to $59,9995,706 $60,000 to $74,9997,988 $75,000 to $99,9995,019 $100,000 to $124,9992,009 $125,000 to $149,9993,129 $150,000 to $199,9994,040 $200,000 or more
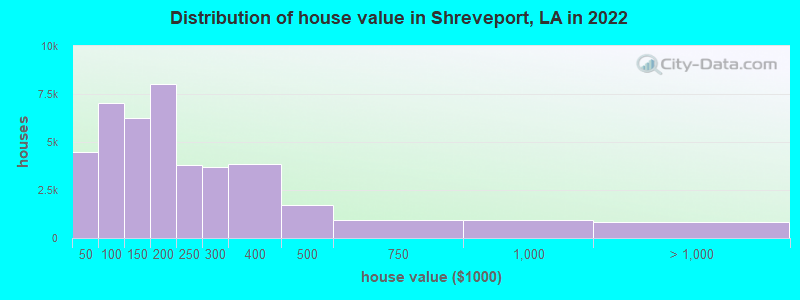
Home value of owner - occupied houses in 2022 in Shreveport, LA 1,283 Less than $10,000903 $10,000 to $14,999208 $15,000 to $19,999241 $20,000 to $24,999321 $25,000 to $29,999596 $30,000 to $34,99988 $35,000 to $39,999857 $40,000 to $49,999773 $50,000 to $59,9991,078 $60,000 to $69,9991,555 $70,000 to $79,9991,650 $80,000 to $89,9991,104 $90,000 to $99,9993,611 $100,000 to $124,9992,653 $125,000 to $149,9994,836 $150,000 to $174,9993,172 $175,000 to $199,9993,815 $200,000 to $249,9993,690 $250,000 to $299,9993,842 $300,000 to $399,9991,696 $400,000 to $499,999923 $500,000 to $749,999933 $750,000 to $999,999558 $1,000,000 to $1,499,99982 $1,500,000 to $1,999,999202 $2,000,000 or moreRent paid by renters in 2022 in Shreveport, LA 311 Less than $100544 $100 to $149293 $150 to $199740 $200 to $249753 $250 to $299986 $300 to $349846 $350 to $399869 $400 to $4491,809 $450 to $4992,139 $500 to $5491,307 $550 to $5991,923 $600 to $6493,867 $650 to $6993,818 $700 to $7491,701 $750 to $7994,660 $800 to $8992,273 $900 to $9992,400 $1,000 to $1,249855 $1,250 to $1,4992,621 $1,500 to $1,999216 $2,000 to $2,499249 $2,500 to $2,999154 $3,500 or more1,548 No cash rent
Percentage of workers working in this county: 80.8%Number of people working at home: 4,984 (6.4% of all workers )
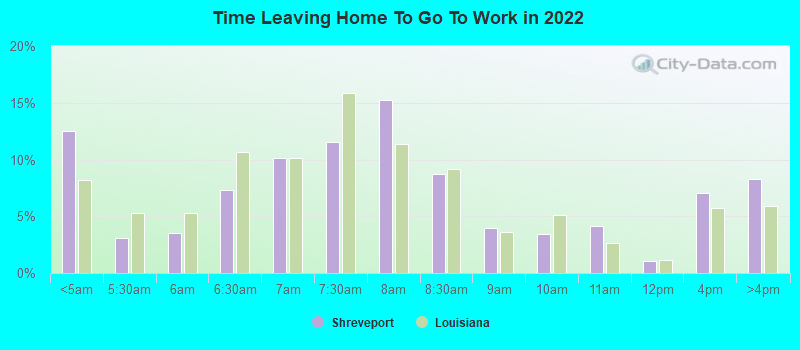
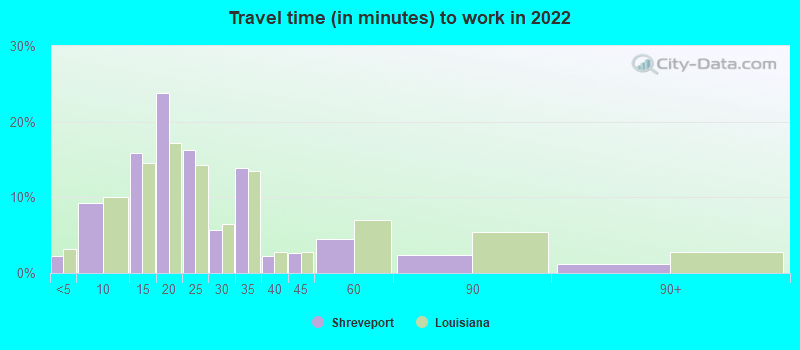
Travel time to work (commute)
Less than 5 minutes: 1,6665 to 9 minutes: 8,10210 to 14 minutes: 13,65715 to 19 minutes: 19,35420 to 24 minutes: 12,74525 to 29 minutes: 2,64030 to 34 minutes: 7,96735 to 39 minutes: 49640 to 44 minutes: 1,22645 to 59 minutes: 1,17360 to 89 minutes: 1,45390 or more minutes: 296
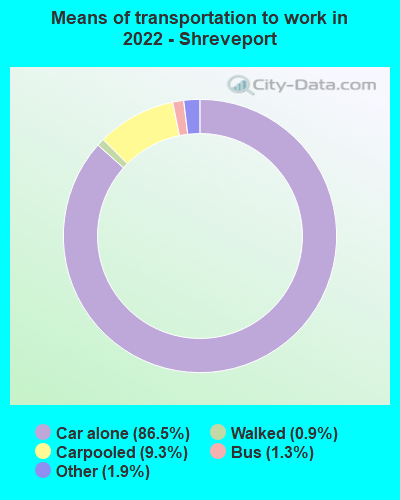
Means of transportation to work:
Drove a car alone: 80,451 (81.5%)Carpooled: 8,307 (8.4%)Bus : 918 (0.9%)Ferryboat: 19 (0.0%)Taxi: 2,905 (2.9%)Bicycle: 38 (0.0%)Walked: 1,175 (1.2%)Worked at home: 4,984 (5.1%)
Unemployment by race in 2022
Unemployment rate for White non-Hispanic residents 3.3% Males6.2% FemalesUnemployment rate for Black residents 13.9% Males9.4% FemalesUnemployment rate for American Indian and Alaska Native residents 8.0% FemalesUnemployment rate for Asian residents 1.0% Males1.1% FemalesUnemployment rate for other race residents 18.0% Males15.7% FemalesUnemployment rate for two or more race residents 5.7% Males3.9% FemalesUnemployment rate for Hispanic or Latino residents 8.6% Males12.9% Females
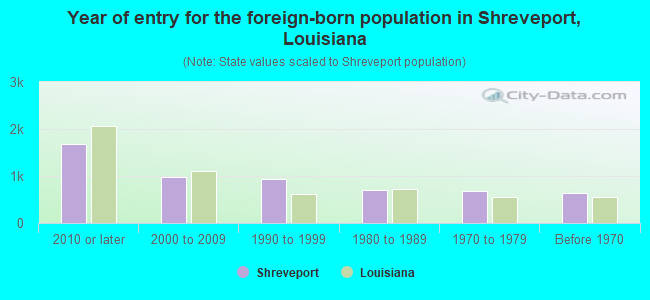
Year of entry for the foreign-born population in Shreveport, Louisiana
1,690 2010 or later 971 2000 to 2009 932 1990 to 1999 703 1980 to 1989 689 1970 to 1979 631 Before 1970
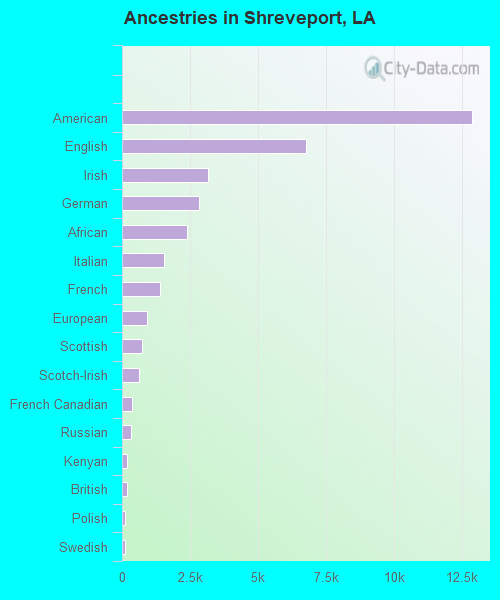
First ancestries reported:
American: 12,855 (11.1%)
English: 6,766 (5.8%)
Irish: 3,179 (2.7%)
German: 2,820 (2.4%)
African: 2,406 (2.1%)
Italian: 1,559 (1.3%)
French: 1,384 (1.2%)
European: 909 (0.8%)
Scottish: 740 (0.6%)
Scotch-Irish: 613 (0.5%)
French Canadian: 362 (0.3%)
Russian: 328 (0.3%)
Kenyan: 185 (0.2%)
British: 176 (0.2%)
Polish: 126 (0.1%)
Swedish: 123 (0.1%)
Cajun: 106 (0.09%)
Palestinian: 100 (0.09%)
Dutch: 98 (0.08%)
Norwegian: 97 (0.08%)
Welsh: 95 (0.08%)
Haitian: 89 (0.08%)
Jamaican: 82 (0.07%)
Danish: 69 (0.06%)
Romanian: 60 (0.05%)
Northern European: 57 (0.05%)
Greek: 56 (0.05%)
Lebanese: 51 (0.04%)
Portuguese: 50 (0.04%)
Belgian: 47 (0.04%)
Turkish: 40 (0.03%)
Trinidadian and Tobagonian: 36 (0.03%)
Iranian: 33 (0.03%)
Nigerian: 33 (0.03%)
Eastern European: 32 (0.03%)
Croatian: 31 (0.03%)
Icelander: 26 (0.02%)
Ukrainian: 23 (0.02%)
Swiss: 22 (0.02%)
Hungarian: 17 (0.01%)
Slovene: 13 (0.01%)
Israeli: 13 (0.01%)
Dutch West Indian: 13 (0.01%)
Czechoslovakian: 10 (0.01%)
Scandinavian: 7 (0.01%) Most common places of birth for foreign-born residents (%): Mexico Shreveport:
15.7% (719)Louisiana:
12.1% (23,732)
Philippines Shreveport:
9.0% (412)Louisiana:
3.1% (6,086)
Vietnam Shreveport:
7.5% (345)Louisiana:
9.2% (18,115)
China, excluding Hong Kong and Taiwan Shreveport:
6.7% (308)Louisiana:
3.4% (6,779)
India Shreveport:
6.3% (288)Louisiana:
3.9% (7,741)
Kenya Shreveport:
4.6% (209)Louisiana:
0.3% (516)
Russia Shreveport:
4.5% (206)Louisiana:
0.7% (1,435)
Germany Shreveport:
3.9% (177)Louisiana:
1.6% (3,186)
Pakistan Shreveport:
3.6% (167)Louisiana:
1.2% (2,282)
Singapore Shreveport:
3.2% (148)Louisiana:
0.1% (190)
Nepal Shreveport:
2.9% (134)Louisiana:
0.7% (1,299)
Guatemala Shreveport:
2.2% (100)Louisiana:
2.8% (5,576)
Romania Shreveport:
2.1% (98)Louisiana:
0.4% (844)
Uruguay Shreveport:
1.7% (79)Louisiana:
0.1% (146)
Bangladesh Shreveport:
1.6% (73)Louisiana:
0.7% (1,446)
Nicaragua Shreveport:
1.6% (72)Louisiana:
2.1% (4,115)
Costa Rica Shreveport:
1.5% (71)Louisiana:
0.4% (770)
Place of birth for U.S.-born residents:
This state: 137,494Other state: 35,868Northeast: 1,761Midwest: 6,924South: 23,516West: 3,667 85.6% of Shreveport residents lived in the same house 1 years ago.
Out of people who lived in different houses, 39.2% lived in this county.
Out of people who lived in different counties, 27.0% lived in Louisiana.
Shreveport:
85.6%State average:
88.3%
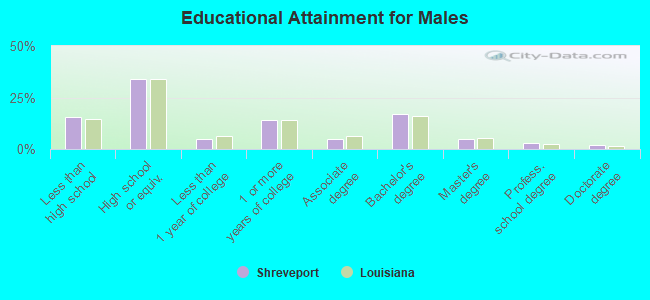
Education attainment for males 25 years and older:
No schooling: 1,531Nursery to 4th grade: 3455th and 6th grade: 1967th and 8th grade: 9879th grade: 50310th grade: 1,57011th grade: 2,36512th grade, no diploma: 1,244High school graduate (or equivalency): 19,372Less than 1 year of college: 2,728Some college more than 1 year, no degree: 8,019Associate degree: 2,819Bachelor's degree: 9,559Master's degree: 2,681Professional school degree: 1,784Doctorate degree: 1,040
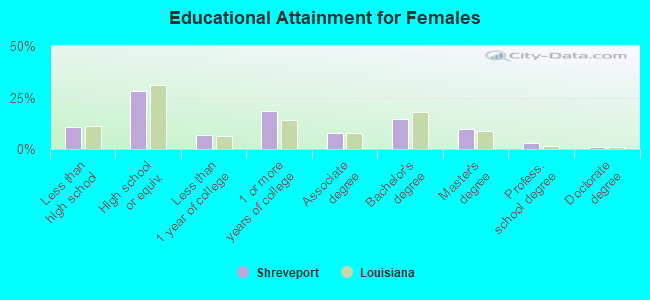
Education attainment for females 25 years and older:
No schooling: 1,114Nursery to 4th grade: 05th and 6th grade: 07th and 8th grade: 5199th grade: 52010th grade: 1,67811th grade: 1,73412th grade, no diploma: 1,608High school graduate (or equivalency): 19,016Less than 1 year of college: 4,489Some college more than 1 year, no degree: 12,419Associate degree: 5,167Bachelor's degree: 9,895Master's degree: 6,355Professional school degree: 1,799Doctorate degree: 697
Housing units in structures:
One, detached: 59,252One, attached: 2,627Two: 2,5223 or 4: 6,5765 to 9: 6,91310 to 19: 5,00520 to 49: 1,88850 or more: 3,450Mobile homes: 4,019Boats, RVs, vans, etc.: 110Median worth of mobile homes: $18,393
Housing units lacking complete plumbing facilities in 2022: 2.1%Housing units lacking complete kitchen facilities in 2022: 6.3%House/condo owner moved in on average 12 years ago
Renter moved in on average 2 years ago
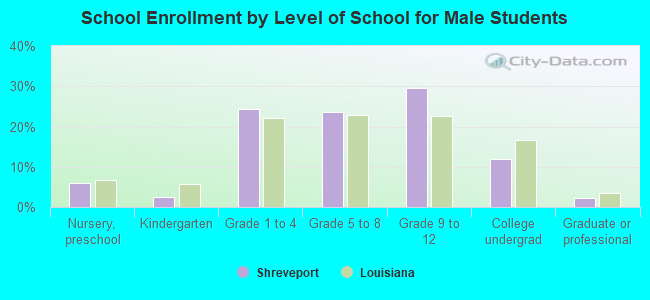
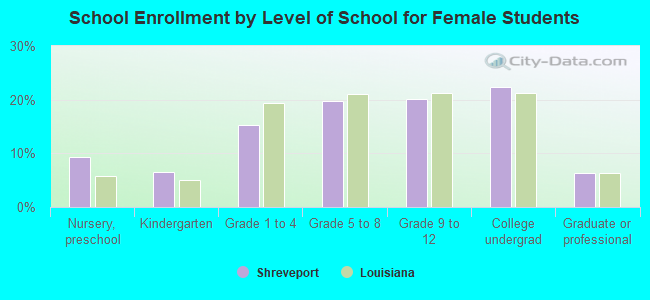
Private vs. public school enrollment:
Students in private schools in grades 1 to 8 (elementary and middle school): 1,516 Students in private schools in grades 9 to 12 (high school): 1,187 Here:
11.2%Louisiana:
18.3%
Students in private undergraduate colleges: 592