Housing density: 1,069 houses/condos per square mile
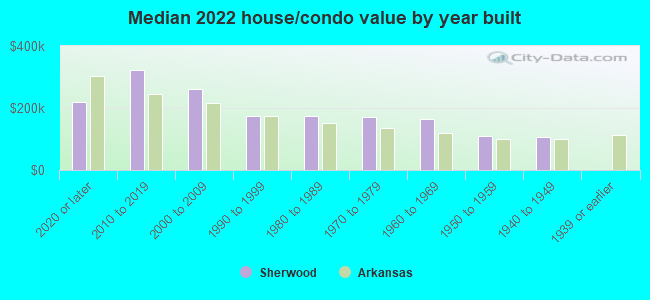
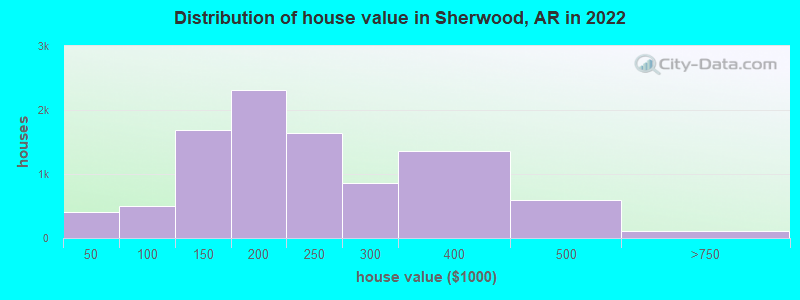
Median price asked for vacant for-sale houses and condos in 2022: $279,020.
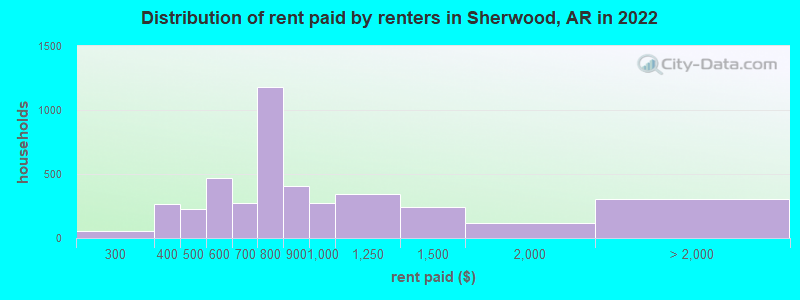
Median contract rent in 2022: $757 (lower quartile is $589, upper quartile is $955)
Median rent asked for vacant for-rent units in 2022: $795
Median gross rent in Sherwood, AR in 2022: $922
Housing units in Sherwood with a mortgage: 6,637 (323 second mortgage, 0 home equity loan, 289 both second mortgage and home equity loan) Houses without a mortgage: 97
Median household income for houses/condos with a mortgage: $86,610
Median household income for apartments without a mortgage: $75,791
4,176 married couples with children.
2,338 single-parent households (210 men, 2,128 women).
95.9% of residents of Sherwood speak English at home.
2.0% of residents speak Spanish at home (74% speak English very well, 23% speak English well, 3% speak English not well).
0.4% of residents speak other Indo-European language at home (66% speak English very well, 23% speak English well, 11% don't speak English at all).
1.3% of residents speak Asian or Pacific Island language at home (48% speak English very well, 41% speak English well, 10% speak English not well).
0.1% of residents speak other language at home (14% speak English very well, 86% speak English well).
Foreign born population: 650 (2.0%)
(72.9% of them are naturalized citizens)
Percentage of workers working in this county: 93.7% Number of people working at home: 1,873 (12.3% of all workers)
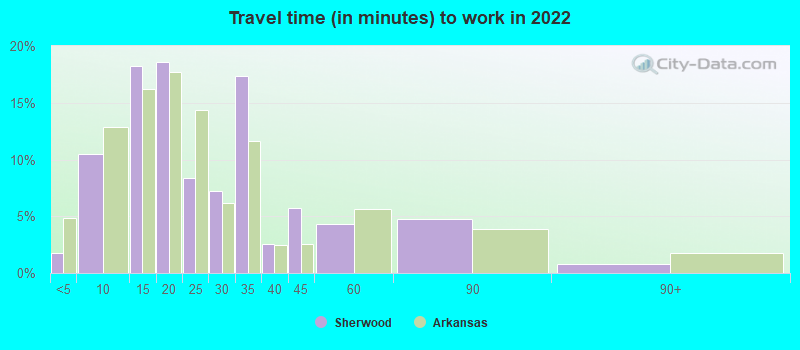
Travel time to work (commute)
Less than 5 minutes: 117
5 to 9 minutes: 747
10 to 14 minutes: 2,469
15 to 19 minutes: 3,036
20 to 24 minutes: 1,716
25 to 29 minutes: 1,469
30 to 34 minutes: 2,247
35 to 39 minutes: 303
40 to 44 minutes: 242
45 to 59 minutes: 439
60 to 89 minutes: 247
90 or more minutes: 319
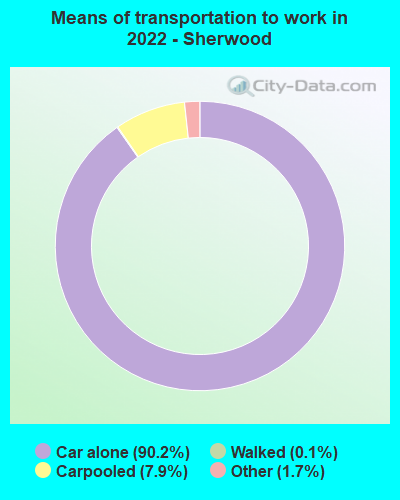
Means of transportation to work:
Drove a car alone: 7,009 (76.5%)
Carpooled: 437 (4.8%)
Taxi: 147 (1.6%)
Walked: 11 (0.1%)
Worked at home: 1,873 (20.4%)
Unemployment by race in 2022
Unemployment rate for White non-Hispanic residents
1.1%Males
3.4%Females
Unemployment rate for Black residents
2.5%Males
7.2%Females
Unemployment rate for Asian residents
13.7%Females
Unemployment rate for other race residents
15.0%Females
Unemployment rate for two or more race residents
4.9%Females
Unemployment rate for Hispanic or Latino residents
9.2%Females
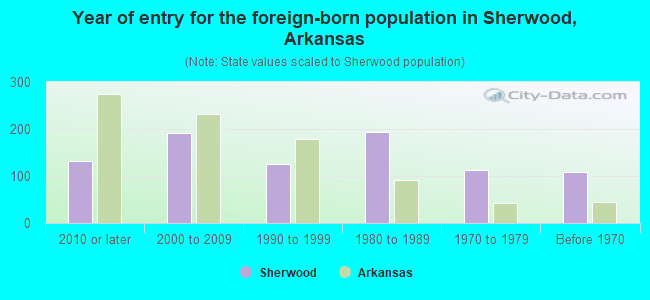
Year of entry for the foreign-born population in Sherwood, Arkansas
1312010 or later
1922000 to 2009
1261990 to 1999
1931980 to 1989
1131970 to 1979
108Before 1970
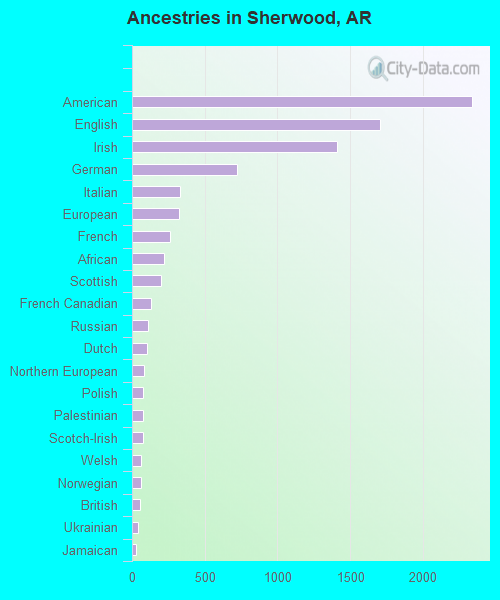
First ancestries reported:
American: 2,338 (13.8%)
English: 1,707 (10.1%)
Irish: 1,411 (8.3%)
German: 725 (4.3%)
Italian: 328 (1.9%)
European: 322 (1.9%)
French: 259 (1.5%)
African: 223 (1.3%)
Scottish: 200 (1.2%)
French Canadian: 132 (0.8%)
Russian: 107 (0.6%)
Dutch: 104 (0.6%)
Northern European: 83 (0.5%)
Polish: 78 (0.5%)
Palestinian: 73 (0.4%)
Scotch-Irish: 73 (0.4%)
Welsh: 62 (0.4%)
Norwegian: 60 (0.4%)
British: 56 (0.3%)
Ukrainian: 42 (0.2%)
Jamaican: 25 (0.1%)
Armenian: 21 (0.1%)
Danish: 18 (0.1%)
Iranian: 14 (0.08%)
Czech: 7 (0.04%)
Slovak: 7 (0.04%)
Croatian: 6 (0.04%)
Swedish: 6 (0.04%)
Israeli: 4 (0.02%)
Portuguese: 4 (0.02%)
Alsatian: 2 (0.01%)
Eastern European: 2 (0.01%)
Most common places of birth for foreign-born residents (%):
Mexico
Sherwood:
31.1% (241)
Arkansas:
40.2% (61,075)
Philippines
Sherwood:
16.9% (131)
Arkansas:
2.7% (4,128)
Korea
Sherwood:
11.0% (85)
Arkansas:
1.2% (1,813)
Iran
Sherwood:
6.5% (50)
Arkansas:
0.3% (487)
Thailand
Sherwood:
5.7% (44)
Arkansas:
0.7% (1,136)
Germany
Sherwood:
4.0% (31)
Arkansas:
1.8% (2,721)
Cambodia
Sherwood:
3.6% (28)
Arkansas:
0.2% (338)
Jamaica
Sherwood:
3.2% (25)
Arkansas:
0.2% (240)
Denmark
Sherwood:
2.2% (17)
Arkansas:
0.1% (148)
Taiwan
Sherwood:
1.8% (14)
Arkansas:
0.3% (439)
St. Vincent and the Grenadines
Sherwood:
1.8% (14)
Arkansas:
0.0% (17)
Other Caribbean
Sherwood:
1.7% (13)
Arkansas:
0.1% (77)
Indonesia
Sherwood:
1.6% (12)
Arkansas:
0.3% (486)
Bolivia
Sherwood:
1.6% (12)
Arkansas:
0.1% (149)
Place of birth for U.S.-born residents:
This state: 20,752
Other state: 11,220
Northeast: 629
Midwest: 2,425
South: 6,156
West: 2,045
86.7% of Sherwood residents lived in the same house 1 years ago. Out of people who lived in different houses, 32.5% lived in this county. Out of people who lived in different counties, 60.5% lived in Arkansas.
Sherwood:
86.7%
State average:
87.0%
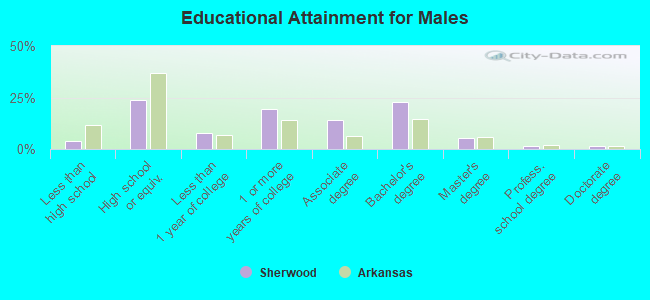
Education attainment for males 25 years and older:
No schooling: 93
Nursery to 4th grade: 47
5th and 6th grade: 0
7th and 8th grade: 77
9th grade: 84
10th grade: 25
11th grade: 27
12th grade, no diploma: 69
High school graduate (or equivalency): 2,527
Less than 1 year of college: 847
Some college more than 1 year, no degree: 2,056
Associate degree: 1,493
Bachelor's degree: 2,424
Master's degree: 590
Professional school degree: 131
Doctorate degree: 178
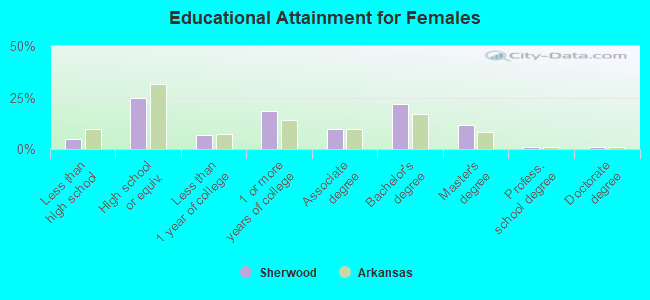
Education attainment for females 25 years and older:
No schooling: 84
Nursery to 4th grade: 42
5th and 6th grade: 6
7th and 8th grade: 50
9th grade: 11
10th grade: 144
11th grade: 93
12th grade, no diploma: 174
High school graduate (or equivalency): 3,021
Less than 1 year of college: 801
Some college more than 1 year, no degree: 2,244
Associate degree: 1,193
Bachelor's degree: 2,638
Master's degree: 1,436
Professional school degree: 122
Doctorate degree: 110
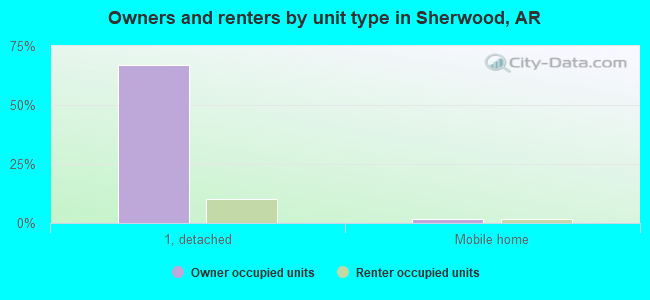
Housing units in structures:
One, detached: 11,632
One, attached: 155
Two: 337
3 or 4: 595
5 to 9: 507
10 to 19: 558
20 to 49: 129
50 or more: 242
Mobile homes: 538
Boats, RVs, vans, etc.: 58
Median worth of mobile homes: $174,428
Housing units lacking complete plumbing facilities in 2022: 3.5%
Housing units lacking complete kitchen facilities in 2022: 3.2%
House/condo owner moved in on average 10 years ago