Shelbyville, TX (Texas) Houses and Residents
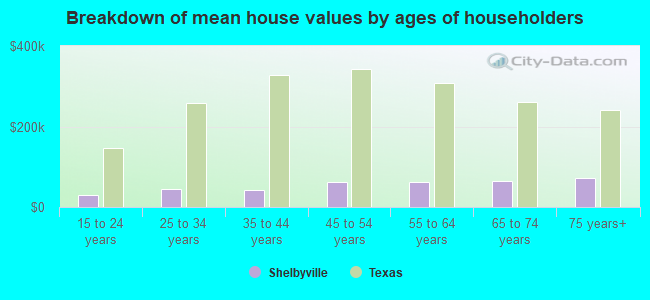
| Shelbyville: | $126,266 |
| Texas: | $275,400 |
Total population: 3,415 (Urban population: 0, Rural population: 3,271 (189 farm, 3,082 nonfarm))
Houses: 1,989 (1,340 occupied: 1,186 owner occupied, 154 renter occupied)
| % of renters here: | 11% |
| State: | 38% |
Housing density: 9 houses/condos per square mile
Median price asked for vacant for-sale houses and condos in 2022 in this county: $184,550.
Median contract rent in 2022: $831 (lower quartile is $692, upper quartile is $846)
Median gross rent in Shelbyville, TX in 2022: $1,029
Housing units in Shelbyville with a mortgage: 161 (9 second mortgage, 5 home equity loan, 0 both second mortgage and home equity loan)
Houses without a mortgage: 325


Household type by relationship:
Households: 25,276- In family households: 21,869 (4,699 male householders, 2,072 female householders)
5,024 spouses, 7,594 children (6,866 natural, 217 adopted, 511 stepchildren), 900 grandchildren, 247 brothers or sisters, 215 parents, foster children, 431 other relatives, 537 non-relatives
- In nonfamily households: 3,407 (1,428 male householders (1,193 living alone)), 1,449 female householders (1,304 living alone)), 530 nonrelatives
- In group quarters: 172 (162 institutionalized population)
4,255 married couples with children.
1,538 single-parent households (331 men, 1,207 women).
97.3% of residents of Shelbyville speak English at home.
2.0% of residents speak Spanish at home (31% speak English very well, 10% speak English well, 39% speak English not well, 20% don't speak English at all).
0.1% of residents speak other Indo-European language at home (100% speak English well).
0.6% of residents speak Asian or Pacific Island language at home (100% speak English very well).
Foreign born population: 74 (1.7%)
(0.0% of them are naturalized citizens)
| Here: | 6.0 |
| State: | 6.3 |
| Here: | 4.8 |
| State: | 4.0 |
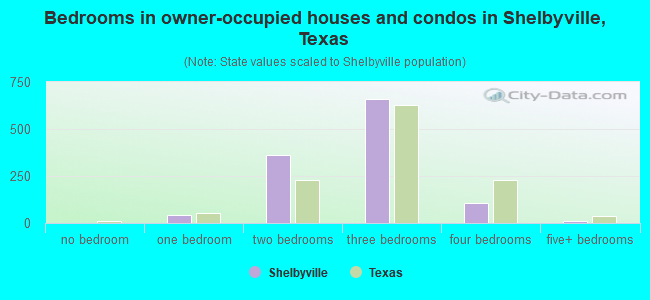
- Bedrooms in owner-occupied houses and condos in Shelbyville, Texas
- 0no bedroom
- 451 bedroom
- 3622 bedrooms
- 6623 bedrooms
- 1074 bedrooms
- 105+ bedrooms
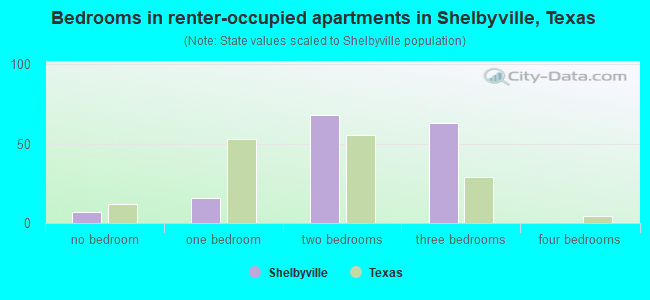
- Bedrooms in renter-occupied apartments in Shelbyville, Texas
- 7no bedroom
- 161 bedroom
- 682 bedrooms
- 633 bedrooms
- 04 bedrooms
- 05+ bedrooms
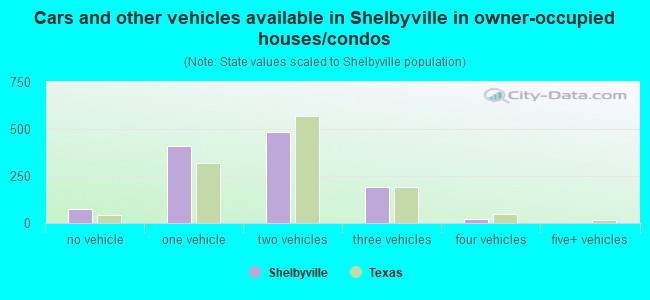
- Cars and other vehicles available in Shelbyville in owner-occupied houses/condos
- 77no vehicle
- 4101 vehicle
- 4852 vehicles
- 1943 vehicles
- 204 vehicles
- 05+ vehicles
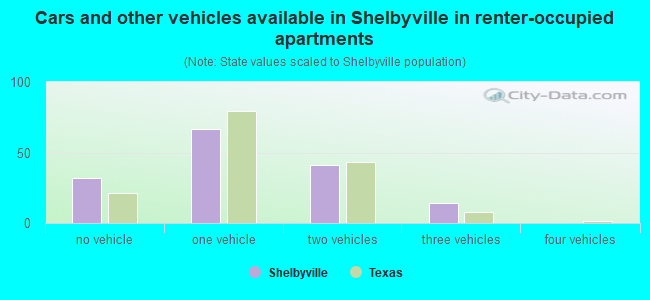
- Cars and other vehicles available in Shelbyville in renter-occupied apartments
- 32no vehicle
- 671 vehicle
- 412 vehicles
- 143 vehicles
- 04 vehicles
- 05+ vehicles
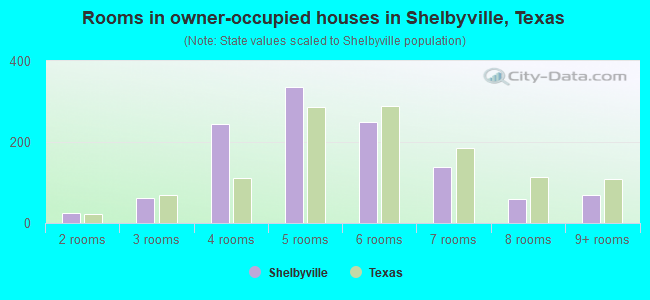
- Rooms in owner-occupied houses in Shelbyville, Texas
- 01 room
- 252 rooms
- 613 rooms
- 2454 rooms
- 3365 rooms
- 2506 rooms
- 1397 rooms
- 608 rooms
- 709+ rooms
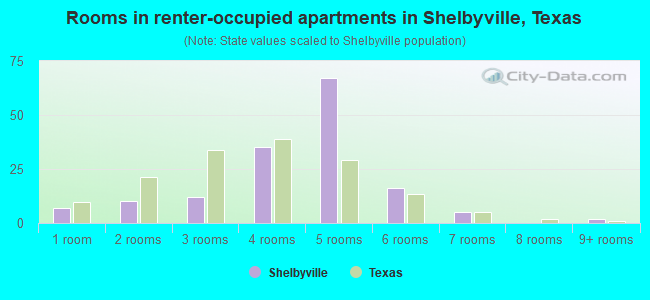
- Rooms in renter-occupied apartments in Shelbyville, Texas
- 71 room
- 102 rooms
- 123 rooms
- 354 rooms
- 675 rooms
- 166 rooms
- 57 rooms
- 08 rooms
- 29+ rooms
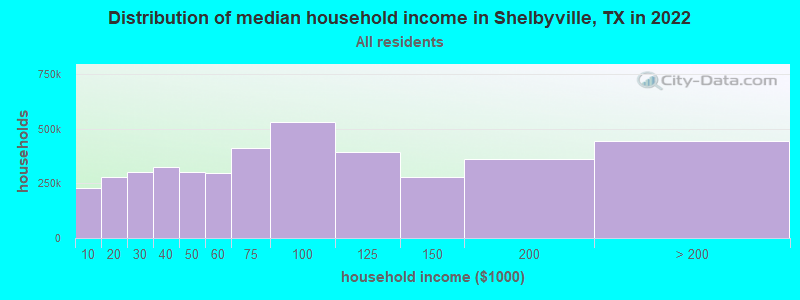
Shelbyville, TX household income distribution

- 67,280Less than $10,000
- 91,468$10,000 to $19,999
- 99,508$20,000 to $29,999
- 104,807$30,000 to $39,999
- 98,881$40,000 to $49,999
- 94,899$50,000 to $59,999
- 131,369$60,000 to $74,999
- 179,874$75,000 to $99,999
- 136,355$100,000 to $124,999
- 100,527$125,000 to $149,999
- 116,902$150,000 to $199,999
- 131,402$200,000 or more
Percentage of workers working in this county: 80.0%
Number of people working at home: 195 (11.1% of all workers)
Travel time to work (commute)
- Less than 5 minutes: 36
- 5 to 9 minutes: 58
- 10 to 14 minutes: 162
- 15 to 19 minutes: 144
- 20 to 24 minutes: 196
- 25 to 29 minutes: 50
- 30 to 34 minutes: 258
- 35 to 39 minutes: 17
- 40 to 44 minutes: 9
- 45 to 59 minutes: 109
- 60 to 89 minutes: 83
- 90 or more minutes: 104
Means of transportation to work:
- Drove a car alone: 921 (71.6%)
- Carpooled: 245 (19.0%)
- Bus or trolley bus: 2 (0.2%)
- Walked: 46 (3.6%)
- Other means: 12 (0.9%)
- Worked at home: 61 (4.7%)
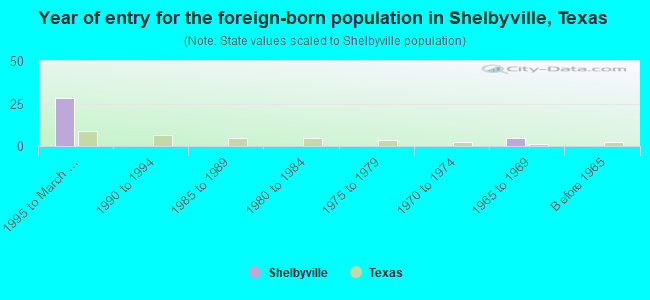
- Year of entry for the foreign-born population in Shelbyville, Texas
- 281995 to March 2000
- 01990 to 1994
- 01985 to 1989
- 01980 to 1984
- 01975 to 1979
- 01970 to 1974
- 51965 to 1969
- 0Before 1965
Most common places of birth for foreign-born residents (%):
| Shelbyville: | 84.8% (28) |
| Texas: | 64.8% (1,879,369) |
| Shelbyville: | 15.2% (5) |
| Texas: | 1.3% (36,802) |
Place of birth for U.S.-born residents:
- This state: 2,552
- Other state: 679
- Northeast: 14
- Midwest: 107
- South: 481
- West: 77
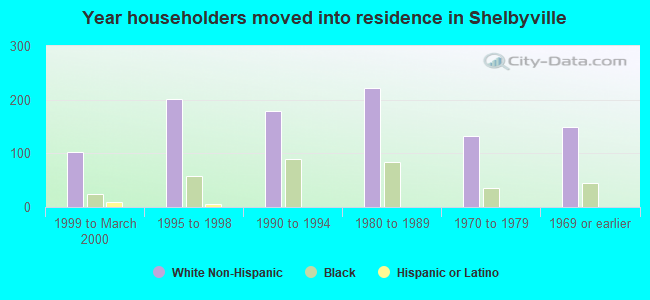
72% of Shelbyville residents lived in the same house 5 years ago.
Out of people who lived in different houses, 61% lived in this county.
Out of people who lived in different counties, 70% lived in Texas.
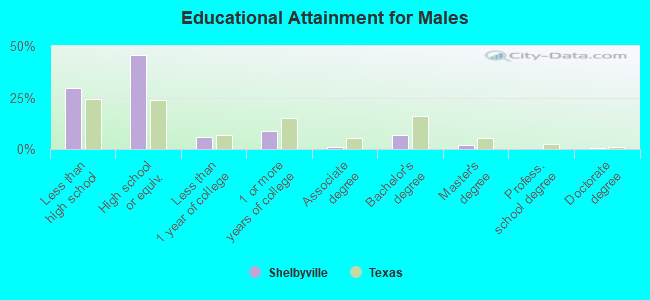
Education attainment for males 25 years and older:
- No schooling: 52
- Nursery to 4th grade: 2
- 5th and 6th grade: 25
- 7th and 8th grade: 47
- 9th grade: 34
- 10th grade: 28
- 11th grade: 73
- 12th grade, no diploma: 51
- High school graduate (or equivalency): 478
- Less than 1 year of college: 59
- Some college more than 1 year, no degree: 92
- Associate degree: 10
- Bachelor's degree: 70
- Master's degree: 21
- Professional school degree: 0
- Doctorate degree: 7
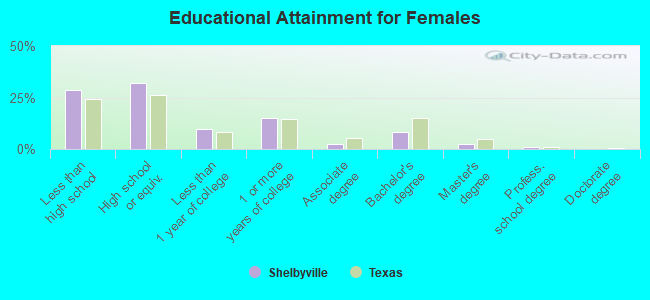
Education attainment for females 25 years and older:
- No schooling: 3
- Nursery to 4th grade: 11
- 5th and 6th grade: 28
- 7th and 8th grade: 38
- 9th grade: 87
- 10th grade: 68
- 11th grade: 82
- 12th grade, no diploma: 36
- High school graduate (or equivalency): 394
- Less than 1 year of college: 119
- Some college more than 1 year, no degree: 187
- Associate degree: 29
- Bachelor's degree: 101
- Master's degree: 32
- Professional school degree: 12
- Doctorate degree: 0


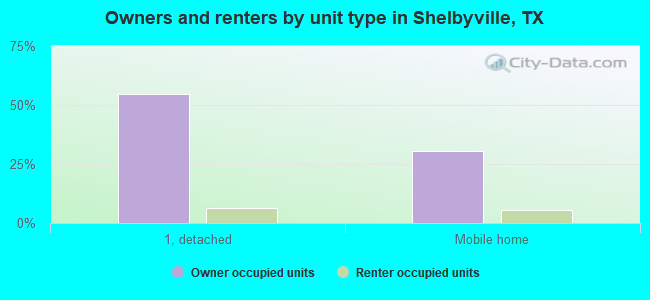
Housing units in structures:
- One, detached: 1,129
- One, attached: 29
- 3 or 4: 13
- Mobile homes: 762
- Boats, RVs, vans, etc.: 56
Median worth of mobile homes: $85,553
Housing units lacking complete kitchen facilities: 5.5%
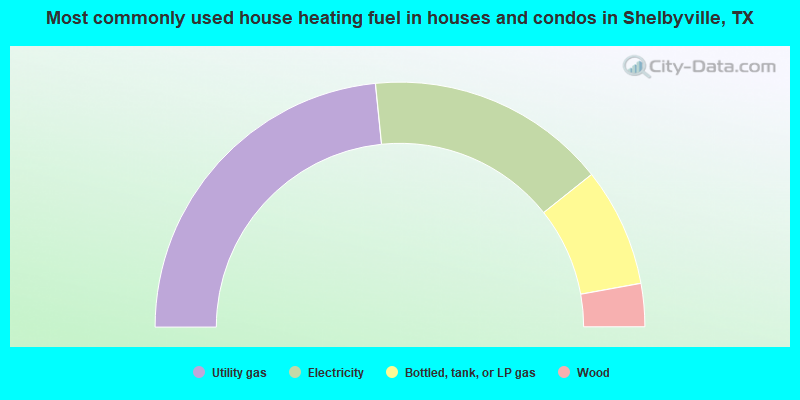
- 46.8%Utility gas
- 31.8%Electricity
- 15.7%Bottled, tank, or LP gas
- 5.7%Wood
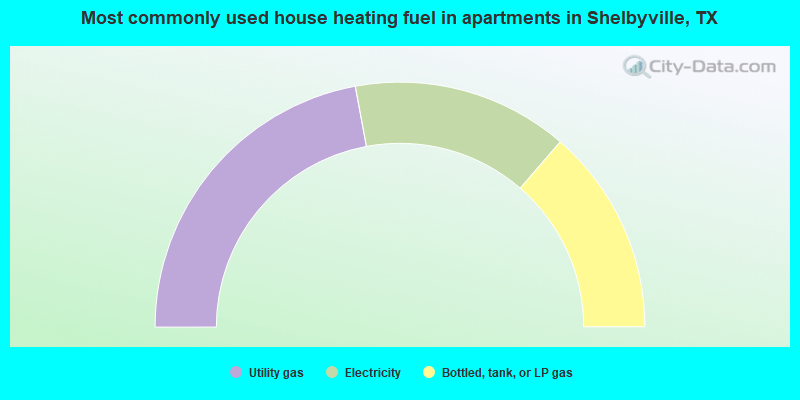
- 44.2%Utility gas
- 28.6%Electricity
- 27.3%Bottled, tank, or LP gas
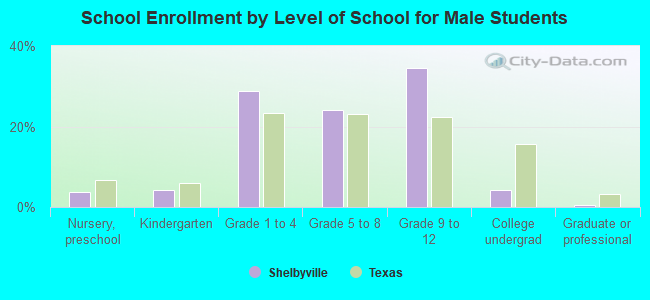
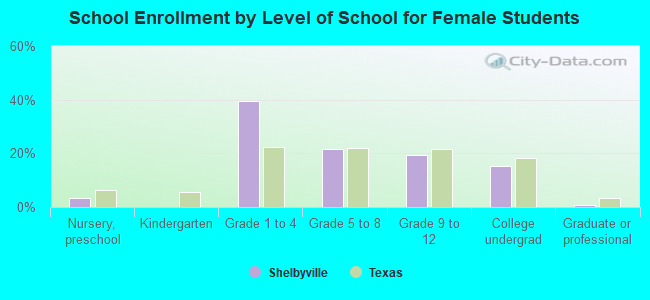
Private vs. public school enrollment:
| Here: | 0.0% |
| Texas: | 6.8% |
| Here: | 9.8% |
| Texas: | 6.2% |
| Here: | 14.7% |
| Texas: | 15.4% |