Shelburne, MA (Massachusetts) Houses and Residents
| Shelburne: | $352,149 |
| Massachusetts: | $534,700 |
Total population: 1,893 (Urban population: 7 (all inside urban clusters), Rural population: 2,043 (42 farm, 2,001 nonfarm))
Houses: 877 (826 occupied: 509 owner occupied, 317 renter occupied)
| % of renters here: | 38% |
| State: | 38% |
Housing density: 38 houses/condos per square mile
Median price asked for vacant for-sale houses and condos in 2022 in this county: $191,319.
Median contract rent in 2022: $868 (lower quartile is $522, upper quartile is $1,109)
Median rent asked for vacant for-rent units in 2022: $1,422
Median gross rent in Shelburne, MA in 2022: $968
Housing units in Shelburne with a mortgage: 180 (8 second mortgage, 14 home equity loan, 0 both second mortgage and home equity loan)
Houses without a mortgage: 132


Latest news about housing in Shelburne, MA collected exclusively by city-data.com from local newspapers, TV, and radio stations

 | How Much Massachusetts Households Make Per Year: Census Data (37 replies) |
| Estate In Leverett (6 replies) |
| "Migrants" living in hotels in MA---What is the endgame or is there one at all? (1050 replies) |
| What is the best MA community for a summer home? (30 replies) |
| Opinions on Northfield, Shelburne Falls (14 replies) |
| "All-Inclusive Boston" campaiagn (582 replies) |

Household type by relationship:
Households: 69,891- In family households: 54,236 (12,210 male householders, 6,107 female householders)
13,655 spouses, 17,750 children (16,448 natural, 543 adopted, 759 stepchildren), 917 grandchildren, 418 brothers or sisters, 464 parents, foster children, 409 other relatives, 1,987 non-relatives
- In nonfamily households: 15,655 (5,446 male householders (3,978 living alone)), 6,699 female householders (5,318 living alone)), 3,510 nonrelatives
- In group quarters: 1,481 (665 institutionalized population)
11,122 married couples with children.
4,422 single-parent households (1,025 men, 3,397 women).
94.6% of residents of Shelburne speak English at home.
1.1% of residents speak Spanish at home (64% speak English very well, 36% speak English not well).
1.8% of residents speak other Indo-European language at home (75% speak English very well, 8% speak English well, 17% speak English not well).
1.1% of residents speak Asian or Pacific Island language at home (100% speak English not well).
1.4% of residents speak other language at home (78% speak English very well, 22% speak English well).
Foreign born population: 132 (6.5%)
(47.0% of them are naturalized citizens)
| Here: | 6.4 |
| State: | 6.5 |
| Here: | 4.0 |
| State: | 4.0 |

- Bedrooms in owner-occupied houses and condos in Shelburne, Massachusetts
- 0no bedroom
- 161 bedroom
- 682 bedrooms
- 2693 bedrooms
- 1124 bedrooms
- 445+ bedrooms

- Bedrooms in renter-occupied apartments in Shelburne, Massachusetts
- 6no bedroom
- 1241 bedroom
- 932 bedrooms
- 483 bedrooms
- 414 bedrooms
- 55+ bedrooms

- Cars and other vehicles available in Shelburne in owner-occupied houses/condos
- 16no vehicle
- 1401 vehicle
- 2512 vehicles
- 833 vehicles
- 194 vehicles
- 05+ vehicles

- Cars and other vehicles available in Shelburne in renter-occupied apartments
- 38no vehicle
- 1881 vehicle
- 682 vehicles
- 173 vehicles
- 64 vehicles
- 05+ vehicles

- Rooms in owner-occupied houses in Shelburne, Massachusetts
- 01 room
- 52 rooms
- 113 rooms
- 254 rooms
- 595 rooms
- 1316 rooms
- 957 rooms
- 748 rooms
- 1099+ rooms

- Rooms in renter-occupied apartments in Shelburne, Massachusetts
- 61 room
- 312 rooms
- 783 rooms
- 604 rooms
- 585 rooms
- 346 rooms
- 147 rooms
- 168 rooms
- 209+ rooms


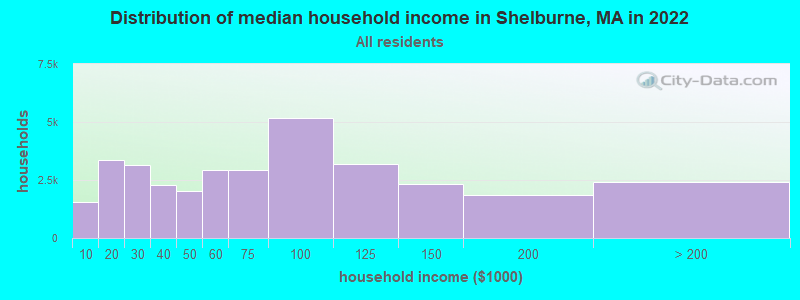
Shelburne, MA household income distribution

- 1,533Less than $10,000
- 3,360$10,000 to $19,999
- 3,146$20,000 to $29,999
- 2,296$30,000 to $39,999
- 2,010$40,000 to $49,999
- 2,938$50,000 to $59,999
- 2,913$60,000 to $74,999
- 5,188$75,000 to $99,999
- 3,197$100,000 to $124,999
- 2,307$125,000 to $149,999
- 1,854$150,000 to $199,999
- 2,414$200,000 or more
Percentage of workers working in this county: 84.4%
Number of people working at home: 215 (18.4% of all workers)
Travel time to work (commute)
- Less than 5 minutes: 52
- 5 to 9 minutes: 97
- 10 to 14 minutes: 161
- 15 to 19 minutes: 162
- 20 to 24 minutes: 128
- 25 to 29 minutes: 47
- 30 to 34 minutes: 129
- 35 to 39 minutes: 70
- 40 to 44 minutes: 41
- 45 to 59 minutes: 43
- 60 to 89 minutes: 15
- 90 or more minutes: 15
Means of transportation to work:
- Drove a car alone: 748 (72.3%)
- Carpooled: 146 (14.1%)
- Bus or trolley bus: 5 (0.5%)
- Subway or elevated: 5 (0.5%)
- Bicycle: 9 (0.9%)
- Walked: 47 (4.5%)
- Worked at home: 74 (7.2%)


- Year of entry for the foreign-born population in Shelburne, Massachusetts
- 261995 to March 2000
- 121990 to 1994
- 231985 to 1989
- 01980 to 1984
- 151975 to 1979
- 31970 to 1974
- 31965 to 1969
- 3Before 1965

First ancestries reported:
- English: 505 (21.7%)
- Irish: 355 (15.3%)
- German: 233 (10.0%)
- Other: 198 (8.5%)
- Polish: 168 (7.2%)
- Italian: 148 (6.4%)
- French: 132 (5.7%)
- Scottish: 125 (5.4%)
- French Canadian: 123 (5.3%)
- United States: 75 (3.2%)
- Scotch-Irish: 52 (2.2%)
- Czech: 45 (1.9%)
- Lithuanian: 28 (1.2%)
- Russian: 26 (1.1%)
- Ukrainian: 20 (0.9%)
- Swedish: 18 (0.8%)
- Welsh: 18 (0.8%)
- Dutch: 15 (0.6%)
- Swiss: 14 (0.6%)
- Norwegian: 8 (0.3%)
- Hungarian: 7 (0.3%)
- Portuguese: 6 (0.3%)
- Greek: 4 (0.2%)
- Danish: 3 (0.1%)
Most common places of birth for foreign-born residents (%):
| Shelburne: | 25.9% (22) |
| Massachusetts: | 5.2% (40,247) |
| Shelburne: | 23.5% (20) |
| Massachusetts: | 0.3% (1,943) |
| Shelburne: | 20.0% (17) |
| Massachusetts: | 5.1% (39,255) |
| Shelburne: | 12.9% (11) |
| Massachusetts: | 1.9% (14,883) |
| Shelburne: | 9.4% (8) |
| Massachusetts: | 0.4% (3,051) |
| Shelburne: | 4.7% (4) |
| Massachusetts: | 3.6% (28,086) |
| Shelburne: | 3.5% (3) |
| Massachusetts: | 0.3% (2,642) |
Place of birth for U.S.-born residents:
- This state: 1,399
- Other state: 561
- Northeast: 383
- Midwest: 83
- South: 38
- West: 57
56% of Shelburne residents lived in the same house 5 years ago.
Out of people who lived in different houses, 62% lived in this county.
Out of people who lived in different counties, 48% lived in Massachusetts.
Education attainment for males 25 years and older:
- No schooling: 10
- Nursery to 4th grade: 0
- 5th and 6th grade: 4
- 7th and 8th grade: 14
- 9th grade: 7
- 10th grade: 4
- 11th grade: 4
- 12th grade, no diploma: 14
- High school graduate (or equivalency): 227
- Less than 1 year of college: 39
- Some college more than 1 year, no degree: 80
- Associate degree: 31
- Bachelor's degree: 125
- Master's degree: 74
- Professional school degree: 13
- Doctorate degree: 15

Education attainment for females 25 years and older:
- No schooling: 3
- Nursery to 4th grade: 0
- 5th and 6th grade: 0
- 7th and 8th grade: 17
- 9th grade: 3
- 10th grade: 6
- 11th grade: 8
- 12th grade, no diploma: 3
- High school graduate (or equivalency): 204
- Less than 1 year of college: 42
- Some college more than 1 year, no degree: 130
- Associate degree: 66
- Bachelor's degree: 199
- Master's degree: 79
- Professional school degree: 33
- Doctorate degree: 0


Housing units in structures:
- One, detached: 511
- One, attached: 33
- Two: 141
- 3 or 4: 86
- 5 to 9: 51
- 10 to 19: 19
- 20 to 49: 16
- 50 or more: 3
- Mobile homes: 17
Median worth of mobile homes: $96,136
Housing units lacking complete kitchen facilities: 1.3%

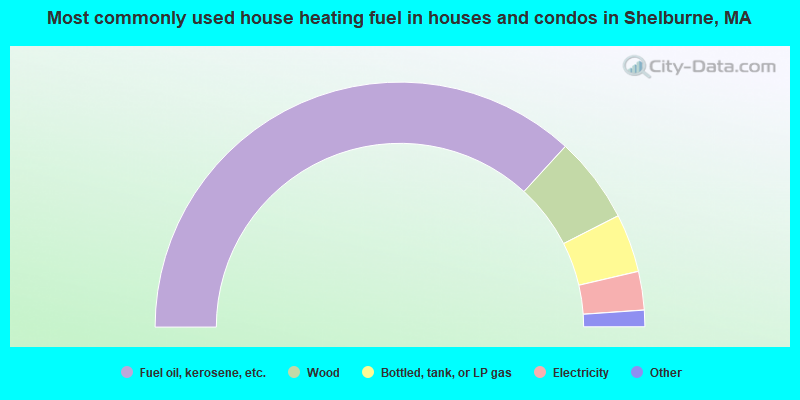
- 73.7%Fuel oil, kerosene, etc.
- 11.4%Wood
- 7.7%Bottled, tank, or LP gas
- 5.1%Electricity
- 1.6%Other fuel
- 0.6%Solar energy
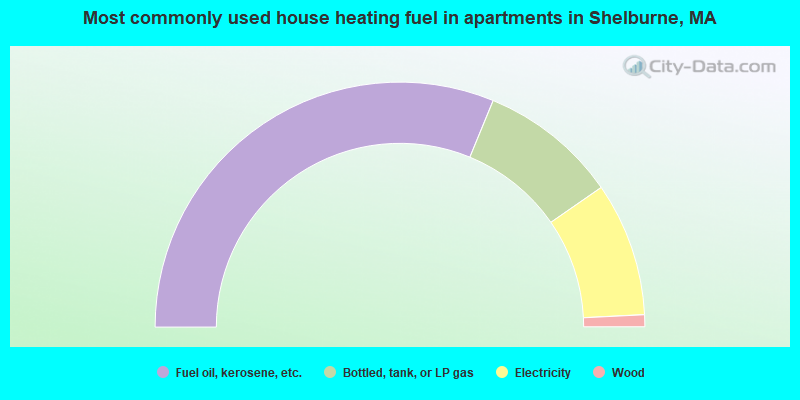
- 62.5%Fuel oil, kerosene, etc.
- 18.3%Bottled, tank, or LP gas
- 17.7%Electricity
- 1.6%Wood
Private vs. public school enrollment:
| Here: | 8.1% |
| Massachusetts: | 10.8% |
| Here: | 9.8% |
| Massachusetts: | 12.2% |
| Here: | 33.8% |
| Massachusetts: | 48.2% |


