Seneca, IL (Illinois) Houses and Residents
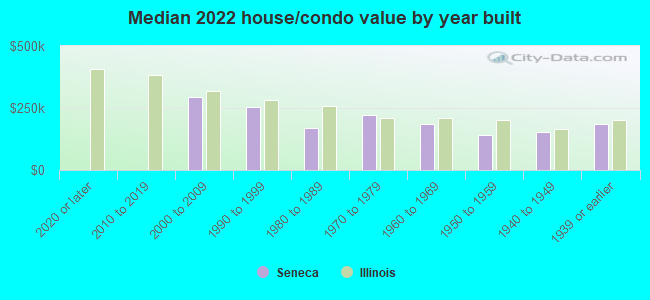
| Seneca: | $204,742 |
| Illinois: | $251,600 |
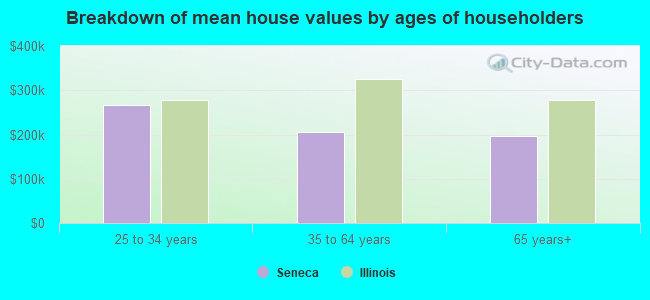
Mean price in 2022:
Detached houses: $222,207
Here: $222,207 State: $310,164 Mobile homes: $13,985
Here: $13,985 State: $78,855
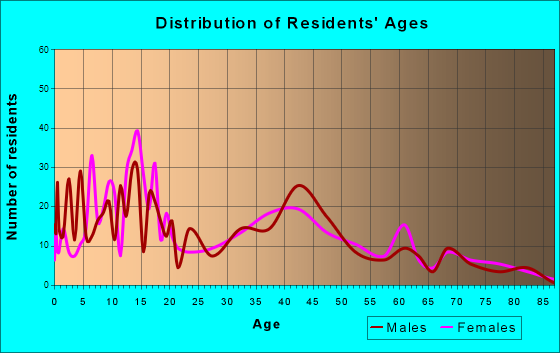
Total population: 2,306 (Urban population: 1,955 (all inside urban clusters), Rural population: 143 (all nonfarm))
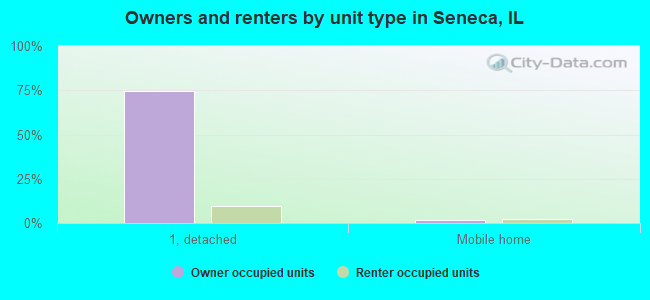
Houses: 1,002 (947 occupied: 760 owner occupied, 188 renter occupied)
| % of renters here: | 20% |
| State: | 33% |
Housing density: 303 houses/condos per square mile
Median price asked for vacant for-sale houses and condos in 2022: $87,531.
Median contract rent in 2022: $827 (lower quartile is $708, upper quartile is $1,088)
Median rent asked for vacant for-rent units in 2022: $863
Median gross rent in Seneca, IL in 2022: $993
Housing units in Seneca with a mortgage: 452 (29 second mortgage, 0 home equity loan, 19 both second mortgage and home equity loan)
Houses without a mortgage: 32
Median household income for houses/condos with a mortgage: $105,864
Median household income for apartments without a mortgage: $56,962
Median monthly housing costs: $975
Compare current foreclosures near Seneca, IL:
| Photo | Address | Area | Beds / Baths | Price | Details |
|---|---|---|---|---|---|

|
#1
S Main St
Seneca, IL 61360
|
- sq. feet
|
- baths - beds |
show details | |

|
#2
E Jackson St Lot 10
Seneca, IL 61360
|
- sq. feet
|
- baths - beds |
show details | |

|
#3
N 35th Rd
Seneca, IL 61360
|
- sq. feet
|
- baths - beds |
show details | |

|
#4
N Main St
Seneca, IL 61360
|
- sq. feet
|
- baths - beds |
show details | |

|
#5
S Hossack St
Seneca, IL 61360
|
- sq. feet
|
- baths - beds |
show details | |

|
#6
S Cash St
Seneca, IL 61360
|
- sq. feet
|
- baths - beds |
show details | |

|
#7
Fillebrowne St
Marseilles, IL 61341
|
1,032 sq. feet
|
1 baths 3 beds |
show details | |

|
#8
State St
Ottawa, IL 61350
|
1,444 sq. feet
|
2 baths 3 beds |
show details | |

|
#9
N 24th Rd
Marseilles, IL 61341
|
1,400 sq. feet
|
1 baths 4 beds |
show details | |

|
#10
N 3739th Rd
Sheridan, IL 60551
|
- sq. feet
|
2 baths 4 beds |
show details |
| Photo | Address | Area | Beds / Baths | Price | Details |
|---|---|---|---|---|---|

|
#11
Palmor Dr
Ottawa, IL 61350
|
1,340 sq. feet
|
1 baths 2 beds |
show details | |

|
#12
Caton Rd
Ottawa, IL 61350
|
1,258 sq. feet
|
1 baths 3 beds |
show details | |

|
#13
W Maple St
Coal City, IL 60416
|
- sq. feet
|
2 baths 3 beds |
show details | |

|
#14
W Nettle Creek Dr
Morris, IL 60450
|
2,613 sq. feet
|
2 baths 4 beds |
show details | |

|
#15
Anita Dr
Ottawa, IL 61350
|
1,344 sq. feet
|
1 baths 3 beds |
show details | |

|
#16
N Clinton St
Dwight, IL 60420
|
2,075 sq. feet
|
2 baths 3 beds |
show details | |

|
#17
S Vermillion St
Coal City, IL 60416
|
1,134 sq. feet
|
1 baths 2 beds |
show details | |

|
#18
1st Ave
Ottawa, IL 61350
|
1,152 sq. feet
|
1 baths 2 beds |
show details | |

|
#19
W Rathburn St
Coal City, IL 60416
|
- sq. feet
|
2 baths 4 beds |
show details | |

|
#20
7th Ave
Ottawa, IL 61350
|
- sq. feet
|
- baths - beds |
show details |
| Photo | Address | Area | Beds / Baths | Price | Details |
|---|---|---|---|---|---|

|
#21
Catherine St
Ottawa, IL 61350
|
- sq. feet
|
- baths - beds |
show details | |

|
#22
4th Ave
Ottawa, IL 61350
|
- sq. feet
|
- baths - beds |
show details | |

|
#23
W Fremont St
Ottawa, IL 61350
|
- sq. feet
|
- baths - beds |
show details | |

|
#24
E Benton St Apt 1
Morris, IL 60450
|
- sq. feet
|
- baths - beds |
show details | |

|
#25
E 2250th Rd
Ottawa, IL 61350
|
- sq. feet
|
- baths - beds |
show details | |

|
#26
E 2250th Rd
Ottawa, IL 61350
|
- sq. feet
|
- baths - beds |
show details | |

|
#27
Columbus St Apt 7
Ottawa, IL 61350
|
- sq. feet
|
- baths - beds |
show details | |

|
#28
N 3959th Rd
Sheridan, IL 60551
|
- sq. feet
|
- baths - beds |
show details | |

|
#29
E Stevenson Rd
Ottawa, IL 61350
|
- sq. feet
|
- baths - beds |
show details | |

|
#30
Fillmore St
Ottawa, IL 61350
|
- sq. feet
|
- baths - beds |
show details |
| Photo | Address | Area | Beds / Baths | Price | Details |
|---|---|---|---|---|---|

|
#31
E 2089th Rd
Serena, IL 60549
|
- sq. feet
|
- baths - beds |
show details | |

|
#32
1/2 Finley Cir
Grand Ridge, IL 61325
|
- sq. feet
|
- baths - beds |
show details | |

|
#33
E 2601st Rd
Sheridan, IL 60551
|
- sq. feet
|
- baths - beds |
show details | |

|
#34
E Chapin St
Morris, IL 60450
|
- sq. feet
|
- baths - beds |
show details | |

|
#35
N State Route 23
Ottawa, IL 61350
|
- sq. feet
|
- baths - beds |
show details | |

|
#36
Peart Rd
Morris, IL 60450
|
- sq. feet
|
- baths - beds |
show details | |

|
#37
E Liberty St
Newark, IL 60541
|
- sq. feet
|
- baths - beds |
show details | |

|
#38
N 41st Rd
Sheridan, IL 60551
|
- sq. feet
|
- baths - beds |
show details | |

|
#39
E 2370th Rd
Sheridan, IL 60551
|
- sq. feet
|
- baths - beds |
show details | |

|
#40
Quail Run
Coal City, IL 60416
|
- sq. feet
|
- baths - beds |
show details |
| Photo | Address | Area | Beds / Baths | Price | Details |
|---|---|---|---|---|---|

|
#41
N 42nd Rd
Sheridan, IL 60551
|
- sq. feet
|
- baths - beds |
show details | |

|
#42
E Division St
Gardner, IL 60424
|
- sq. feet
|
- baths - beds |
show details | |

|
#43
Brentwood Dr
Morris, IL 60450
|
- sq. feet
|
- baths - beds |
show details | |

|
#44
Oak St
Minooka, IL 60447
|
- sq. feet
|
- baths - beds |
show details | |

|
#45
E 24th Rd
Marseilles, IL 61341
|
- sq. feet
|
- baths - beds |
show details | |

|
#46
Liberty St
Morris, IL 60450
|
- sq. feet
|
- baths - beds |
show details | |

|
#47
Belle Aire St
Marseilles, IL 61341
|
- sq. feet
|
- baths - beds |
show details | |

|
#48
E 1919th Rd
Ottawa, IL 61350
|
- sq. feet
|
- baths - beds |
show details | |

|
#49
Liberty St # 3
Morris, IL 60450
|
- sq. feet
|
- baths - beds |
show details | |

|
Check over 1 million property listings on Foreclosure.com!
|
browse all offers | |||

Latest news about housing in Seneca, IL collected exclusively by city-data.com from local newspapers, TV, and radio stations

 | Berwyn, the most underrated suburb of Chicago (101 replies) |
| Powder Coating Shop looking for space (1 reply) |
Median year apartment built: 1986
Household type by relationship:
Households: 2,531- Male householders: 483 (76 living alone), Female householders: 451 (74 living alone)
459 spouses (457 opposite-sex spouses), 116 unmarried partners, (116 opposite-sex unmarried partners), 909 children (806 natural, 15 adopted, 86 stepchildren), 2 grandchildren, 0 brothers or sisters, 9 parents, 0 foster children, 56 other relatives, 42 non-relatives
Size of family households: 376 2-persons, 99 3-persons, 130 4-persons, 64 5-persons, 14 6-persons, 17 7-or-more-persons.
Size of nonfamily households: 156 1-person, 58 2-persons, 6 3-persons.
344 married couples with children.
293 single-parent households (45 men, 248 women).
97.1% of residents of Seneca speak English at home.
1.7% of residents speak Spanish at home (68% speak English very well, 15% speak English well, 18% speak English not well).
Foreign born population: 50 (2.0%)
(82.0% of them are naturalized citizens)
| Here: | 5.8 |
| State: | 6.4 |
| Here: | 5.4 |
| State: | 4.1 |
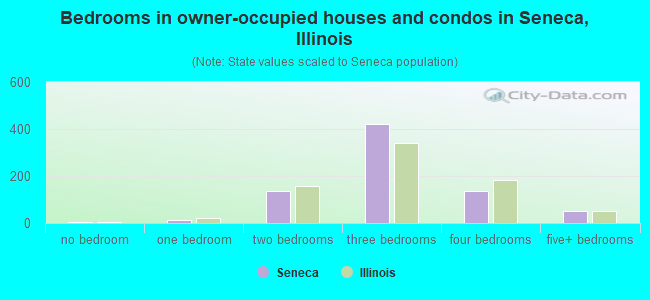
- Bedrooms in owner-occupied houses and condos in Seneca, Illinois
- 3no bedroom
- 111 bedroom
- 1362 bedrooms
- 4203 bedrooms
- 1374 bedrooms
- 535+ bedrooms
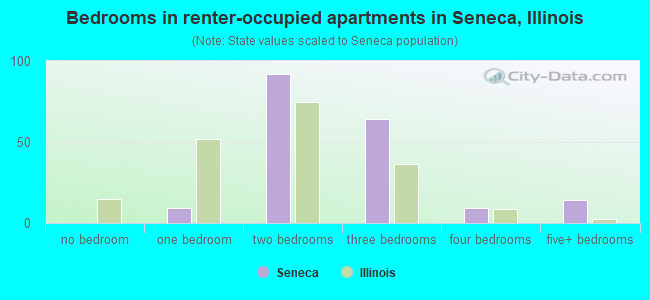
- Bedrooms in renter-occupied apartments in Seneca, Illinois
- 0no bedroom
- 91 bedroom
- 922 bedrooms
- 643 bedrooms
- 94 bedrooms
- 145+ bedrooms
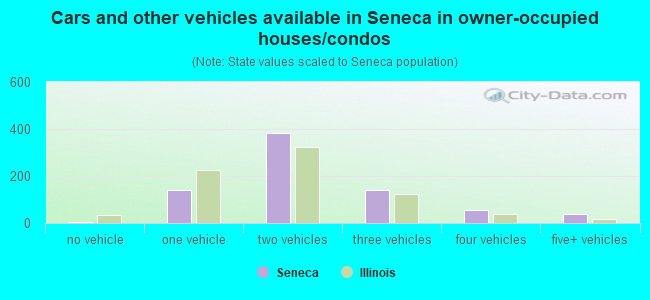
- Cars and other vehicles available in Seneca in owner-occupied houses/condos
- 4no vehicle
- 1411 vehicle
- 3812 vehicles
- 1403 vehicles
- 554 vehicles
- 395+ vehicles
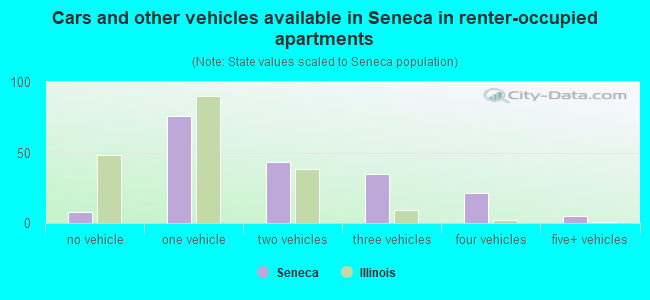
- Cars and other vehicles available in Seneca in renter-occupied apartments
- 8no vehicle
- 761 vehicle
- 432 vehicles
- 353 vehicles
- 214 vehicles
- 55+ vehicles
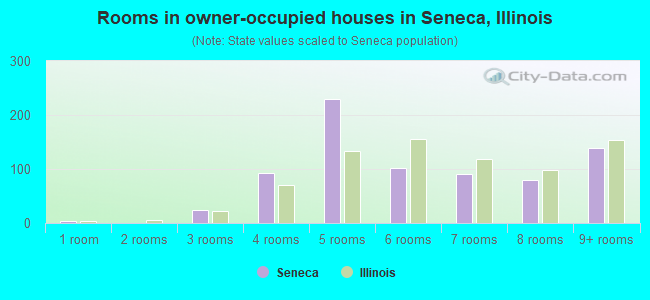
- Rooms in owner-occupied houses in Seneca, Illinois
- 31 room
- 02 rooms
- 253 rooms
- 924 rooms
- 2295 rooms
- 1016 rooms
- 917 rooms
- 798 rooms
- 1399+ rooms
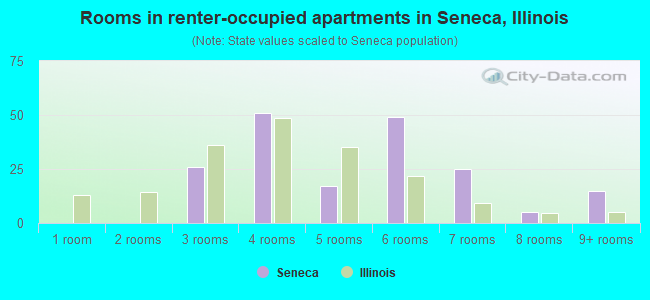
- Rooms in renter-occupied apartments in Seneca, Illinois
- 01 room
- 02 rooms
- 263 rooms
- 514 rooms
- 175 rooms
- 496 rooms
- 257 rooms
- 58 rooms
- 159+ rooms
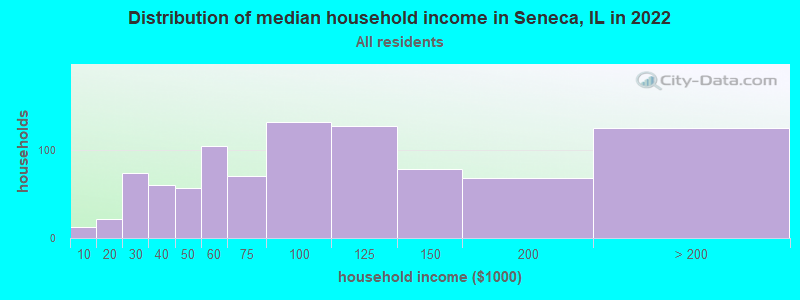
Seneca, IL household income distribution

- 13Less than $10,000
- 22$10,000 to $19,999
- 74$20,000 to $29,999
- 60$30,000 to $39,999
- 57$40,000 to $49,999
- 105$50,000 to $59,999
- 71$60,000 to $74,999
- 132$75,000 to $99,999
- 127$100,000 to $124,999
- 78$125,000 to $149,999
- 68$150,000 to $199,999
- 125$200,000 or more
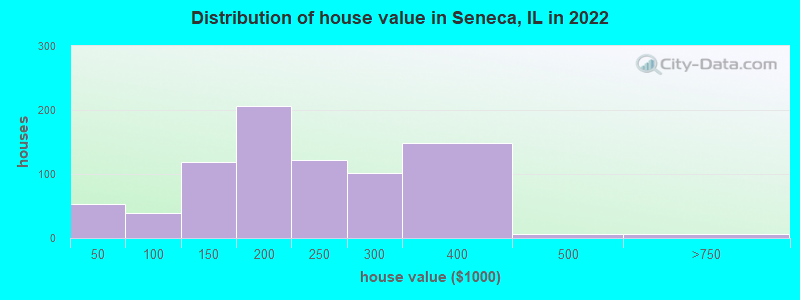
Home value of owner - occupied houses in 2022 in Seneca, IL
-
- 30Less than $10,000
- 5$20,000 to $24,999
- 16$30,000 to $34,999
- 6$50,000 to $59,999
- 3$60,000 to $69,999
- 11$70,000 to $79,999
- 11$80,000 to $89,999
- 5$90,000 to $99,999
- 31$100,000 to $124,999
- 85$125,000 to $149,999
- 119$150,000 to $174,999
- 86$175,000 to $199,999
- 121$200,000 to $249,999
- 100$250,000 to $299,999
- 149$300,000 to $399,999
- 7$400,000 to $499,999
- 6$500,000 to $749,999
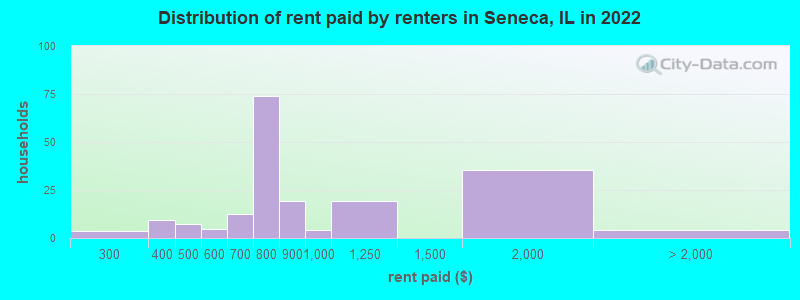
Rent paid by renters in 2022 in Seneca, IL
-
- 3$250 to $299
- 9$300 to $349
- 7$450 to $499
- 4$550 to $599
- 5$600 to $649
- 7$650 to $699
- 74$750 to $799
- 19$800 to $899
- 4$900 to $999
- 19$1,000 to $1,249
- 35$1,500 to $1,999
- 4No cash rent
Percentage of workers working in this county: 46.8%
Number of people working at home: 82 (7.3% of all workers)
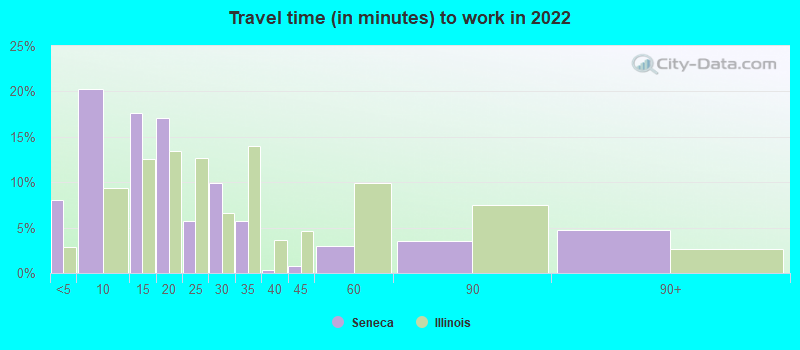
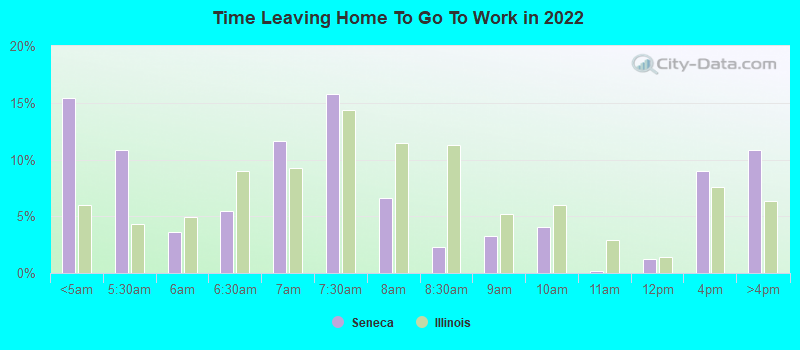
Travel time to work (commute)
- Less than 5 minutes: 35
- 5 to 9 minutes: 81
- 10 to 14 minutes: 102
- 15 to 19 minutes: 221
- 20 to 24 minutes: 218
- 25 to 29 minutes: 48
- 30 to 34 minutes: 107
- 35 to 39 minutes: 24
- 40 to 44 minutes: 16
- 45 to 59 minutes: 69
- 60 to 89 minutes: 62
- 90 or more minutes: 28
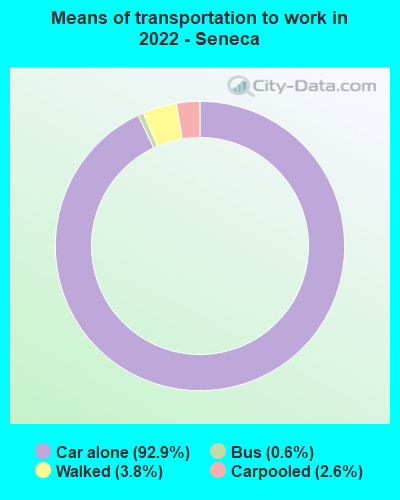
Means of transportation to work:
- Drove a car alone: 443 (83.0%)
- Carpooled: 11 (2.1%)
- Bus: 4 (0.7%)
- Walked: 14 (2.6%)
- Worked at home: 50 (9.4%)
- Unemployment by race in 2022
- Unemployment rate for White non-Hispanic residents
- 1.2%Males
- 1.9%Females
- Unemployment rate for Black residents
- 76.3%Males
- Unemployment rate for two or more race residents
- 11.1%Males
- Unemployment rate for Hispanic or Latino residents
- 23.1%Females
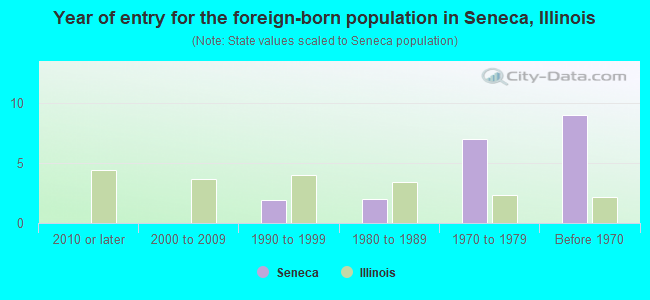
- Year of entry for the foreign-born population in Seneca, Illinois
- 02010 or later
- 02000 to 2009
- 21990 to 1999
- 21980 to 1989
- 71970 to 1979
- 9Before 1970
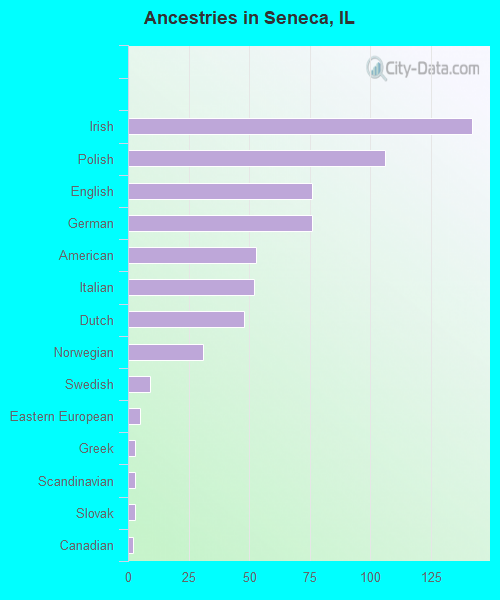
First ancestries reported:
- Irish: 142 (18.5%)
- Polish: 106 (13.8%)
- English: 76 (9.9%)
- German: 76 (9.9%)
- American: 53 (6.9%)
- Italian: 52 (6.8%)
- Dutch: 48 (6.2%)
- Norwegian: 31 (4.0%)
- Swedish: 9 (1.2%)
- Eastern European: 5 (0.7%)
- Greek: 3 (0.4%)
- Scandinavian: 3 (0.4%)
- Slovak: 3 (0.4%)
- Canadian: 2 (0.3%)
Most common places of birth for foreign-born residents (%):
| Seneca: | 85.4% (35) |
| Illinois: | 34.7% (626,958) |
| Seneca: | 14.6% (6) |
| Illinois: | 0.1% (2,291) |
Place of birth for U.S.-born residents:
- This state: 2,072
- Other state: 378
- Northeast: 39
- Midwest: 179
- South: 98
- West: 41
96.0% of Seneca residents lived in the same house 1 years ago.
Out of people who lived in different houses, 34.4% lived in this county.
Out of people who lived in different counties, 79.2% lived in Illinois.
| Seneca: | 96.0% |
| State average: | 88.3% |
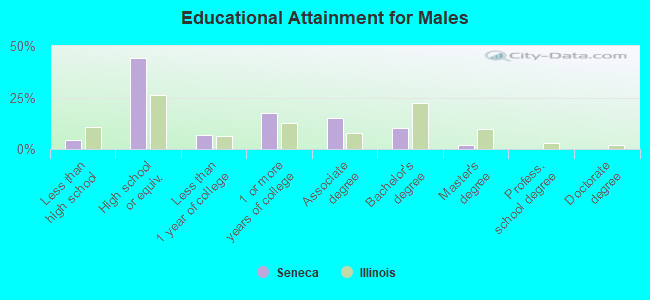
Education attainment for males 25 years and older:
- No schooling: 0
- Nursery to 4th grade: 0
- 5th and 6th grade: 0
- 7th and 8th grade: 2
- 9th grade: 0
- 10th grade: 22
- 11th grade: 5
- 12th grade, no diploma: 10
- High school graduate (or equivalency): 377
- Less than 1 year of college: 58
- Some college more than 1 year, no degree: 148
- Associate degree: 128
- Bachelor's degree: 85
- Master's degree: 16
- Professional school degree: 0
- Doctorate degree: 0
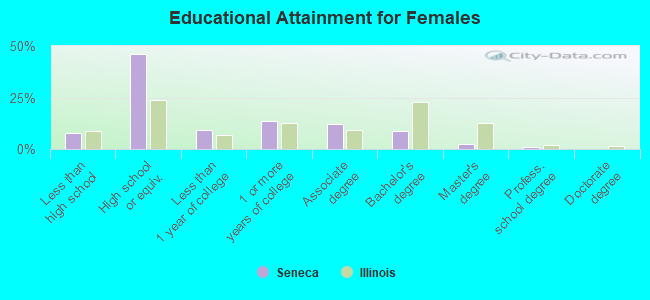
Education attainment for females 25 years and older:
- No schooling: 0
- Nursery to 4th grade: 0
- 5th and 6th grade: 0
- 7th and 8th grade: 0
- 9th grade: 0
- 10th grade: 9
- 11th grade: 0
- 12th grade, no diploma: 56
- High school graduate (or equivalency): 398
- Less than 1 year of college: 78
- Some college more than 1 year, no degree: 117
- Associate degree: 103
- Bachelor's degree: 74
- Master's degree: 19
- Professional school degree: 7
- Doctorate degree: 0
Housing units in structures:
- One, detached: 822
- One, attached: 40
- Two: 20
- 3 or 4: 33
- 5 to 9: 21
- Mobile homes: 66
Median worth of mobile homes: $12,040
Housing units lacking complete kitchen facilities in 2022: 2.9%
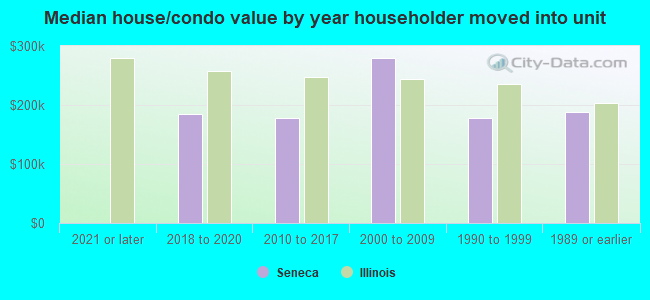
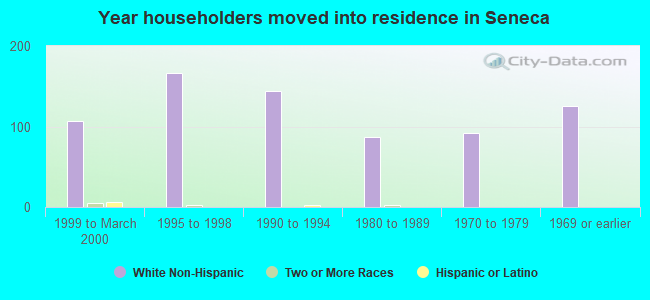
House/condo owner moved in on average 15 years ago
Renter moved in on average 1 years ago
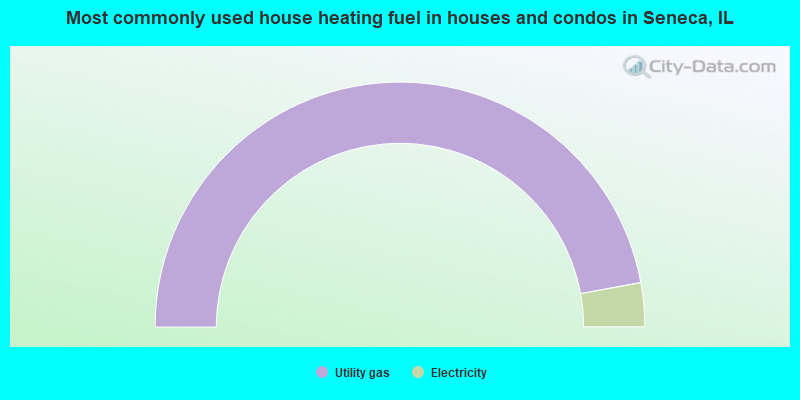
- 94.2%Utility gas
- 5.8%Electricity
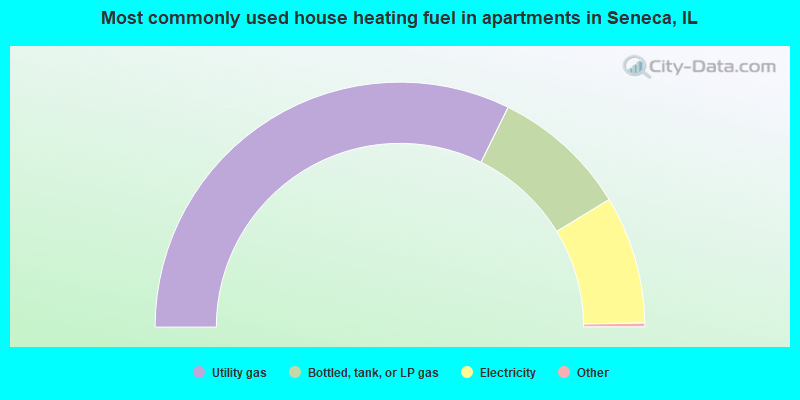
- 64.9%Utility gas
- 18.1%Bottled, tank, or LP gas
- 17.0%Electricity
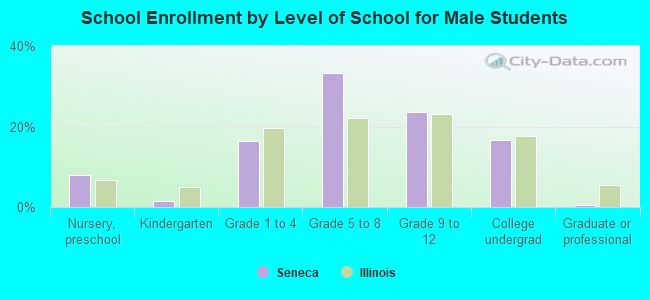
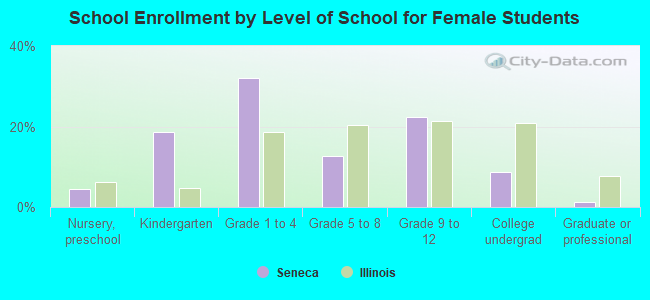
Private vs. public school enrollment:
| Here: | 5.7% |
| Illinois: | 13.3% |
| Here: | 10.8% |
| Illinois: | 9.9% |
| Here: | 21.3% |
| Illinois: | 27.4% |