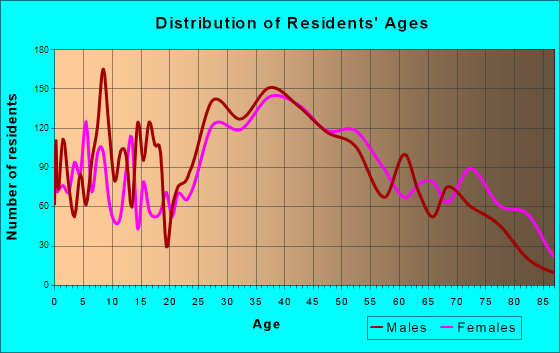
Secaucus, NJ (New Jersey) Houses and Residents
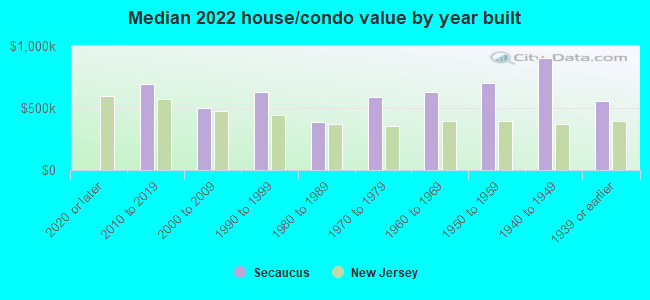
| Secaucus: | $602,823 |
| New Jersey: | $428,900 |
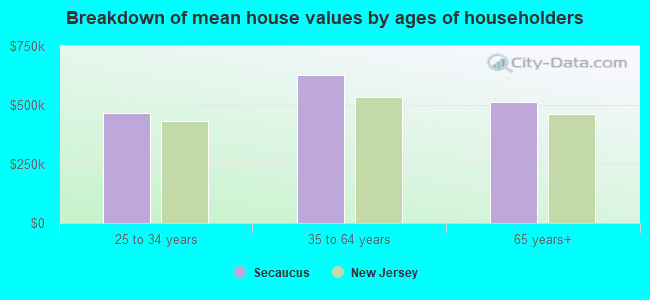
Mean price in 2022:
Detached houses: $660,009
Here: $660,009 State: $537,591 Townhouses or other attached units: $559,495
Here: $559,495 State: $381,113 In 2-unit structures: $569,394
Here: $569,394 State: $444,476 In 3-to-4-unit structures: $468,743
Here: $468,743 State: $457,463 In 5-or-more-unit structures: $369,779
Here: $369,779 State: $368,745 Mobile homes: $587,760
Here: $587,760 State: $119,788
Total population: 18,416 (Urban population: 15,839, Rural population: 0)
Houses: 9,427 (8,818 occupied: 4,586 owner occupied, 4,449 renter occupied)
| % of renters here: | 49% |
| State: | 35% |
Housing density: 1,602 houses/condos per square mile
Median price asked for vacant for-sale houses and condos in 2022: $771,077.
Median contract rent in 2022: over $2,000 (lower quartile is $1,242, upper quartile is over $2,000)
Median rent asked for vacant for-rent units in 2022: $2,195
Median gross rent in Secaucus, NJ in 2022: over $2,000
Housing units in Secaucus with a mortgage: 2,508 (243 second mortgage, 0 home equity loan, 226 both second mortgage and home equity loan)
Houses without a mortgage: 119
Median household income for houses/condos with a mortgage: $187,042
Median household income for apartments without a mortgage: $99,267
Median monthly housing costs: $2,078
Compare current foreclosures in Secaucus, NJ:
| Photo | Address | Area | Beds / Baths | Price | Details |
|---|---|---|---|---|---|

|
#1
Harmon Cove Tower # 3
Secaucus, NJ 07094
|
3,210 sq. feet
|
4 baths 4 beds |
show details | |

|
#2
Riverview Ct # 901
Secaucus, NJ 07094
|
1,104 sq. feet
|
- baths 2 beds |
show details | |

|
#3
Riverview Ct
Secaucus, NJ 07094
|
1,104 sq. feet
|
- baths 2 beds |
show details | |

|
#4
Farm Rd # 1
Secaucus, NJ 07094
|
1,624 sq. feet
|
- baths - beds |
show details | |

|
#5
Chestnut Pl
Secaucus, NJ 07094
|
2,596 sq. feet
|
- baths - beds |
show details | |

|
#6
Harmon Cove Tower
Secaucus, NJ 07094
|
1,504 sq. feet
|
- baths - beds |
show details | |

|
#7
Schopmann Dr
Secaucus, NJ 07094
|
- sq. feet
|
- baths - beds |
show details | |

|
#8
Plaza Dr
Secaucus, NJ 07094
|
- sq. feet
|
- baths - beds |
show details | |

|
#9
Harmon Cove Tower
Secaucus, NJ 07094
|
687 sq. feet
|
- baths - beds |
show details | |

|
#10
Millridge Rd
Secaucus, NJ 07094
|
- sq. feet
|
- baths - beds |
show details |
| Photo | Address | Area | Beds / Baths | Price | Details |
|---|---|---|---|---|---|

|
#11
Harmon Cove Tower # 207
Secaucus, NJ 07094
|
1,686 sq. feet
|
- baths - beds |
show details | |

|
#12
Harmon Cove Tower
Secaucus, NJ 07094
|
1,793 sq. feet
|
- baths - beds |
show details | |

|
#13
Topsail Ln
Secaucus, NJ 07094
|
- sq. feet
|
- baths - beds |
show details | |

|
#14
10th St, Units 1 & 6
Secaucus, NJ 07094
|
- sq. feet
|
- baths - beds |
show details | |

|
#15
Farm R 1
Secaucus, NJ 07094
|
- sq. feet
|
- baths - beds |
show details | |

|
#16
Harmon Plz Fl 9
Secaucus, NJ 07094
|
- sq. feet
|
- baths - beds |
show details | |

|
#17
Fairview Ave
Secaucus, NJ 07094
|
1,296 sq. feet
|
- baths - beds |
show details | |

|
#18
Harmon Cove Towers, Unit 207
Secaucus, NJ 07094
|
1,686 sq. feet
|
- baths - beds |
show details | |

|
#19
Irving Pl
Secaucus, NJ 07094
|
- sq. feet
|
- baths - beds |
show details | |

|
#20
Farm Rd
Secaucus, NJ 07094
|
1,624 sq. feet
|
- baths - beds |
show details |
| Photo | Address | Area | Beds / Baths | Price | Details |
|---|---|---|---|---|---|

|
#21
5th St
Secaucus, NJ 07094
|
1,139 sq. feet
|
- baths - beds |
show details | |

|
#22
Harmon Cove Towers, Condo 129
Secaucus, NJ 07094
|
1,793 sq. feet
|
- baths - beds |
show details | |

|
#23
Harmon Cove Tower
Secaucus, NJ 07094
|
- sq. feet
|
- baths - beds |
show details | |

|
#24
Farm Rd
Secaucus, NJ 07094
|
1,584 sq. feet
|
- baths - beds |
show details | |

|
#25
Chestnut Pl
Secaucus, NJ 07094
|
3,072 sq. feet
|
- baths - beds |
show details | |

|
#26
Harmon Cove Tower
Secaucus, NJ 07094
|
1,379 sq. feet
|
- baths - beds |
show details | |

|
#27
Acorn Rd
Secaucus, NJ 07094
|
3,752 sq. feet
|
- baths - beds |
show details | |

|
#28
Weigands Ln
Secaucus, NJ 07094
|
1,903 sq. feet
|
- baths - beds |
show details | |

|
#29
Park Plaza Dr # 3106
Secaucus, NJ 07094
|
- sq. feet
|
- baths - beds |
show details | |

|
#30
Marianne Ter
Secaucus, NJ 07094
|
1,414 sq. feet
|
- baths - beds |
show details |
| Photo | Address | Area | Beds / Baths | Price | Details |
|---|---|---|---|---|---|

|
#31
County Ave Apt 902
Secaucus, NJ 07094
|
- sq. feet
|
- baths - beds |
show details | |

|
Check over 1 million property listings on Foreclosure.com!
|
browse all offers | |||

Latest news about housing in Secaucus, NJ collected exclusively by city-data.com from local newspapers, TV, and radio stations

 | About Riverside Court Townhouses Secaucus (0 replies) |
| Need a suggestion on good apartments in Jersey City or Secaucus (27 replies) |
| Looking for an area to buy my first home (5 replies) |
| Pre/Post Covid commute time estimated Hunterdon to Secaucus (6 replies) |
| Secaucus - Residential Parking Question (0 replies) |
| Secaucus Harmon Cove/Harmon Cove IV (0 replies) |
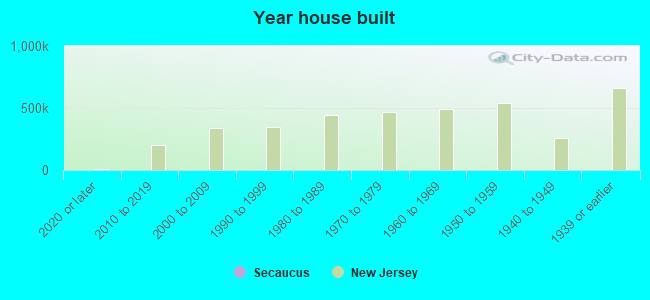
Median year apartment built: 2003
Household type by relationship:
Households: 21,208- Male householders: 5,385 (1,025 living alone), Female householders: 3,116 (1,259 living alone)
4,468 spouses (4,415 opposite-sex spouses), 487 unmarried partners, (487 opposite-sex unmarried partners), 5,084 children (4,955 natural, 64 adopted, 64 stepchildren), 187 grandchildren, 311 brothers or sisters, 784 parents, 0 foster children, 260 other relatives, 451 non-relatives
- In group quarters: 669
Size of family households: 2,469 2-persons, 1,404 3-persons, 1,339 4-persons, 169 5-persons, 166 6-persons, 62 7-or-more-persons.
Size of nonfamily households: 2,658 1-person, 500 2-persons, 102 3-persons.
3,015 married couples with children.
620 single-parent households (483 men, 137 women).
48.7% of residents of Secaucus speak English at home.
15.2% of residents speak Spanish at home (66% speak English very well, 12% speak English well, 13% speak English not well, 9% don't speak English at all).
22.0% of residents speak other Indo-European language at home (83% speak English very well, 9% speak English well, 6% speak English not well, 1% don't speak English at all).
11.3% of residents speak Asian or Pacific Island language at home (72% speak English very well, 21% speak English well, 6% speak English not well).
2.1% of residents speak other language at home (12% speak English very well, 60% speak English well, 28% speak English not well).
Foreign born population: 9,233 (43.5%)
(51.6% of them are naturalized citizens)
| Here: | 5.5 |
| State: | 6.8 |
| Here: | 3.2 |
| State: | 3.9 |
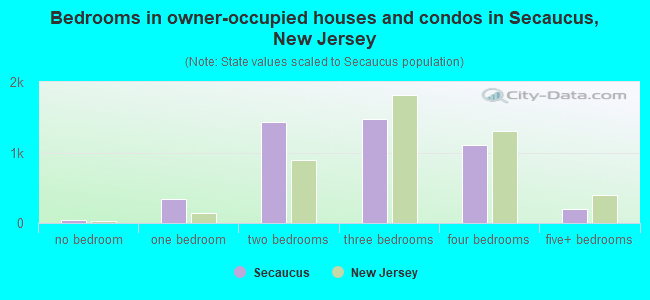
- Bedrooms in owner-occupied houses and condos in Secaucus, New Jersey
- 38no bedroom
- 3401 bedroom
- 1,4312 bedrooms
- 1,4783 bedrooms
- 1,1004 bedrooms
- 1995+ bedrooms
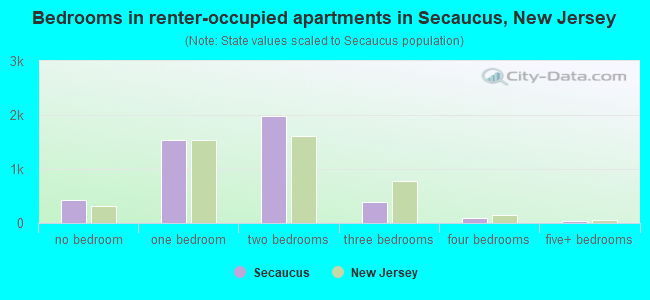
- Bedrooms in renter-occupied apartments in Secaucus, New Jersey
- 433no bedroom
- 1,5431 bedroom
- 1,9782 bedrooms
- 3813 bedrooms
- 864 bedrooms
- 285+ bedrooms
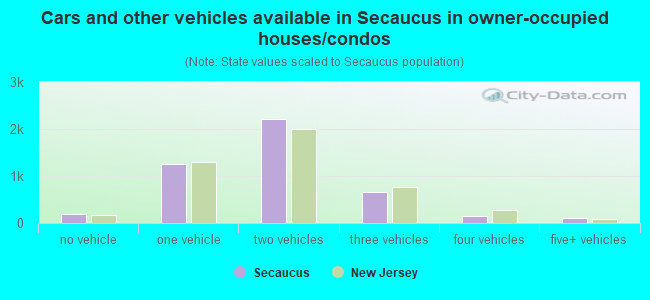
- Cars and other vehicles available in Secaucus in owner-occupied houses/condos
- 198no vehicle
- 1,2571 vehicle
- 2,2112 vehicles
- 6673 vehicles
- 1444 vehicles
- 1105+ vehicles
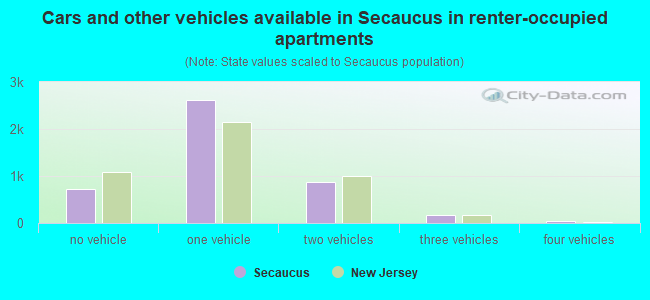
- Cars and other vehicles available in Secaucus in renter-occupied apartments
- 730no vehicle
- 2,6191 vehicle
- 8762 vehicles
- 1753 vehicles
- 494 vehicles
- 05+ vehicles
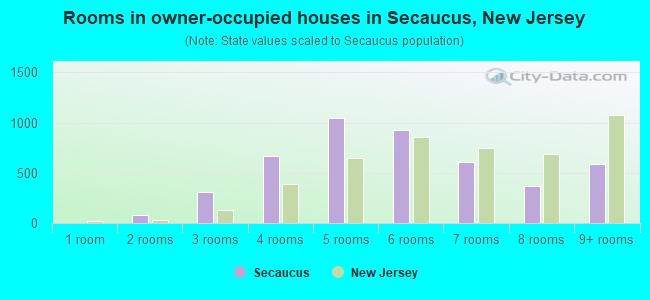
- Rooms in owner-occupied houses in Secaucus, New Jersey
- 01 room
- 752 rooms
- 3043 rooms
- 6704 rooms
- 1,0475 rooms
- 9316 rooms
- 6107 rooms
- 3648 rooms
- 5869+ rooms
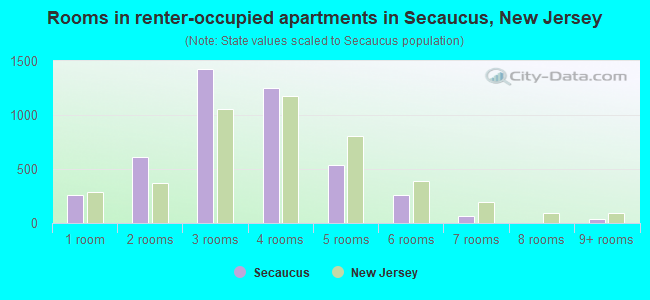
- Rooms in renter-occupied apartments in Secaucus, New Jersey
- 2591 room
- 6132 rooms
- 1,4263 rooms
- 1,2474 rooms
- 5345 rooms
- 2616 rooms
- 697 rooms
- 08 rooms
- 399+ rooms
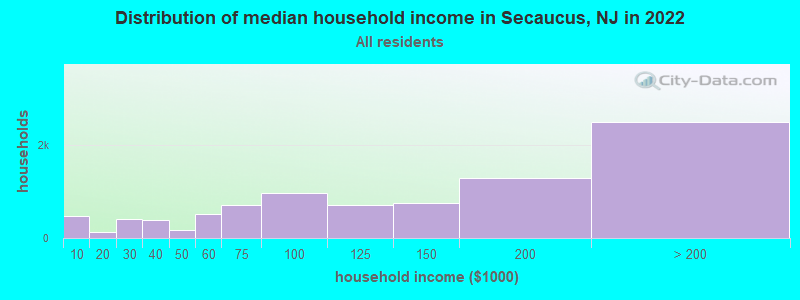
Secaucus, NJ household income distribution

- 470Less than $10,000
- 134$10,000 to $19,999
- 410$20,000 to $29,999
- 391$30,000 to $39,999
- 161$40,000 to $49,999
- 519$50,000 to $59,999
- 713$60,000 to $74,999
- 965$75,000 to $99,999
- 714$100,000 to $124,999
- 739$125,000 to $149,999
- 1,289$150,000 to $199,999
- 2,483$200,000 or more
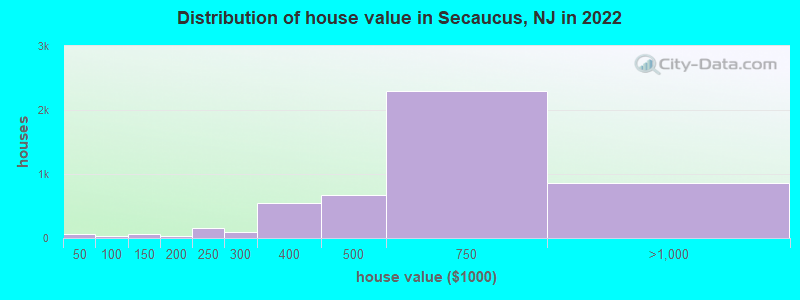
Home value of owner - occupied houses in 2022 in Secaucus, NJ
-
- 24Less than $10,000
- 13$30,000 to $34,999
- 24$35,000 to $39,999
- 26$70,000 to $79,999
- 33$100,000 to $124,999
- 24$125,000 to $149,999
- 20$150,000 to $174,999
- 17$175,000 to $199,999
- 161$200,000 to $249,999
- 94$250,000 to $299,999
- 547$300,000 to $399,999
- 674$400,000 to $499,999
- 2,298$500,000 to $749,999
- 819$750,000 to $999,999
- 14$1,000,000 to $1,499,999
- 20$2,000,000 or more
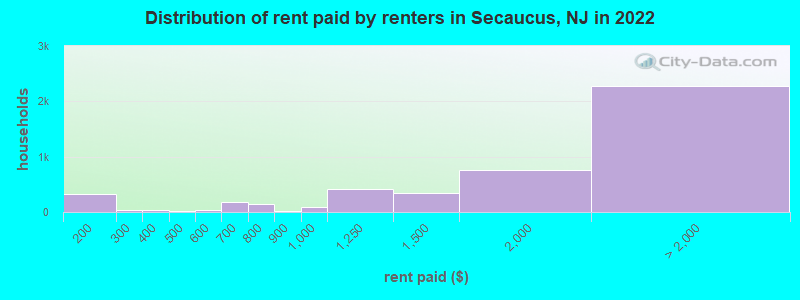
Rent paid by renters in 2022 in Secaucus, NJ
-
- 317$150 to $199
- 32$250 to $299
- 29$350 to $399
- 22$400 to $449
- 38$500 to $549
- 4$550 to $599
- 174$600 to $649
- 80$700 to $749
- 67$750 to $799
- 16$800 to $899
- 90$900 to $999
- 420$1,000 to $1,249
- 342$1,250 to $1,499
- 763$1,500 to $1,999
- 922$2,000 to $2,499
- 732$2,500 to $2,999
- 556$3,000 to $3,499
- 70$3,500 or more
Percentage of workers working in this county: 55.6%
Number of people working at home: 3,057 (27.3% of all workers)
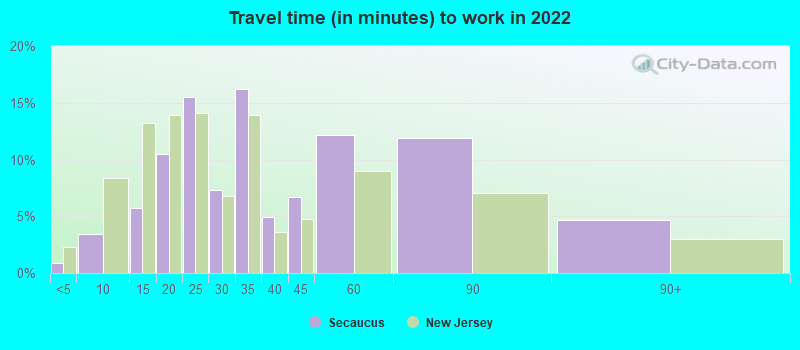
Travel time to work (commute)
- Less than 5 minutes: 177
- 5 to 9 minutes: 695
- 10 to 14 minutes: 721
- 15 to 19 minutes: 706
- 20 to 24 minutes: 960
- 25 to 29 minutes: 105
- 30 to 34 minutes: 1,001
- 35 to 39 minutes: 441
- 40 to 44 minutes: 796
- 45 to 59 minutes: 1,417
- 60 to 89 minutes: 1,044
- 90 or more minutes: 258
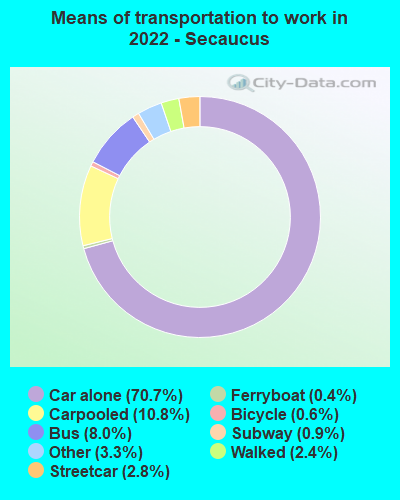
Means of transportation to work:
- Drove a car alone: 22,703 (61.8%)
- Carpooled: 3,649 (9.9%)
- Bus: 2,570 (7.0%)
- Subway or elevated rail: 795 (2.2%)
- Long-distance train or commuter rail: 209 (0.6%)
- Light rail, streetcar or trolley: 30 (0.1%)
- Ferryboat: 92 (0.3%)
- Taxi: 1,238 (3.4%)
- Bicycle: 154 (0.4%)
- Walked: 793 (2.2%)
- Worked at home: 3,057 (8.3%)
- Unemployment by race in 2022
- Unemployment rate for White non-Hispanic residents
- 5.1%Males
- 6.3%Females
- Unemployment rate for Black residents
- 1.0%Males
- 10.0%Females
- Unemployment rate for Asian residents
- 2.2%Males
- 1.9%Females
- Unemployment rate for other race residents
- 25.1%Males
- 3.6%Females
- Unemployment rate for two or more race residents
- 8.5%Males
- 0.1%Females
- Unemployment rate for Hispanic or Latino residents
- 16.2%Males
- 1.9%Females
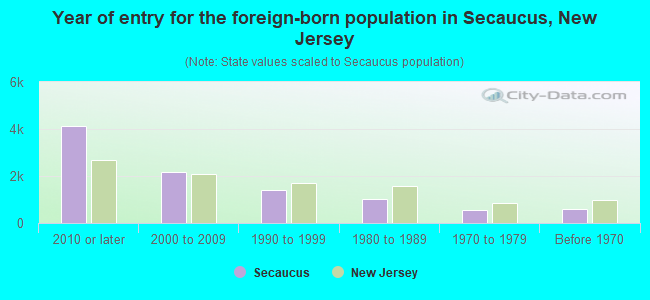
- Year of entry for the foreign-born population in Secaucus, New Jersey
- 4,1242010 or later
- 2,1662000 to 2009
- 1,4131990 to 1999
- 1,0171980 to 1989
- 5661970 to 1979
- 597Before 1970
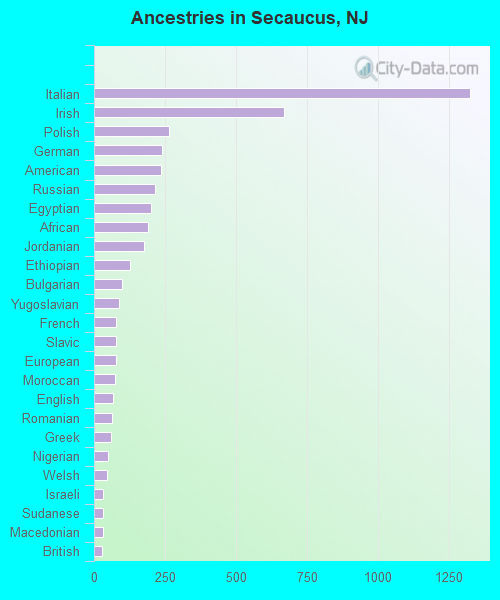
First ancestries reported:
- Italian: 1,326 (9.7%)
- Irish: 669 (4.9%)
- Polish: 263 (1.9%)
- German: 240 (1.7%)
- American: 236 (1.7%)
- Russian: 216 (1.6%)
- Egyptian: 200 (1.5%)
- African: 191 (1.4%)
- Jordanian: 176 (1.3%)
- Ethiopian: 127 (0.9%)
- Bulgarian: 98 (0.7%)
- Yugoslavian: 87 (0.6%)
- French: 78 (0.6%)
- Slavic: 78 (0.6%)
- European: 78 (0.6%)
- Moroccan: 73 (0.5%)
- English: 66 (0.5%)
- Romanian: 63 (0.5%)
- Greek: 59 (0.4%)
- Nigerian: 48 (0.3%)
- Welsh: 46 (0.3%)
- Israeli: 33 (0.2%)
- Sudanese: 31 (0.2%)
- Macedonian: 30 (0.2%)
- British: 27 (0.2%)
- Eastern European: 27 (0.2%)
- Trinidadian and Tobagonian: 26 (0.2%)
- Albanian: 25 (0.2%)
- Syrian: 21 (0.2%)
- Iranian: 21 (0.2%)
- Portuguese: 17 (0.1%)
- Palestinian: 13 (0.09%)
- Jamaican: 8 (0.06%)
- Arab: 6 (0.04%)
- Scotch-Irish: 5 (0.04%)
Most common places of birth for foreign-born residents (%):
| Secaucus: | 36.2% (3,523) |
| New Jersey: | 12.8% (274,609) |
| Secaucus: | 6.3% (614) |
| New Jersey: | 3.7% (78,969) |
| Secaucus: | 5.7% (554) |
| New Jersey: | 4.4% (95,275) |
| Secaucus: | 5.0% (482) |
| New Jersey: | 4.0% (85,934) |
| Secaucus: | 4.1% (396) |
| New Jersey: | 9.7% (209,055) |
| Secaucus: | 3.6% (347) |
| New Jersey: | 4.2% (90,817) |
| Secaucus: | 2.6% (257) |
| New Jersey: | 2.1% (45,435) |
| Secaucus: | 2.3% (222) |
| New Jersey: | 0.6% (12,793) |
| Secaucus: | 1.9% (183) |
| New Jersey: | 1.5% (33,198) |
| Secaucus: | 1.8% (176) |
| New Jersey: | 4.8% (102,527) |
| Secaucus: | 1.8% (174) |
| New Jersey: | 0.1% (3,124) |
| Secaucus: | 1.8% (171) |
| New Jersey: | 3.3% (70,512) |
| Secaucus: | 1.7% (161) |
| New Jersey: | 2.7% (58,563) |
| Secaucus: | 1.6% (158) |
| New Jersey: | 0.2% (3,249) |
| Secaucus: | 1.5% (148) |
| New Jersey: | 1.3% (27,580) |
Place of birth for U.S.-born residents:
- This state: 8,423
- Other state: 3,179
- Northeast: 2,392
- Midwest: 310
- South: 236
- West: 226
87.5% of Secaucus residents lived in the same house 1 years ago.
Out of people who lived in different houses, 25.3% lived in this county.
Out of people who lived in different counties, 67.6% lived in New Jersey.
| Secaucus: | 87.5% |
| State average: | 90.4% |
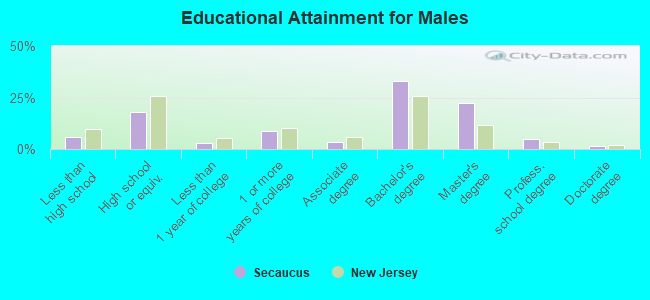
Education attainment for males 25 years and older:
- No schooling: 101
- Nursery to 4th grade: 24
- 5th and 6th grade: 30
- 7th and 8th grade: 43
- 9th grade: 16
- 10th grade: 66
- 11th grade: 87
- 12th grade, no diploma: 79
- High school graduate (or equivalency): 1,423
- Less than 1 year of college: 250
- Some college more than 1 year, no degree: 684
- Associate degree: 282
- Bachelor's degree: 2,616
- Master's degree: 1,773
- Professional school degree: 399
- Doctorate degree: 111
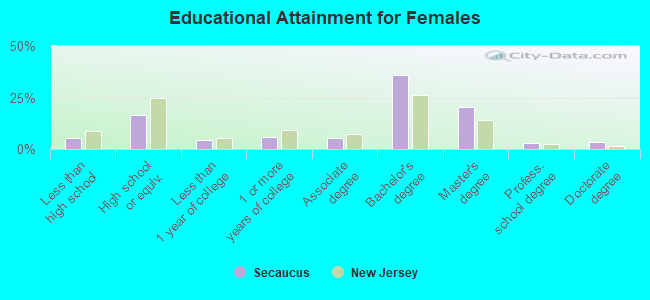
Education attainment for females 25 years and older:
- No schooling: 110
- Nursery to 4th grade: 17
- 5th and 6th grade: 60
- 7th and 8th grade: 13
- 9th grade: 31
- 10th grade: 11
- 11th grade: 82
- 12th grade, no diploma: 109
- High school graduate (or equivalency): 1,396
- Less than 1 year of college: 361
- Some college more than 1 year, no degree: 492
- Associate degree: 464
- Bachelor's degree: 2,982
- Master's degree: 1,689
- Professional school degree: 232
- Doctorate degree: 298
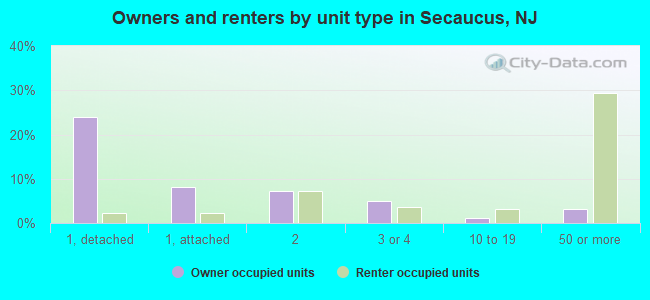
Housing units in structures:
- One, detached: 2,449
- One, attached: 805
- Two: 1,525
- 3 or 4: 727
- 5 to 9: 163
- 10 to 19: 361
- 20 to 49: 275
- 50 or more: 3,028
- Mobile homes: 90
Housing units lacking complete kitchen facilities in 2022: 0.5%
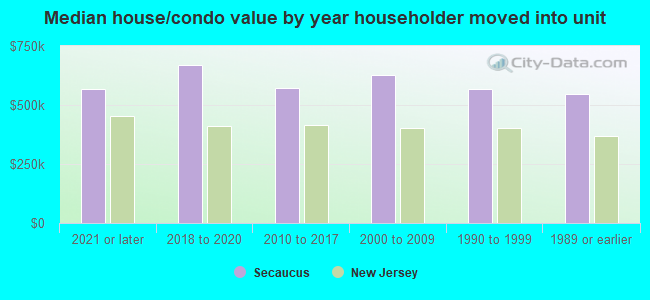
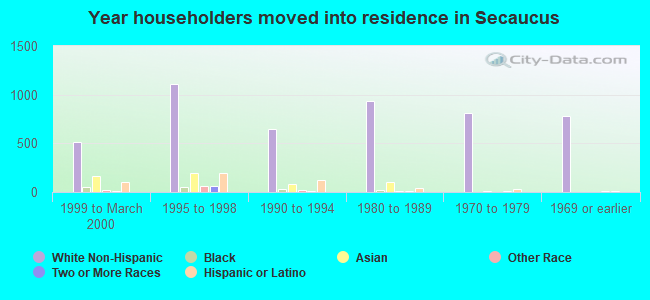
House/condo owner moved in on average 16 years ago
Renter moved in on average 3 years ago
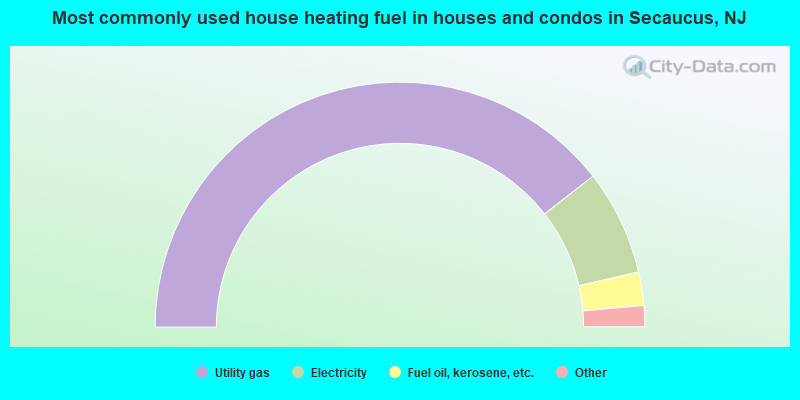
- 78.9%Utility gas
- 13.9%Electricity
- 4.4%Fuel oil, kerosene, etc.
- 1.6%Bottled, tank, or LP gas
- 1.0%No fuel used
- 0.2%Solar energy
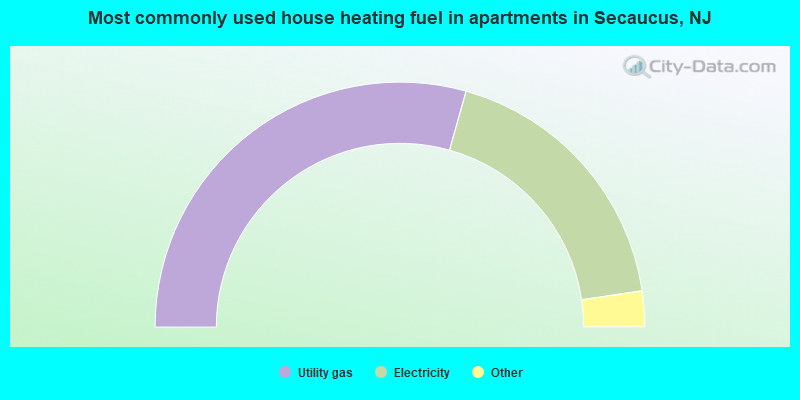
- 58.7%Utility gas
- 36.6%Electricity
- 2.2%No fuel used
- 1.7%Bottled, tank, or LP gas
- 0.8%Fuel oil, kerosene, etc.
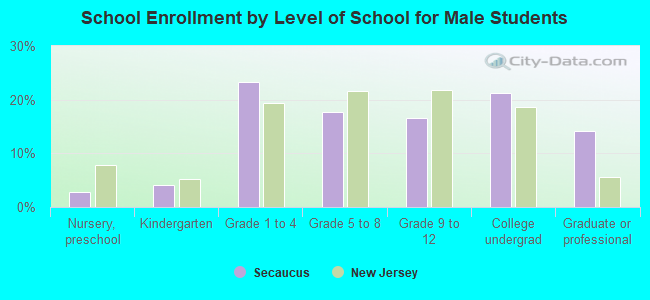
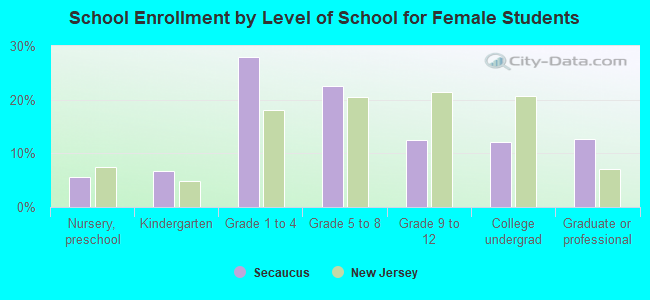
Private vs. public school enrollment:
| Here: | 8.9% |
| New Jersey: | 12.3% |
| Here: | 4.0% |
| New Jersey: | 13.1% |
| Here: | 37.6% |
| New Jersey: | 33.2% |