Seal Beach, CA (California) Houses and Residents
| Seal Beach: | $526,769 |
| California: | $715,900 |
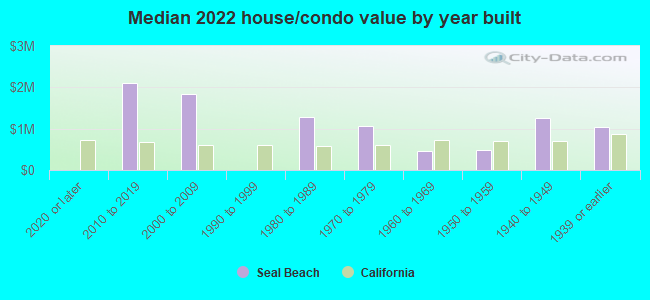
Mean price in 2022:
Detached houses: $1,498,876
Here: $1,498,876 State: $988,808 Townhouses or other attached units: $425,778
Here: $425,778 State: $838,546 In 2-unit structures: $932,294
Here: $932,294 State: $1,138,100 In 3-to-4-unit structures: $1,520,912
Here: $1,520,912 State: $824,253 In 5-or-more-unit structures: $363,477
Here: $363,477 State: $730,996 Mobile homes: $225,560
Here: $225,560 State: $184,506
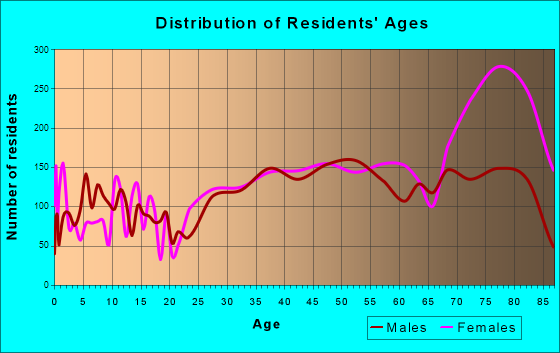
Total population: 24,662 (Urban population: 24,283, Rural population: 0)
Houses: 14,867 (13,386 occupied: 10,234 owner occupied, 3,202 renter occupied)
| % of renters here: | 24% |
| State: | 44% |
Housing density: 1,292 houses/condos per square mile
Median price asked for vacant for-sale houses and condos in 2022: $603,146.
Median contract rent in 2022: over $2,000 (lower quartile is $1,749, upper quartile is over $2,000)
Median rent asked for vacant for-rent units in 2022: $3,287
Median gross rent in Seal Beach, CA in 2022: over $2,000
Housing units in Seal Beach with a mortgage: 3,169 (364 second mortgage, 0 home equity loan, 344 both second mortgage and home equity loan)
Houses without a mortgage: 180
Median household income for houses/condos with a mortgage: $173,845
Median household income for apartments without a mortgage: $51,613
Median monthly housing costs: $1,122
Compare current foreclosures near Seal Beach, CA:
| Photo | Address | Area | Beds / Baths | Price | Details |
|---|---|---|---|---|---|

|
#1
8th St
Seal Beach, CA 90740
|
- sq. feet
|
3 baths 3 beds |
show details | |

|
#2
Birchwood Ave
Seal Beach, CA 90740
|
2,538 sq. feet
|
3 baths 4 beds |
show details | |

|
#3
Montecito Rd Apt K203
Seal Beach, CA 90740
|
- sq. feet
|
- baths - beds |
show details | |

|
#4
1st St Apt G318
Seal Beach, CA 90740
|
- sq. feet
|
- baths - beds |
show details | |

|
#5
Canoe Brook Dr Apt 5g
Seal Beach, CA 90740
|
- sq. feet
|
- baths - beds |
show details | |

|
#6
Westminster Ave Unit 2691
Seal Beach, CA 90740
|
- sq. feet
|
- baths - beds |
show details | |

|
#7
Pacific Coast Hwy Ste D
Seal Beach, CA 90740
|
- sq. feet
|
- baths - beds |
show details | |

|
#8
El Dorado Dr Apt 187j
Seal Beach, CA 90740
|
- sq. feet
|
- baths - beds |
show details | |

|
#9
7th St # 6
Seal Beach, CA 90740
|
- sq. feet
|
- baths - beds |
show details | |

|
#10
Knollwood Rd
Seal Beach, CA 90740
|
- sq. feet
|
- baths - beds |
show details |
| Photo | Address | Area | Beds / Baths | Price | Details |
|---|---|---|---|---|---|

|
#11
Hawkstone Ave
Whittier, CA 90605
|
1,444 sq. feet
|
2 baths 4 beds |
$649,900
|
show details |

|
#12
Heron Cir
Seal Beach, CA 90740
|
- sq. feet
|
- baths - beds |
show details | |

|
#13
Starburst Ct # 8
Newport Beach, CA 92663
|
1,157 sq. feet
|
2 baths 2 beds |
show details | |

|
#14
Elburg St Unit A
Paramount, CA 90723
|
1,131 sq. feet
|
2 baths 3 beds |
show details | |

|
#15
W Arbor St # 57
Long Beach, CA 90805
|
1,585 sq. feet
|
2 baths 3 beds |
show details | |

|
#16
E Jackson Ave Unit C
Anaheim, CA 92806
|
1,266 sq. feet
|
2 baths 3 beds |
show details | |

|
#17
Redondo Avenue, Units 5-8
Long Beach, CA 90804
|
3,360 sq. feet
|
4 baths 8 beds |
show details | |

|
#18
Norwalk Blvd Apt
Hawaiian Gardens, CA 90716
|
800 sq. feet
|
2 baths 1 beds |
show details | |

|
#19
N Adelon Ln
Compton, CA 90221
|
1,900 sq. feet
|
3 baths 3 beds |
show details | |

|
#20
Frampton Ave Apt A
Harbor City, CA 90710
|
1,161 sq. feet
|
3 baths 3 beds |
show details |
| Photo | Address | Area | Beds / Baths | Price | Details |
|---|---|---|---|---|---|

|
#21
E 113th St
Los Angeles, CA 90059
|
1,085 sq. feet
|
1 baths 3 beds |
show details | |

|
#22
Rincon Dr
Whittier, CA 90606
|
1,002 sq. feet
|
1 baths 3 beds |
show details | |

|
#23
Devonwood Ave
Garden Grove, CA 92841
|
1,238 sq. feet
|
2 baths 3 beds |
show details | |

|
#24
Ponderosa St
Fountain Valley, CA 92708
|
2,108 sq. feet
|
3 baths 5 beds |
show details | |

|
#25
E Keynote St
Long Beach, CA 90808
|
1,064 sq. feet
|
1 baths 2 beds |
show details | |

|
#26
Claretta Ave
Lakewood, CA 90715
|
1,074 sq. feet
|
1 baths 3 beds |
show details | |

|
#27
S Hilda St
Anaheim, CA 92806
|
1,853 sq. feet
|
4 baths 4 beds |
show details | |

|
#28
E 7th St
Long Beach, CA 90813
|
2,456 sq. feet
|
4 baths 6 beds |
show details | |

|
#29
S Hilda St
Anaheim, CA 92806
|
1,820 sq. feet
|
2 baths 4 beds |
show details | |

|
#30
Mossford Dr
Huntington Beach, CA 92646
|
1,540 sq. feet
|
2 baths 4 beds |
show details |
| Photo | Address | Area | Beds / Baths | Price | Details |
|---|---|---|---|---|---|

|
#31
E Turin Ave
Anaheim, CA 92805
|
1,436 sq. feet
|
2 baths 3 beds |
show details | |

|
#32
S Bentley Ave
Compton, CA 90220
|
1,738 sq. feet
|
2 baths 4 beds |
show details | |

|
#33
W 168th Pl
Gardena, CA 90247
|
1,400 sq. feet
|
2 baths 4 beds |
show details | |

|
#34
S Broadacres Ave
Compton, CA 90220
|
2,234 sq. feet
|
2 baths 5 beds |
show details | |

|
#35
Mitchell Ave Apt 51
Tustin, CA 92780
|
1,208 sq. feet
|
2 baths 3 beds |
show details | |

|
#36
Cliff Dr
Newport Beach, CA 92663
|
5,630 sq. feet
|
7 baths 6 beds |
show details | |

|
#37
Calendula Ave
Fountain Valley, CA 92708
|
1,615 sq. feet
|
2 baths 4 beds |
show details | |

|
#38
Cecil Pl
Costa Mesa, CA 92627
|
2,104 sq. feet
|
2 baths 3 beds |
show details | |

|
#39
Faust Ave
Long Beach, CA 90808
|
1,434 sq. feet
|
2 baths 3 beds |
show details | |

|
#40
E 92nd St
Los Angeles, CA 90002
|
2,290 sq. feet
|
2 baths 4 beds |
show details |
| Photo | Address | Area | Beds / Baths | Price | Details |
|---|---|---|---|---|---|

|
#41
S Milton St
Anaheim, CA 92806
|
2,123 sq. feet
|
1 baths 2 beds |
show details | |

|
#42
Fanwood Dr
Huntington Beach, CA 92649
|
2,336 sq. feet
|
2 baths 3 beds |
show details | |

|
#43
Simon St
Fullerton, CA 92833
|
3,202 sq. feet
|
2 baths 5 beds |
show details | |

|
#44
Cuesta Dr
Cerritos, CA 90703
|
808 sq. feet
|
1 baths 2 beds |
show details | |

|
#45
Lemoran Ave
Pico Rivera, CA 90660
|
1,633 sq. feet
|
2 baths 3 beds |
show details | |

|
#46
Spry St
Norwalk, CA 90650
|
1,142 sq. feet
|
1 baths 3 beds |
show details | |

|
#47
Walnut Ave
Long Beach, CA 90807
|
1,912 sq. feet
|
3 baths 2 beds |
show details | |

|
#48
Dinwiddie St
Downey, CA 90241
|
2,152 sq. feet
|
3 baths 4 beds |
show details | |

|
#49
Tulare Dr
Costa Mesa, CA 92626
|
2,400 sq. feet
|
4 baths 4 beds |
show details | |

|
Check over 1 million property listings on Foreclosure.com!
|
browse all offers | |||


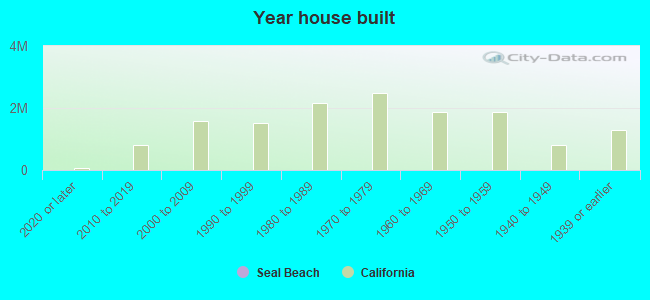
Median year apartment built: 1969
Household type by relationship:
Households: 24,856- Male householders: 5,927 (1,854 living alone), Female householders: 7,175 (4,577 living alone)
5,072 spouses (5,048 opposite-sex spouses), 274 unmarried partners, (274 opposite-sex unmarried partners), 4,497 children (4,364 natural, 65 adopted, 67 stepchildren), 390 grandchildren, 140 brothers or sisters, 202 parents, 0 foster children, 265 other relatives, 601 non-relatives
- In group quarters: 307
Size of family households: 3,962 2-persons, 898 3-persons, 748 4-persons, 534 5-persons, 46 6-persons.
Size of nonfamily households: 6,699 1-person, 633 2-persons, 31 3-persons, 7 4-persons.
2,221 married couples with children.
547 single-parent households (165 men, 382 women).
80.4% of residents of Seal Beach speak English at home.
6.6% of residents speak Spanish at home (67% speak English very well, 25% speak English well, 7% speak English not well).
4.0% of residents speak other Indo-European language at home (72% speak English very well, 14% speak English well, 12% speak English not well, 2% don't speak English at all).
8.6% of residents speak Asian or Pacific Island language at home (33% speak English very well, 31% speak English well, 35% speak English not well, 2% don't speak English at all).
0.8% of residents speak other language at home (42% speak English very well, 58% speak English well).
Foreign born population: 4,395 (17.7%)
(87.5% of them are naturalized citizens)
| Here: | 4.8 |
| State: | 6.0 |
| Here: | 3.6 |
| State: | 3.9 |
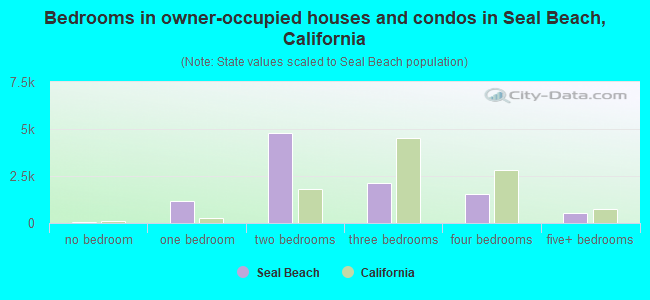
- Bedrooms in owner-occupied houses and condos in Seal Beach, California
- 77no bedroom
- 1,1961 bedroom
- 4,7932 bedrooms
- 2,1153 bedrooms
- 1,5344 bedrooms
- 5205+ bedrooms
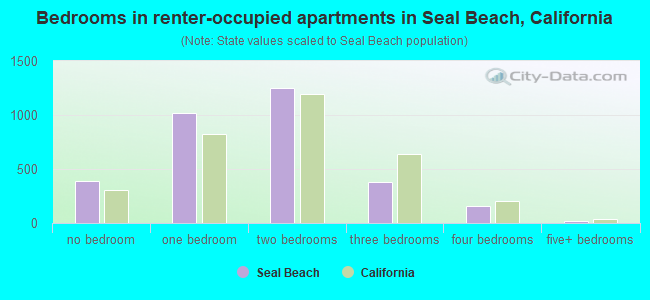
- Bedrooms in renter-occupied apartments in Seal Beach, California
- 385no bedroom
- 1,0141 bedroom
- 1,2512 bedrooms
- 3813 bedrooms
- 1554 bedrooms
- 185+ bedrooms
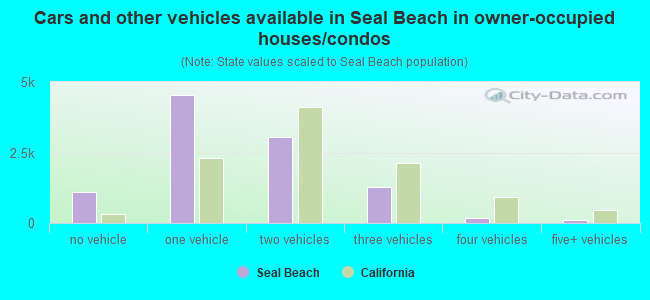
- Cars and other vehicles available in Seal Beach in owner-occupied houses/condos
- 1,097no vehicle
- 4,5291 vehicle
- 3,0352 vehicles
- 1,2823 vehicles
- 1914 vehicles
- 1005+ vehicles
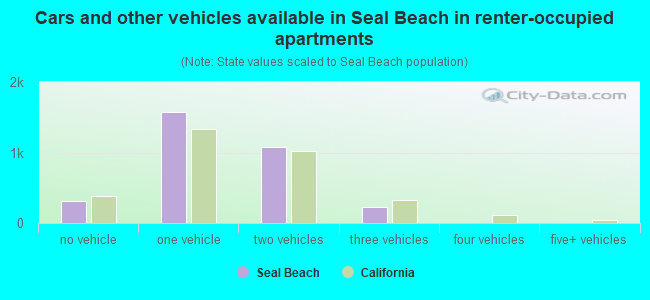
- Cars and other vehicles available in Seal Beach in renter-occupied apartments
- 313no vehicle
- 1,5801 vehicle
- 1,0802 vehicles
- 2303 vehicles
- 04 vehicles
- 05+ vehicles
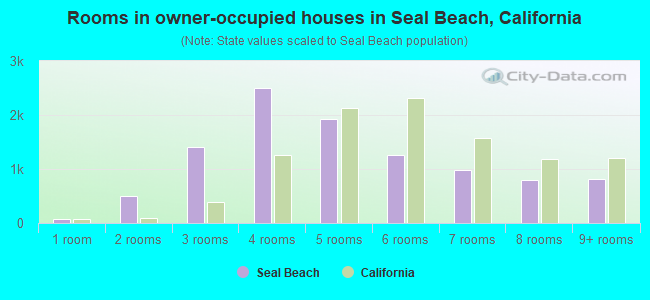
- Rooms in owner-occupied houses in Seal Beach, California
- 771 room
- 4982 rooms
- 1,3993 rooms
- 2,4994 rooms
- 1,9235 rooms
- 1,2636 rooms
- 9767 rooms
- 7938 rooms
- 8079+ rooms
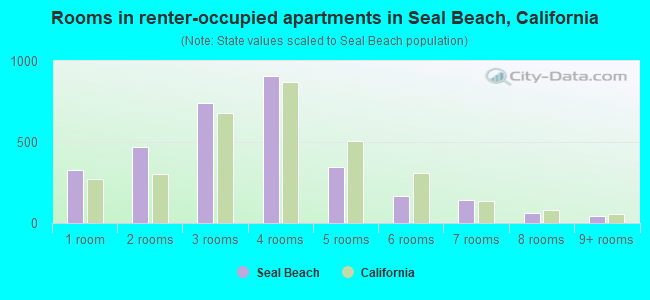
- Rooms in renter-occupied apartments in Seal Beach, California
- 3271 room
- 4712 rooms
- 7433 rooms
- 9074 rooms
- 3455 rooms
- 1646 rooms
- 1407 rooms
- 618 rooms
- 459+ rooms
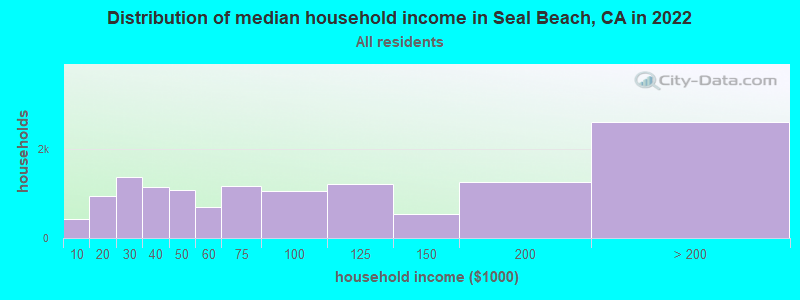
Seal Beach, CA household income distribution

- 439Less than $10,000
- 957$10,000 to $19,999
- 1,382$20,000 to $29,999
- 1,138$30,000 to $39,999
- 1,081$40,000 to $49,999
- 693$50,000 to $59,999
- 1,164$60,000 to $74,999
- 1,055$75,000 to $99,999
- 1,218$100,000 to $124,999
- 534$125,000 to $149,999
- 1,255$150,000 to $199,999
- 2,614$200,000 or more
Home value of owner - occupied houses in 2022 in Seal Beach, CA
-
- 57Less than $10,000
- 63$10,000 to $14,999
- 6$15,000 to $19,999
- 13$20,000 to $24,999
- 15$35,000 to $39,999
- 11$40,000 to $49,999
- 8$50,000 to $59,999
- 24$90,000 to $99,999
- 88$100,000 to $124,999
- 147$125,000 to $149,999
- 561$150,000 to $174,999
- 285$175,000 to $199,999
- 908$200,000 to $249,999
- 741$250,000 to $299,999
- 1,092$300,000 to $399,999
- 756$400,000 to $499,999
- 415$500,000 to $749,999
- 729$750,000 to $999,999
- 2,795$1,000,000 to $1,499,999
- 736$1,500,000 to $1,999,999
- 921$2,000,000 or more

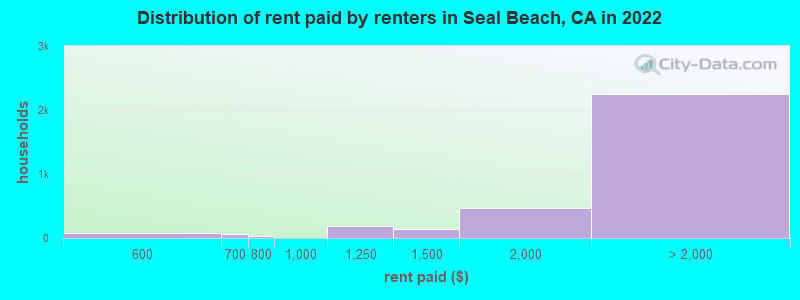
Rent paid by renters in 2022 in Seal Beach, CA
-
- 8$450 to $499
- 58$500 to $549
- 13$550 to $599
- 65$650 to $699
- 20$700 to $749
- 13$750 to $799
- 190$1,000 to $1,249
- 144$1,250 to $1,499
- 462$1,500 to $1,999
- 942$2,000 to $2,499
- 567$2,500 to $2,999
- 278$3,000 to $3,499
- 261$3,500 or more
- 192No cash rent
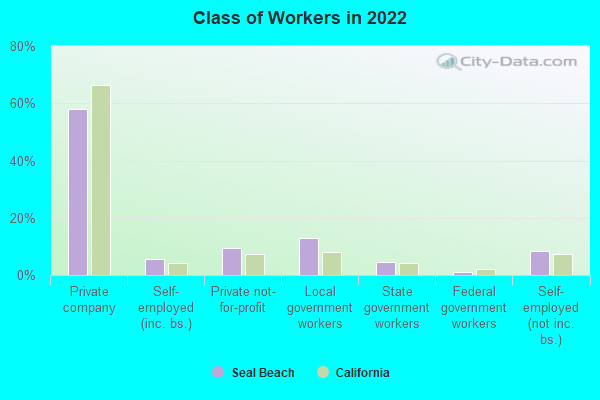
Percentage of workers working in this county: 63.2%
Number of people working at home: 2,302 (25.2% of all workers)
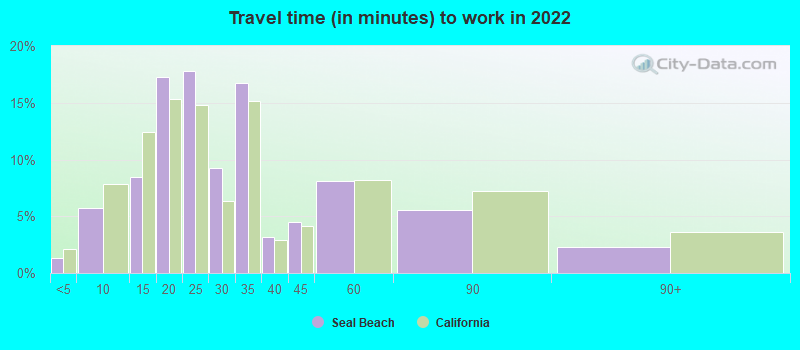
Travel time to work (commute)
- Less than 5 minutes: 110
- 5 to 9 minutes: 437
- 10 to 14 minutes: 533
- 15 to 19 minutes: 991
- 20 to 24 minutes: 1,066
- 25 to 29 minutes: 407
- 30 to 34 minutes: 1,164
- 35 to 39 minutes: 241
- 40 to 44 minutes: 373
- 45 to 59 minutes: 1,008
- 60 to 89 minutes: 331
- 90 or more minutes: 244
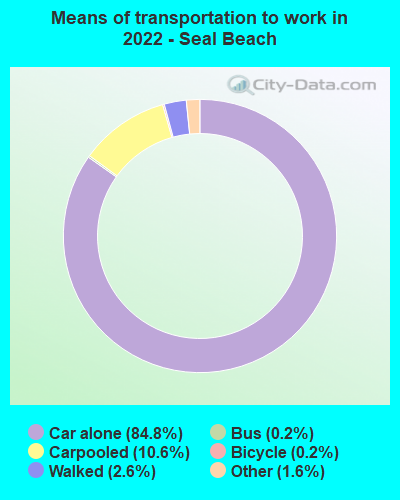
Means of transportation to work:
- Drove a car alone: 10,473 (70.6%)
- Carpooled: 1,421 (9.6%)
- Bus: 23 (0.2%)
- Taxi: 227 (1.5%)
- Bicycle: 32 (0.2%)
- Walked: 318 (2.1%)
- Worked at home: 2,302 (15.5%)
- Unemployment by race in 2022
- Unemployment rate for White non-Hispanic residents
- 3.2%Males
- 3.3%Females
- Unemployment rate for Black residents
- 17.6%Males
- 10.8%Females
- Unemployment rate for American Indian and Alaska Native residents
- 30.0%Males
- Unemployment rate for Asian residents
- 1.6%Females
- Unemployment rate for two or more race residents
- 5.0%Females
- Unemployment rate for Hispanic or Latino residents
- 1.5%Males
- 5.8%Females
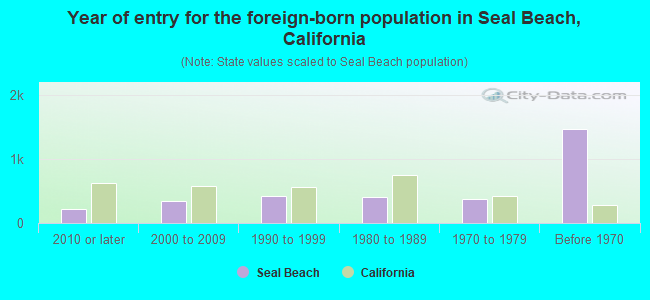
- Year of entry for the foreign-born population in Seal Beach, California
- 2212010 or later
- 3492000 to 2009
- 4221990 to 1999
- 4091980 to 1989
- 3721970 to 1979
- 1,474Before 1970
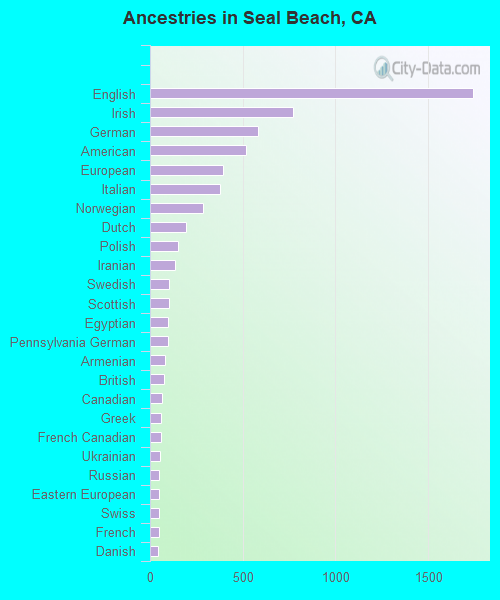
First ancestries reported:
- English: 1,741 (14.4%)
- Irish: 772 (6.4%)
- German: 584 (4.8%)
- American: 520 (4.3%)
- European: 396 (3.3%)
- Italian: 377 (3.1%)
- Norwegian: 285 (2.4%)
- Dutch: 196 (1.6%)
- Polish: 152 (1.3%)
- Iranian: 135 (1.1%)
- Swedish: 104 (0.9%)
- Scottish: 103 (0.9%)
- Egyptian: 98 (0.8%)
- Pennsylvania German: 97 (0.8%)
- Armenian: 83 (0.7%)
- British: 74 (0.6%)
- Canadian: 64 (0.5%)
- Greek: 62 (0.5%)
- French Canadian: 57 (0.5%)
- Ukrainian: 56 (0.5%)
- Russian: 51 (0.4%)
- Eastern European: 48 (0.4%)
- Swiss: 47 (0.4%)
- French: 46 (0.4%)
- Danish: 45 (0.4%)
- Finnish: 40 (0.3%)
- Slovak: 33 (0.3%)
- Northern European: 30 (0.2%)
- Scotch-Irish: 29 (0.2%)
- Lebanese: 27 (0.2%)
- Croatian: 23 (0.2%)
- Austrian: 21 (0.2%)
- Jordanian: 19 (0.2%)
- Slavic: 17 (0.1%)
- Lithuanian: 14 (0.1%)
- Celtic: 12 (0.10%)
- Latvian: 10 (0.08%)
- Hungarian: 8 (0.07%)
- Portuguese: 8 (0.07%)
- Slovene: 6 (0.05%)
- Bulgarian: 6 (0.05%)
- Jamaican: 6 (0.05%)
- Czech: 5 (0.04%)
- Basque: 5 (0.04%)
- Belgian: 4 (0.03%)
- Romanian: 3 (0.02%)
- Brazilian: 2 (0.02%)
- Barbadian: 2 (0.02%)
Most common places of birth for foreign-born residents (%):
| Seal Beach: | 20.1% (884) |
| California: | 3.0% (315,248) |
| Seal Beach: | 7.5% (330) |
| California: | 7.8% (818,297) |
| Seal Beach: | 6.1% (267) |
| California: | 1.2% (127,477) |
| Seal Beach: | 5.8% (255) |
| California: | 4.9% (512,335) |
| Seal Beach: | 5.8% (253) |
| California: | 37.2% (3,881,193) |
| Seal Beach: | 3.4% (150) |
| California: | 0.4% (42,718) |
| Seal Beach: | 3.4% (150) |
| California: | 1.0% (103,575) |
| Seal Beach: | 2.9% (127) |
| California: | 5.2% (539,184) |
| Seal Beach: | 2.8% (124) |
| California: | 0.2% (23,338) |
| Seal Beach: | 2.7% (119) |
| California: | 6.6% (684,672) |
| Seal Beach: | 2.5% (111) |
| California: | 1.7% (176,274) |
| Seal Beach: | 2.5% (110) |
| California: | 0.2% (20,997) |
| Seal Beach: | 2.3% (102) |
| California: | 2.0% (206,004) |
| Seal Beach: | 2.3% (102) |
| California: | 0.7% (73,304) |
| Seal Beach: | 2.0% (86) |
| California: | 4.2% (440,287) |
| Seal Beach: | 1.8% (77) |
| California: | 0.1% (8,444) |
| Seal Beach: | 1.6% (71) |
| California: | 0.7% (74,025) |
| Seal Beach: | 1.6% (71) |
| California: | 0.2% (20,474) |
| Seal Beach: | 1.5% (68) |
| California: | 0.0% (1,172) |
Place of birth for U.S.-born residents:
- This state: 12,808
- Other state: 7,279
- Northeast: 1,636
- Midwest: 2,620
- South: 1,830
- West: 1,200
90.5% of Seal Beach residents lived in the same house 1 years ago.
Out of people who lived in different houses, 29.5% lived in this county.
Out of people who lived in different counties, 72.4% lived in California.
| Seal Beach: | 90.5% |
| State average: | 88.9% |
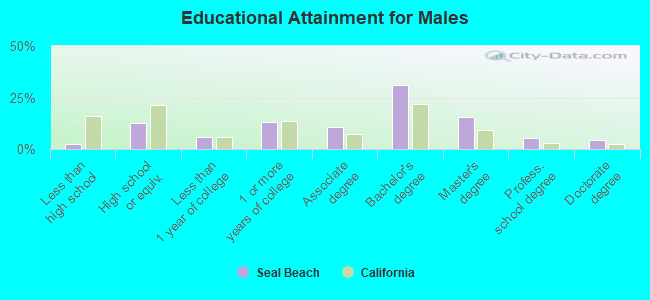
Education attainment for males 25 years and older:
- No schooling: 68
- Nursery to 4th grade: 0
- 5th and 6th grade: 26
- 7th and 8th grade: 12
- 9th grade: 45
- 10th grade: 44
- 11th grade: 9
- 12th grade, no diploma: 13
- High school graduate (or equivalency): 1,117
- Less than 1 year of college: 507
- Some college more than 1 year, no degree: 1,156
- Associate degree: 975
- Bachelor's degree: 2,768
- Master's degree: 1,373
- Professional school degree: 477
- Doctorate degree: 379
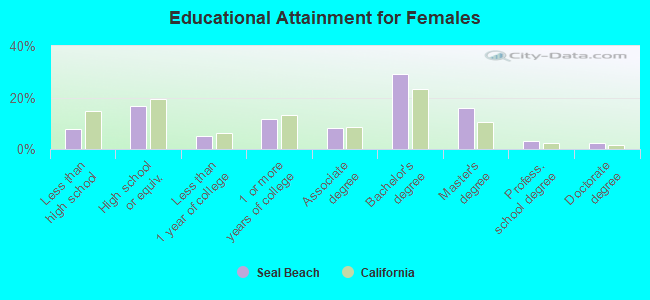
Education attainment for females 25 years and older:
- No schooling: 238
- Nursery to 4th grade: 49
- 5th and 6th grade: 116
- 7th and 8th grade: 33
- 9th grade: 56
- 10th grade: 159
- 11th grade: 130
- 12th grade, no diploma: 159
- High school graduate (or equivalency): 1,987
- Less than 1 year of college: 621
- Some college more than 1 year, no degree: 1,415
- Associate degree: 961
- Bachelor's degree: 3,484
- Master's degree: 1,886
- Professional school degree: 369
- Doctorate degree: 295
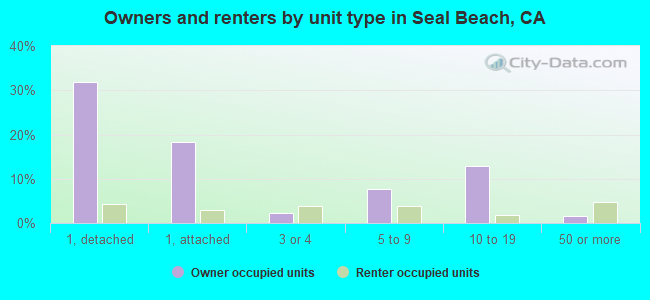
Housing units in structures:
- One, detached: 5,461
- One, attached: 3,396
- Two: 252
- 3 or 4: 819
- 5 to 9: 1,471
- 10 to 19: 2,140
- 20 to 49: 299
- 50 or more: 954
- Mobile homes: 73
Housing units lacking complete kitchen facilities in 2022: 1.5%
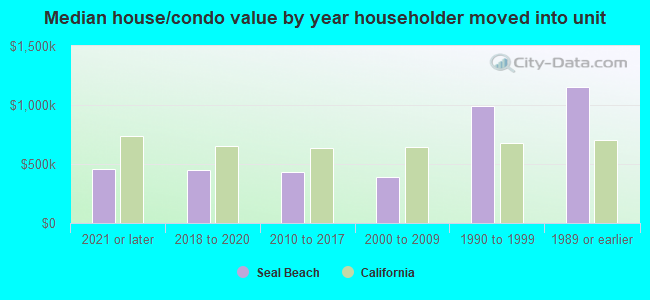
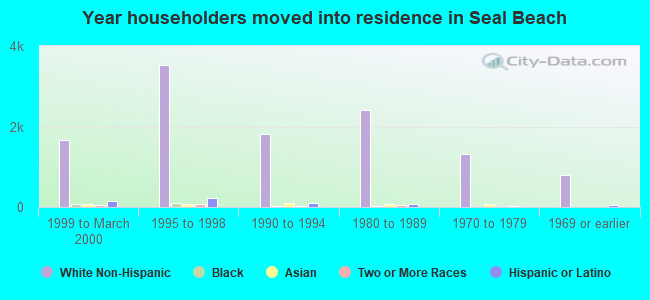
House/condo owner moved in on average 9 years ago
Renter moved in on average 3 years ago
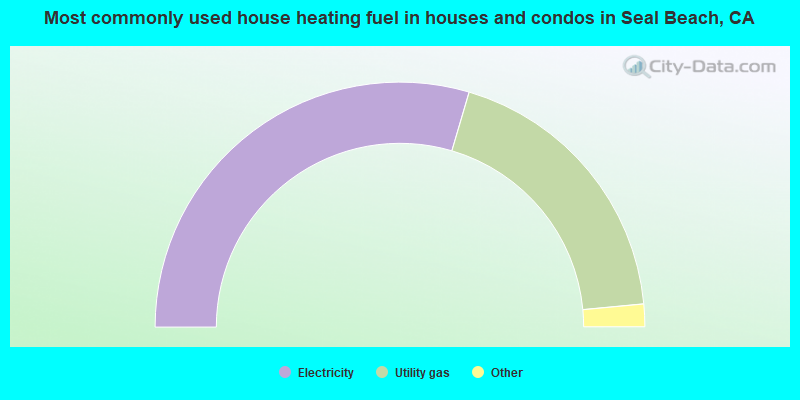
- 59.2%Electricity
- 37.9%Utility gas
- 1.0%Bottled, tank, or LP gas
- 1.0%No fuel used
- 0.5%Solar energy
- 0.3%Other fuel
- 0.1%Wood
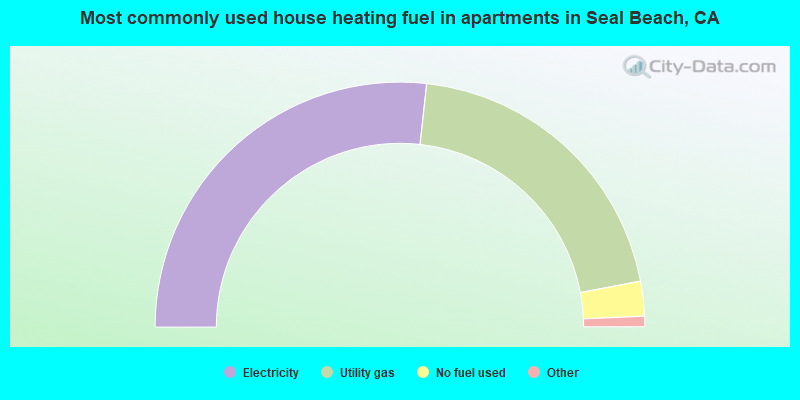
- 53.5%Electricity
- 40.5%Utility gas
- 4.6%No fuel used
- 1.1%Bottled, tank, or LP gas
- 0.1%Wood
- 0.1%Solar energy
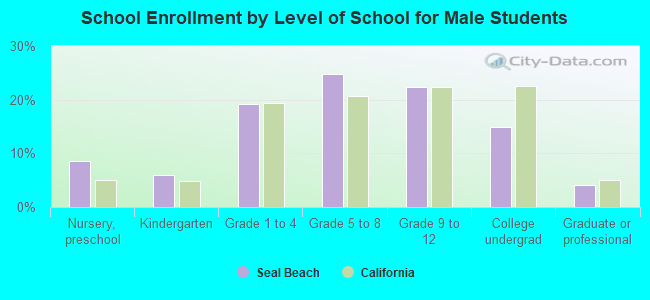
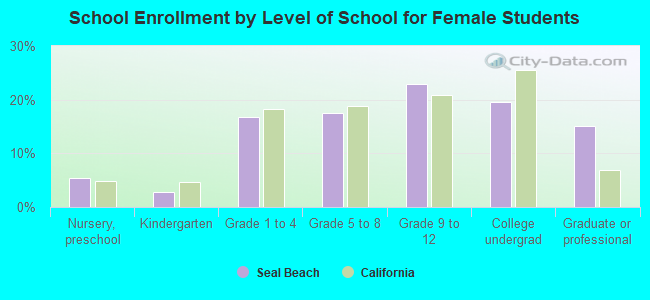
Private vs. public school enrollment:
| Here: | 8.7% |
| California: | 10.5% |
| Here: | 10.7% |
| California: | 8.5% |
| Here: | 12.7% |
| California: | 15.9% |