Housing density: 1,192 houses/condos per square mile
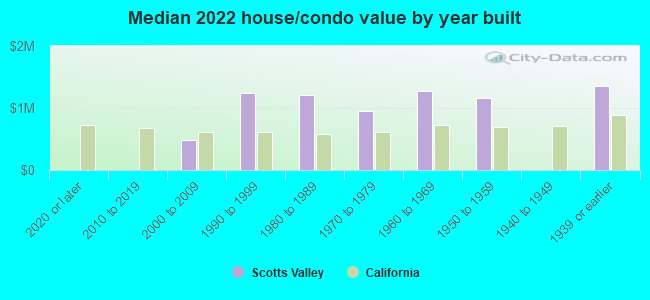
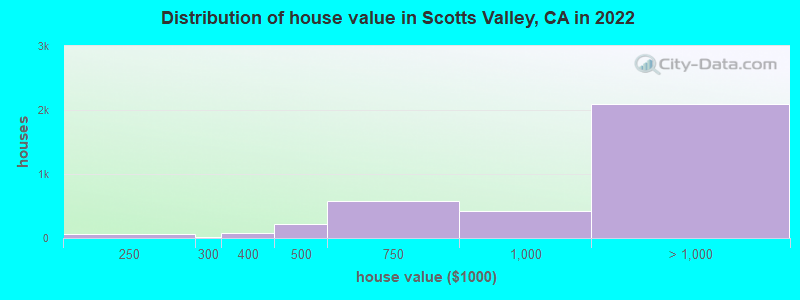
Median price asked for vacant for-sale houses and condos in 2022 in this county: $1,182,827.
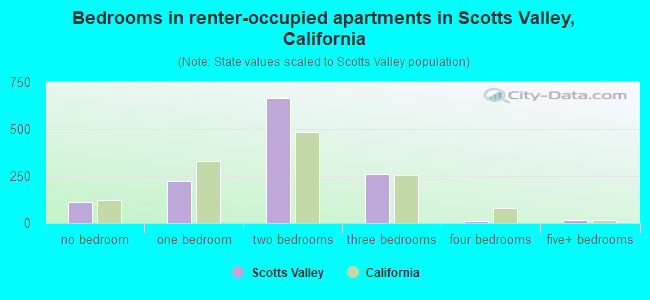
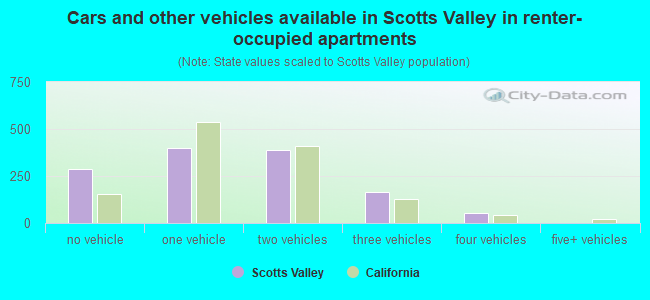
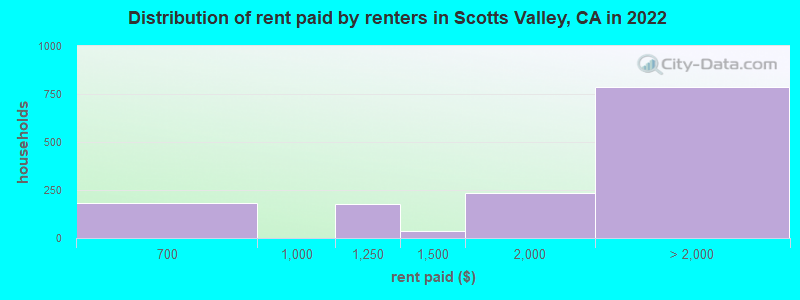
Median contract rent in 2022: over $2,000 (lower quartile is $1,459, upper quartile is over $2,000)
Median rent asked for vacant for-rent units in 2022: $4,289
Median gross rent in Scotts Valley, CA in 2022: over $2,000
Housing units in Scotts Valley with a mortgage: 2,317 (310 second mortgage, 10 home equity loan, 308 both second mortgage and home equity loan) Houses without a mortgage: 0
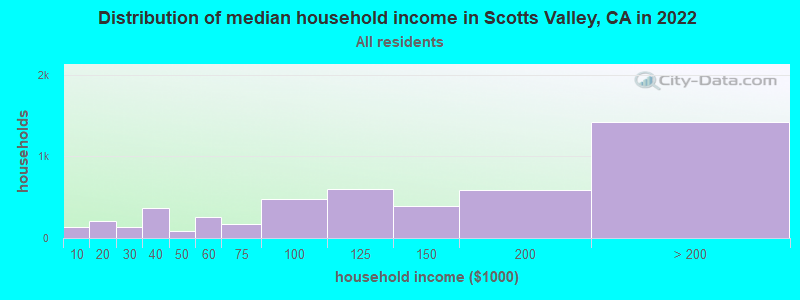
Median household income for houses/condos with a mortgage: $182,277
Median household income for apartments without a mortgage: $112,420
Median monthly housing costs: $2,294
Compare current foreclosures near Scotts Valley, CA:
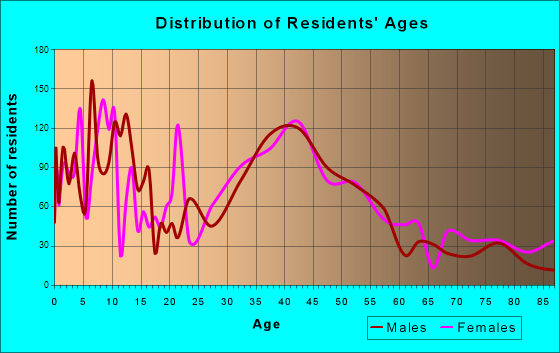
Size of family households: 1,700 2-persons, 872 3-persons, 713 4-persons, 195 5-persons, 24 6-persons, 23 7-or-more-persons.
Size of nonfamily households: 1,155 1-person, 184 2-persons, 18 3-persons.
1,366 married couples with children.
468 single-parent households (225 men, 243 women).
85.6% of residents of Scotts Valley speak English at home.
5.3% of residents speak Spanish at home (72% speak English very well, 13% speak English well, 15% speak English not well).
3.7% of residents speak other Indo-European language at home (62% speak English very well, 21% speak English well, 11% speak English not well, 7% don't speak English at all).
3.9% of residents speak Asian or Pacific Island language at home (73% speak English very well, 21% speak English well, 6% speak English not well).
1.2% of residents speak other language at home (100% speak English very well).
Foreign born population: 1,706 (14.2%)
(80.7% of them are naturalized citizens)
Percentage of workers working in this county: 80.8% Number of people working at home: 1,678 (27.7% of all workers)
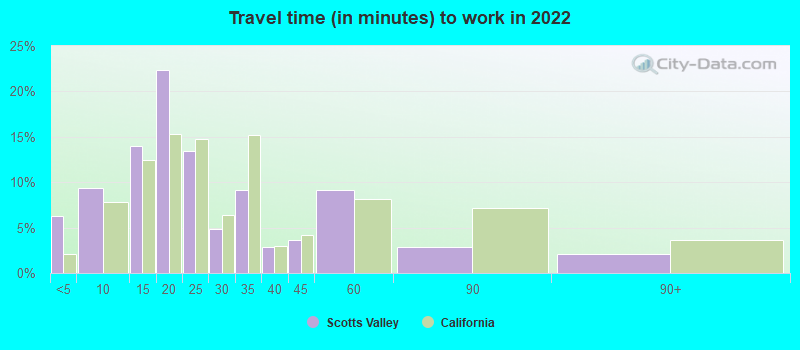
Travel time to work (commute)
Less than 5 minutes: 217
5 to 9 minutes: 371
10 to 14 minutes: 903
15 to 19 minutes: 943
20 to 24 minutes: 304
25 to 29 minutes: 111
30 to 34 minutes: 293
35 to 39 minutes: 238
40 to 44 minutes: 325
45 to 59 minutes: 650
60 to 89 minutes: 221
90 or more minutes: 41
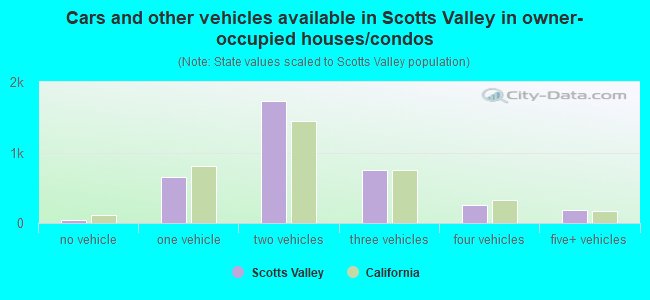
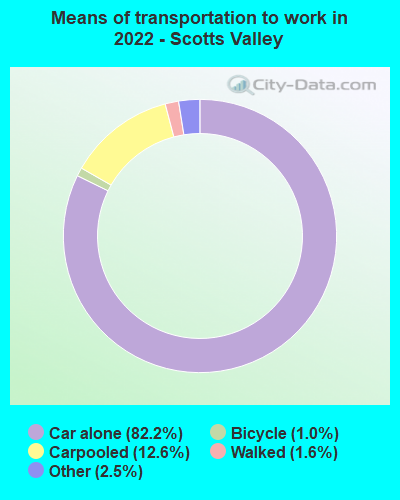
Means of transportation to work:
Drove a car alone: 4,598 (62.1%)
Carpooled: 782 (10.6%)
Bus: 7 (0.1%)
Taxi: 154 (2.1%)
Bicycle: 65 (0.9%)
Walked: 86 (1.2%)
Worked at home: 1,678 (22.7%)
Unemployment by race in 2022
Unemployment rate for White non-Hispanic residents
2.2%Males
2.3%Females
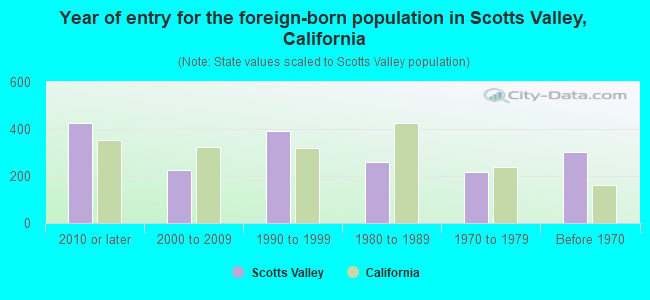
Year of entry for the foreign-born population in Scotts Valley, California
4242010 or later
2252000 to 2009
3921990 to 1999
2611980 to 1989
2181970 to 1979
303Before 1970
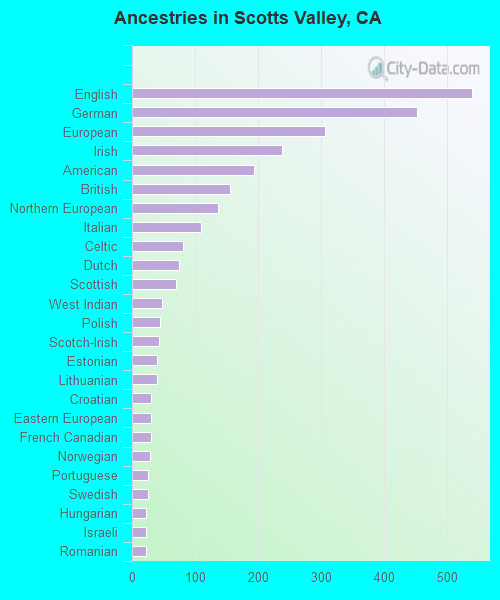
First ancestries reported:
English: 540 (11.0%)
German: 452 (9.2%)
European: 307 (6.2%)
Irish: 239 (4.9%)
American: 194 (3.9%)
British: 155 (3.1%)
Northern European: 136 (2.8%)
Italian: 110 (2.2%)
Celtic: 81 (1.6%)
Dutch: 75 (1.5%)
Scottish: 70 (1.4%)
West Indian: 48 (1.0%)
Polish: 44 (0.9%)
Scotch-Irish: 43 (0.9%)
Estonian: 40 (0.8%)
Lithuanian: 39 (0.8%)
Croatian: 30 (0.6%)
Eastern European: 30 (0.6%)
French Canadian: 30 (0.6%)
Norwegian: 29 (0.6%)
Portuguese: 26 (0.5%)
Swedish: 26 (0.5%)
Hungarian: 23 (0.5%)
Israeli: 22 (0.4%)
Romanian: 22 (0.4%)
Danish: 20 (0.4%)
Moroccan: 19 (0.4%)
Russian: 19 (0.4%)
Ukrainian: 18 (0.4%)
Lebanese: 10 (0.2%)
Iranian: 9 (0.2%)
Greek: 1 (0.02%)
Most common places of birth for foreign-born residents (%):
Mexico
Scotts Valley:
18.3% (304)
California:
37.2% (3,881,193)
United Kingdom, excluding England and Scotland
Scotts Valley:
11.0% (183)
California:
0.6% (60,582)
China, excluding Hong Kong and Taiwan
Scotts Valley:
8.7% (145)
California:
6.6% (684,672)
Korea
Scotts Valley:
6.9% (115)
California:
3.0% (315,248)
Canada
Scotts Valley:
5.5% (92)
California:
1.2% (127,477)
India
Scotts Valley:
5.3% (88)
California:
5.2% (539,184)
Taiwan
Scotts Valley:
4.8% (80)
California:
1.7% (176,274)
England
Scotts Valley:
4.3% (72)
California:
0.6% (57,953)
Iran
Scotts Valley:
4.2% (70)
California:
2.0% (206,004)
Brazil
Scotts Valley:
3.7% (61)
California:
0.5% (53,222)
Nepal
Scotts Valley:
3.4% (57)
California:
0.2% (16,541)
Scotland
Scotts Valley:
2.5% (42)
California:
0.1% (8,444)
Croatia
Scotts Valley:
2.1% (35)
California:
0.0% (4,947)
Pakistan
Scotts Valley:
2.1% (35)
California:
0.5% (49,399)
Other Eastern Europe
Scotts Valley:
1.9% (32)
California:
0.2% (17,699)
Germany
Scotts Valley:
1.8% (30)
California:
0.7% (73,304)
Place of birth for U.S.-born residents:
This state: 7,300
Other state: 2,885
Northeast: 1,042
Midwest: 611
South: 708
West: 527
88.0% of Scotts Valley residents lived in the same house 1 years ago. Out of people who lived in different houses, 34.2% lived in this county. Out of people who lived in different counties, 87.3% lived in California.
Scotts Valley:
88.0%
State average:
88.9%
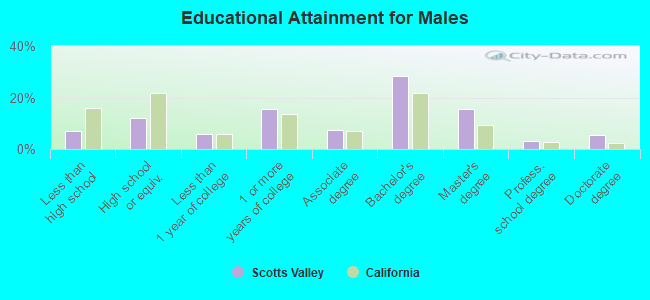
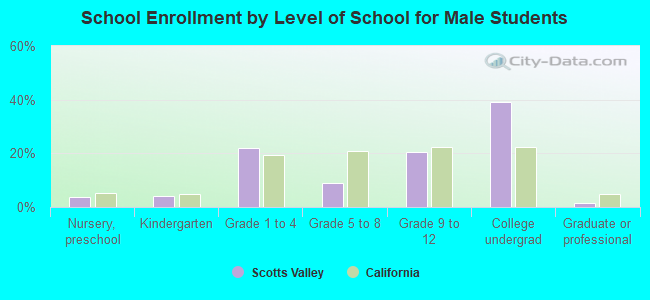
Education attainment for males 25 years and older:
No schooling: 12
Nursery to 4th grade: 0
5th and 6th grade: 0
7th and 8th grade: 12
9th grade: 0
10th grade: 39
11th grade: 99
12th grade, no diploma: 148
High school graduate (or equivalency): 522
Less than 1 year of college: 253
Some college more than 1 year, no degree: 672
Associate degree: 327
Bachelor's degree: 1,219
Master's degree: 665
Professional school degree: 129
Doctorate degree: 227
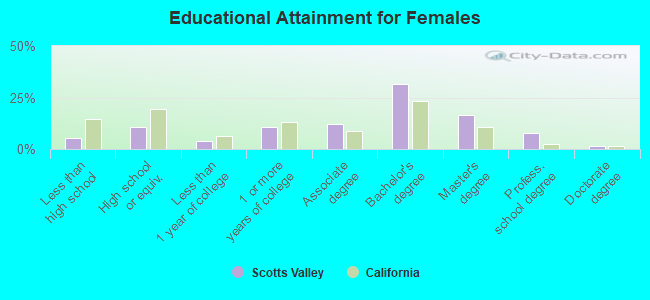
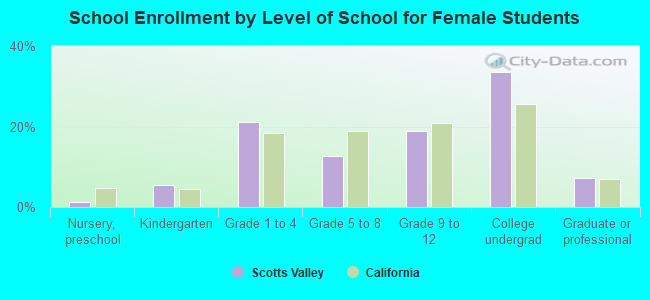
Education attainment for females 25 years and older:
No schooling: 84
Nursery to 4th grade: 0
5th and 6th grade: 0
7th and 8th grade: 27
9th grade: 0
10th grade: 0
11th grade: 47
12th grade, no diploma: 84
High school graduate (or equivalency): 493
Less than 1 year of college: 178
Some college more than 1 year, no degree: 501
Associate degree: 575
Bachelor's degree: 1,479
Master's degree: 769
Professional school degree: 371
Doctorate degree: 66
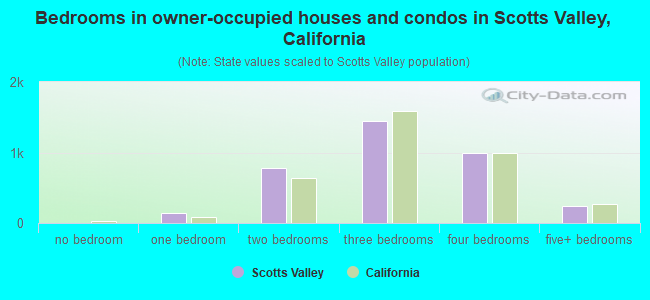
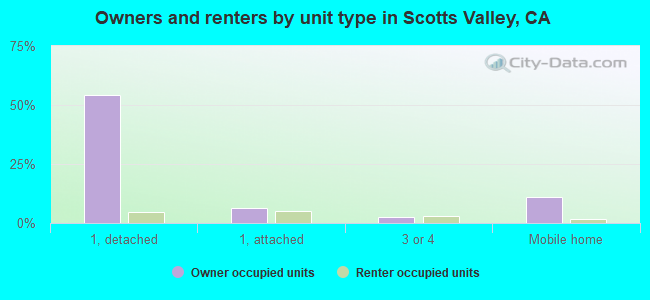
Housing units in structures:
One, detached: 2,982
One, attached: 551
Two: 69
3 or 4: 230
5 to 9: 325
10 to 19: 61
20 to 49: 29
50 or more: 211
Mobile homes: 1,024
Median worth of mobile homes: $566,826
Housing units lacking complete kitchen facilities in 2022: 1.3%
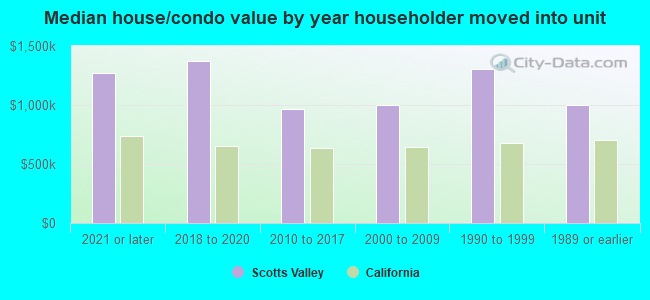
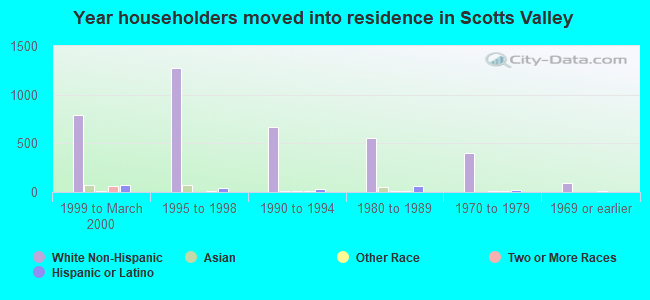
House/condo owner moved in on average 10 years ago