Saratoga Springs, UT (Utah) Houses and Residents
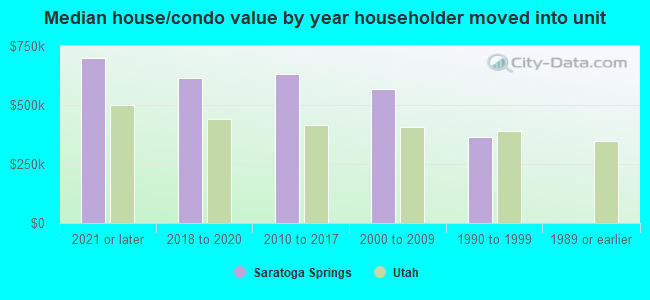
| Saratoga Springs: | $606,993 |
| Utah: | $499,500 |
Total population: 24,356 (Urban population: 0, Rural population: 930 (all nonfarm))
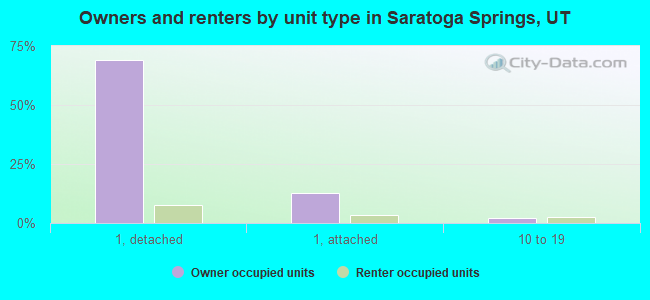
Houses: 11,097 (10,582 occupied: 8,894 owner occupied, 1,710 renter occupied)
| % of renters here: | 16% |
| State: | 29% |
Housing density: 1,086 houses/condos per square mile
Median price asked for vacant for-sale houses and condos in 2022: $1,352,396.
Median contract rent in 2022: $1,842 (lower quartile is $1,492, upper quartile is over $2,000)
Median gross rent in Saratoga Springs, UT in 2022: over $2,000
Housing units in Saratoga Springs with a mortgage: 7,327 (1,032 second mortgage, 49 home equity loan, 884 both second mortgage and home equity loan)
Houses without a mortgage: 31
Median household income for houses/condos with a mortgage: $130,768
Median household income for apartments without a mortgage: $108,168
Median monthly housing costs: $1,972
Compare current foreclosures in Saratoga Springs, UT:
| Photo | Address | Area | Beds / Baths | Price | Details |
|---|---|---|---|---|---|

|
#1
Plum Pl
Saratoga Springs, UT 84045
|
1,572 sq. feet
|
2 baths 3 beds |
show details | |

|
#2
N Buffalo Dr
Saratoga Springs, UT 84045
|
1,684 sq. feet
|
3 baths 3 beds |
show details | |

|
#3
Sandpiper Ln
Saratoga Springs, UT 84045
|
2,931 sq. feet
|
3 baths 5 beds |
show details | |

|
#4
N Venetian Way
Saratoga Springs, UT 84045
|
1,718 sq. feet
|
2 baths 3 beds |
show details | |

|
#5
Red Hen Rd
Saratoga Springs, UT 84045
|
1,378 sq. feet
|
2 baths 3 beds |
show details | |

|
#6
Rocky Creek Way
Saratoga Springs, UT 84045
|
3,931 sq. feet
|
3 baths 3 beds |
show details | |

|
#7
Napa Dr
Saratoga Springs, UT 84045
|
1,710 sq. feet
|
2 baths 4 beds |
show details | |

|
#8
W Birch Dr
Saratoga Springs, UT 84045
|
2,480 sq. feet
|
2 baths 4 beds |
show details | |

|
#9
Waterside Dr
Saratoga Springs, UT 84045
|
7,384 sq. feet
|
4 baths 6 beds |
show details | |

|
#10
Maverick Rd
Saratoga Springs, UT 84045
|
1,981 sq. feet
|
2 baths 3 beds |
show details |
| Photo | Address | Area | Beds / Baths | Price | Details |
|---|---|---|---|---|---|

|
#11
Alpine Dr
Saratoga Springs, UT 84045
|
1,707 sq. feet
|
2 baths 3 beds |
show details | |

|
#12
E Bluegrass Row
Saratoga Springs, UT 84045
|
- sq. feet
|
- baths - beds |
show details | |

|
#13
E Bearing Dr, Apt F301
Saratoga Springs, UT 84045
|
- sq. feet
|
- baths - beds |
show details | |

|
#14
N Willowbrook
Saratoga Springs, UT 84045
|
- sq. feet
|
- baths - beds |
show details | |

|
#15
S Red Pine Dr
Saratoga Springs, UT 84045
|
- sq. feet
|
- baths - beds |
show details | |

|
#16
S Harrier Dr
Saratoga Springs, UT 84045
|
- sq. feet
|
- baths - beds |
show details | |

|
#17
W Spring Hill Way
Saratoga Springs, UT 84045
|
- sq. feet
|
- baths - beds |
show details | |

|
#18
N Stone Gate Dr
Saratoga Springs, UT 84045
|
- sq. feet
|
- baths - beds |
show details | |

|
#19
N Dry Creek Rd
Saratoga Springs, UT 84045
|
- sq. feet
|
- baths - beds |
show details | |

|
#20
N Eaglewood Dr
Saratoga Springs, UT 84045
|
- sq. feet
|
- baths - beds |
show details |
| Photo | Address | Area | Beds / Baths | Price | Details |
|---|---|---|---|---|---|

|
#21
Cider Pl
Saratoga Springs, UT 84045
|
- sq. feet
|
- baths - beds |
show details | |

|
#22
N Trek Rd
Saratoga Springs, UT 84045
|
- sq. feet
|
- baths - beds |
show details | |

|
#23
W Harvest Village Ln
Saratoga Springs, UT 84045
|
- sq. feet
|
- baths - beds |
show details | |

|
#24
E Dory Boat Rd
Saratoga Springs, UT 84045
|
- sq. feet
|
- baths - beds |
show details | |

|
#25
S Deer Meadow Dr
Saratoga Springs, UT 84045
|
- sq. feet
|
- baths - beds |
show details | |

|
#26
S Sage Bloom Way
Saratoga Springs, UT 84045
|
- sq. feet
|
- baths - beds |
show details | |

|
#27
E Ruddy Way
Saratoga Springs, UT 84045
|
- sq. feet
|
- baths - beds |
show details | |

|
#28
W Parkside Dr
Saratoga Springs, UT 84045
|
- sq. feet
|
- baths - beds |
show details | |

|
#29
W Independence Way
Saratoga Springs, UT 84045
|
- sq. feet
|
- baths - beds |
show details | |

|
#30
Morgan Rd
Saratoga Springs, UT 84045
|
- sq. feet
|
- baths - beds |
show details |
| Photo | Address | Area | Beds / Baths | Price | Details |
|---|---|---|---|---|---|

|
#31
N Desert Sage Cir
Saratoga Springs, UT 84045
|
- sq. feet
|
- baths - beds |
show details | |

|
#32
E Bearing Dr, Apt 205
Saratoga Springs, UT 84045
|
- sq. feet
|
- baths - beds |
show details | |

|
#33
W Newcastle Ln, # B304
Saratoga Springs, UT 84045
|
- sq. feet
|
- baths - beds |
show details | |

|
#34
S Sunland Way
Saratoga Springs, UT 84045
|
- sq. feet
|
- baths - beds |
show details | |

|
#35
W Quailhill Rd
Saratoga Springs, UT 84045
|
- sq. feet
|
- baths - beds |
show details | |

|
#36
N Willowbrook
Saratoga Springs, UT 84045
|
- sq. feet
|
- baths - beds |
show details | |

|
#37
N Woodland Rd
Saratoga Springs, UT 84045
|
- sq. feet
|
- baths - beds |
show details | |

|
#38
Heron Ct
Saratoga Springs, UT 84045
|
- sq. feet
|
- baths - beds |
show details | |

|
#39
S Preening Way
Saratoga Springs, UT 84045
|
- sq. feet
|
- baths - beds |
show details | |

|
#40
W Fox Hollow Dr
Saratoga Springs, UT 84045
|
- sq. feet
|
- baths - beds |
show details |
| Photo | Address | Area | Beds / Baths | Price | Details |
|---|---|---|---|---|---|

|
#41
W Apaloosa Dr
Saratoga Springs, UT 84045
|
- sq. feet
|
- baths - beds |
show details | |

|
#42
Redwood Rd
Saratoga Springs, UT 84045
|
- sq. feet
|
- baths - beds |
show details | |

|
#43
E Bluegrass Row
Saratoga Springs, UT 84045
|
- sq. feet
|
- baths - beds |
show details | |

|
#44
N Venetian Way
Saratoga Springs, UT 84045
|
- sq. feet
|
- baths - beds |
show details | |

|
#45
W Ridge 7f
Saratoga Springs, UT 84045
|
- sq. feet
|
- baths - beds |
show details | |

|
Check over 1 million property listings on Foreclosure.com!
|
browse all offers | |||


 | Houses for Sale in Saratoga Springs (7 replies) |
| Saratoga Springs or Pleasant Grove? (16 replies) |
| narrowing down areas- pros and cons! (4 replies) |
| Is Saratoga Springs too isolated? (17 replies) |
| Non-mormon in Saratoga Springs. Am I the only one? (58 replies) |
| buying land in eagle mountain / saratoga springs area (7 replies) |
Median year apartment built: 2010
Household type by relationship:
Households: 42,599- Male householders: 6,444 (398 living alone), Female householders: 3,803 (363 living alone)
8,302 spouses (8,229 opposite-sex spouses), 287 unmarried partners, (282 opposite-sex unmarried partners), 21,115 children (19,923 natural, 625 adopted, 566 stepchildren), 534 grandchildren, 199 brothers or sisters, 723 parents, 0 foster children, 466 other relatives, 702 non-relatives
- In group quarters: 20
Size of family households: 1,502 2-persons, 1,654 3-persons, 1,968 4-persons, 2,083 5-persons, 1,549 6-persons, 728 7-or-more-persons.
Size of nonfamily households: 819 1-person, 162 2-persons, 10 3-persons, 49 5-persons.
16,041 married couples with children.
1,330 single-parent households (531 men, 799 women).
88.3% of residents of Saratoga Springs speak English at home.
7.4% of residents speak Spanish at home (69% speak English very well, 21% speak English well, 7% speak English not well, 3% don't speak English at all).
1.7% of residents speak other Indo-European language at home (94% speak English very well, 5% speak English well, 2% speak English not well).
1.9% of residents speak Asian or Pacific Island language at home (95% speak English very well, 5% speak English well).
0.1% of residents speak other language at home (100% speak English very well).
Foreign born population: 2,430 (5.7%)
(37.9% of them are naturalized citizens)
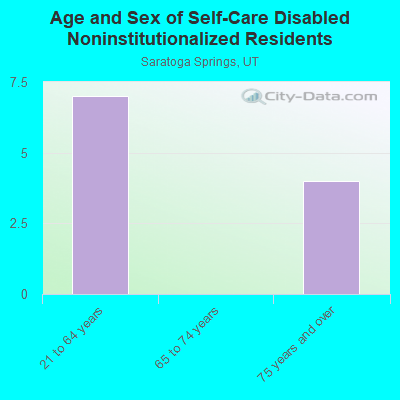
| Here: | 7.9 |
| State: | 7.6 |
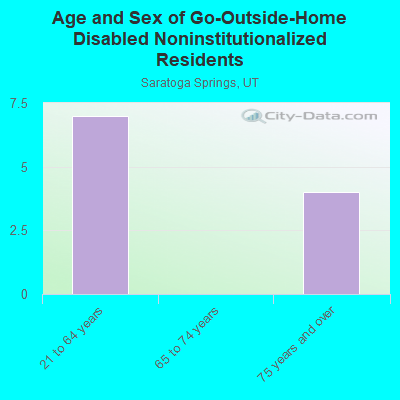
| Here: | 6.1 |
| State: | 4.3 |
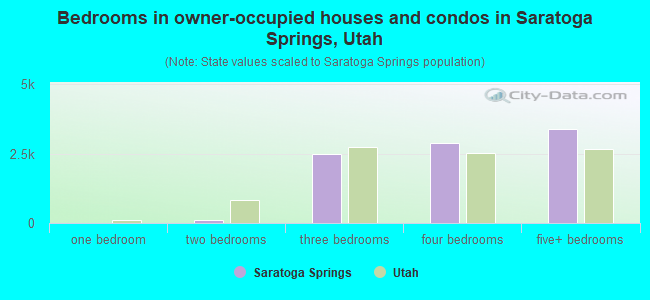
- Bedrooms in owner-occupied houses and condos in Saratoga Springs, Utah
- 13no bedroom
- 01 bedroom
- 1232 bedrooms
- 2,5023 bedrooms
- 2,8674 bedrooms
- 3,3895+ bedrooms
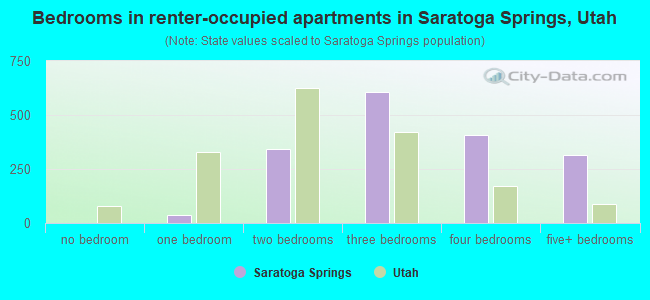
- Bedrooms in renter-occupied apartments in Saratoga Springs, Utah
- 0no bedroom
- 361 bedroom
- 3442 bedrooms
- 6073 bedrooms
- 4084 bedrooms
- 3155+ bedrooms
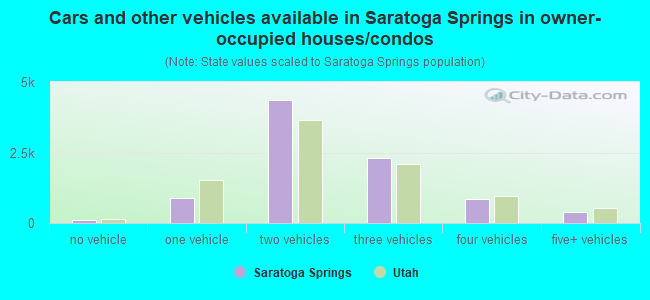
- Cars and other vehicles available in Saratoga Springs in owner-occupied houses/condos
- 118no vehicle
- 8821 vehicle
- 4,3672 vehicles
- 2,3003 vehicles
- 8464 vehicles
- 3825+ vehicles
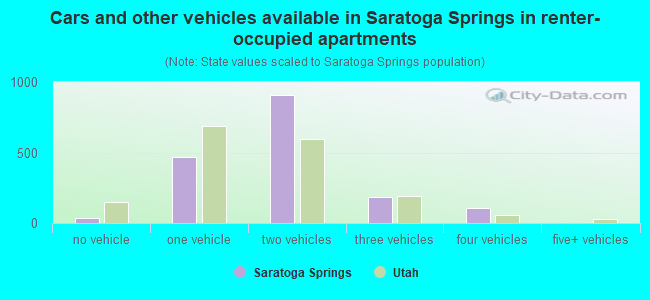
- Cars and other vehicles available in Saratoga Springs in renter-occupied apartments
- 38no vehicle
- 4691 vehicle
- 9102 vehicles
- 1843 vehicles
- 1084 vehicles
- 05+ vehicles
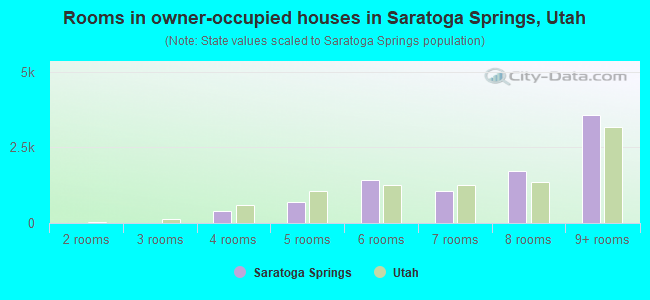
- Rooms in owner-occupied houses in Saratoga Springs, Utah
- 131 room
- 02 rooms
- 153 rooms
- 4074 rooms
- 7025 rooms
- 1,4316 rooms
- 1,0457 rooms
- 1,7088 rooms
- 3,5739+ rooms
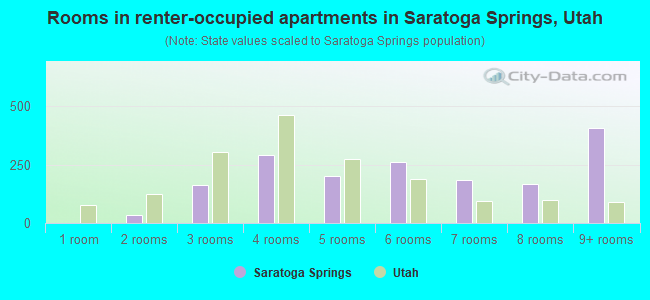
- Rooms in renter-occupied apartments in Saratoga Springs, Utah
- 01 room
- 362 rooms
- 1643 rooms
- 2894 rooms
- 2015 rooms
- 2626 rooms
- 1867 rooms
- 1658 rooms
- 4089+ rooms
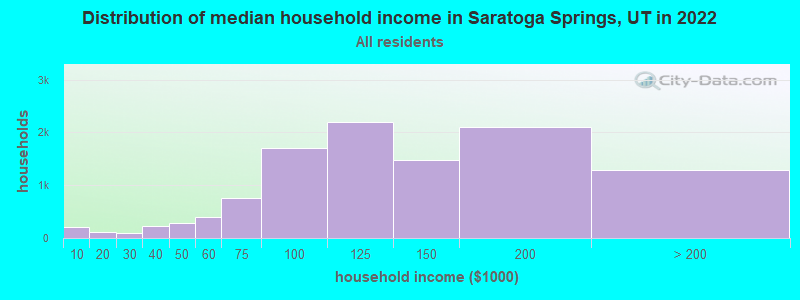
Saratoga Springs, UT household income distribution

- 205Less than $10,000
- 121$10,000 to $19,999
- 98$20,000 to $29,999
- 230$30,000 to $39,999
- 277$40,000 to $49,999
- 400$50,000 to $59,999
- 753$60,000 to $74,999
- 1,708$75,000 to $99,999
- 2,196$100,000 to $124,999
- 1,482$125,000 to $149,999
- 2,094$150,000 to $199,999
- 1,283$200,000 or more
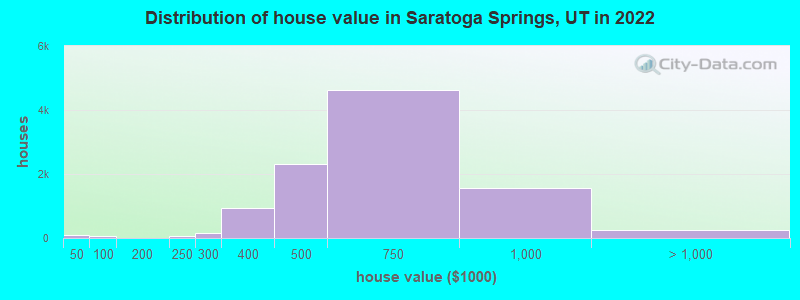
Home value of owner - occupied houses in 2022 in Saratoga Springs, UT
-
- 103Less than $10,000
- 18$50,000 to $59,999
- 34$60,000 to $69,999
- 15$70,000 to $79,999
- 75$200,000 to $249,999
- 158$250,000 to $299,999
- 940$300,000 to $399,999
- 2,320$400,000 to $499,999
- 4,615$500,000 to $749,999
- 1,554$750,000 to $999,999
- 213$1,000,000 to $1,499,999
- 16$1,500,000 to $1,999,999
- 22$2,000,000 or more
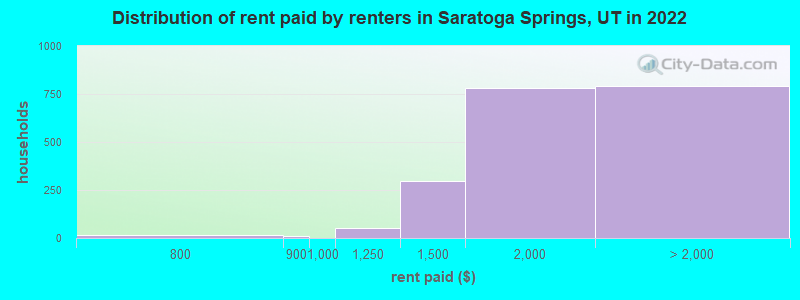
Rent paid by renters in 2022 in Saratoga Springs, UT
-
- 16$750 to $799
- 11$800 to $899
- 52$1,000 to $1,249
- 296$1,250 to $1,499
- 780$1,500 to $1,999
- 542$2,000 to $2,499
- 134$2,500 to $2,999
- 2$3,500 or more
- 113No cash rent
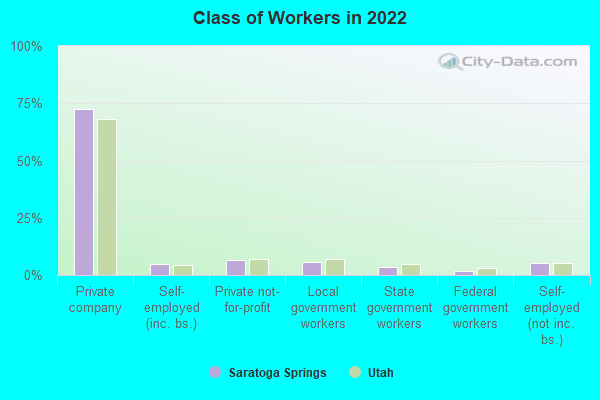
Percentage of workers working in this county: 72.8%
Number of people working at home: 4,391 (24.3% of all workers)
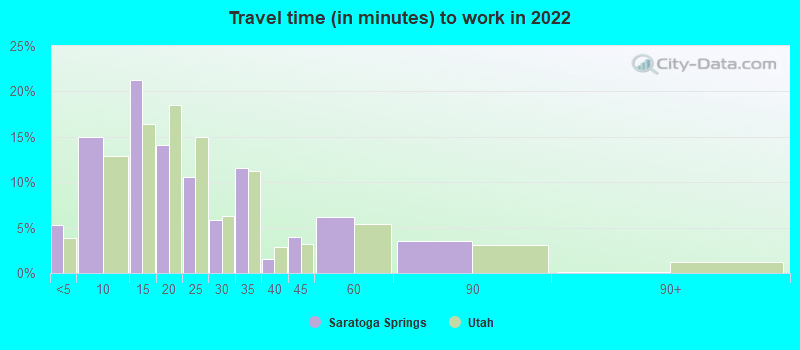
Travel time to work (commute)
- Less than 5 minutes: 353
- 5 to 9 minutes: 1,021
- 10 to 14 minutes: 1,111
- 15 to 19 minutes: 1,566
- 20 to 24 minutes: 1,873
- 25 to 29 minutes: 1,308
- 30 to 34 minutes: 2,579
- 35 to 39 minutes: 928
- 40 to 44 minutes: 923
- 45 to 59 minutes: 1,427
- 60 to 89 minutes: 561
- 90 or more minutes: 143
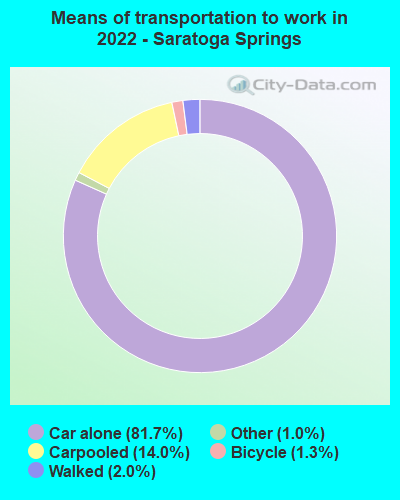
Means of transportation to work:
- Drove a car alone: 4,555 (49.2%)
- Carpooled: 769 (8.3%)
- Taxi: 60 (0.6%)
- Bicycle: 77 (0.8%)
- Walked: 85 (0.9%)
- Worked at home: 4,391 (47.5%)
- Unemployment by race in 2022
- Unemployment rate for White non-Hispanic residents
- 1.1%Males
- 3.5%Females
- Unemployment rate for Asian residents
- 0.7%Females
- Unemployment rate for two or more race residents
- 6.2%Females
- Unemployment rate for Hispanic or Latino residents
- 2.6%Females
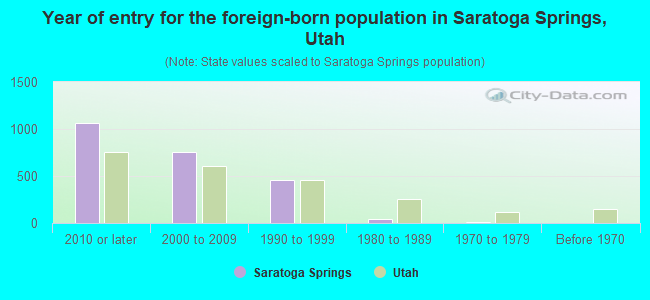
- Year of entry for the foreign-born population in Saratoga Springs, Utah
- 1,0662010 or later
- 7532000 to 2009
- 4621990 to 1999
- 421980 to 1989
- 61970 to 1979
- 0Before 1970
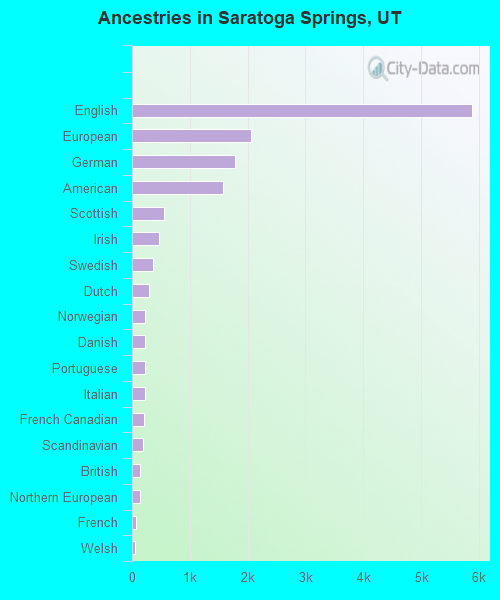
First ancestries reported:
- English: 5,882 (31.2%)
- European: 2,067 (11.0%)
- German: 1,776 (9.4%)
- American: 1,570 (8.3%)
- Scottish: 561 (3.0%)
- Irish: 473 (2.5%)
- Swedish: 362 (1.9%)
- Dutch: 296 (1.6%)
- Norwegian: 228 (1.2%)
- Danish: 228 (1.2%)
- Portuguese: 226 (1.2%)
- Italian: 220 (1.2%)
- French Canadian: 209 (1.1%)
- Scandinavian: 193 (1.0%)
- British: 137 (0.7%)
- Northern European: 131 (0.7%)
- French: 63 (0.3%)
- Welsh: 59 (0.3%)
- Yugoslavian: 45 (0.2%)
- Brazilian: 44 (0.2%)
- Polish: 43 (0.2%)
- New Zealander: 35 (0.2%)
- Russian: 26 (0.1%)
- South African: 21 (0.1%)
- Greek: 21 (0.1%)
- Czechoslovakian: 19 (0.1%)
- Hungarian: 17 (0.09%)
- Australian: 15 (0.08%)
- Scotch-Irish: 12 (0.06%)
- Swiss: 10 (0.05%)
- Canadian: 8 (0.04%)
- Icelander: 6 (0.03%)
- Croatian: 4 (0.02%)
Most common places of birth for foreign-born residents (%):
| Saratoga Springs: | 16.2% (366) |
| Utah: | 36.1% (99,740) |
| Saratoga Springs: | 15.6% (352) |
| Utah: | 3.0% (8,341) |
| Saratoga Springs: | 6.8% (154) |
| Utah: | 3.2% (8,804) |
| Saratoga Springs: | 6.5% (147) |
| Utah: | 2.0% (5,555) |
| Saratoga Springs: | 6.2% (139) |
| Utah: | 2.9% (7,901) |
| Saratoga Springs: | 6.1% (138) |
| Utah: | 0.2% (425) |
| Saratoga Springs: | 6.1% (138) |
| Utah: | 1.3% (3,479) |
| Saratoga Springs: | 5.7% (128) |
| Utah: | 2.8% (7,644) |
| Saratoga Springs: | 5.3% (120) |
| Utah: | 2.1% (5,902) |
| Saratoga Springs: | 4.7% (106) |
| Utah: | 0.2% (642) |
| Saratoga Springs: | 4.1% (93) |
| Utah: | 0.4% (996) |
| Saratoga Springs: | 3.1% (69) |
| Utah: | 2.3% (6,468) |
| Saratoga Springs: | 3.0% (68) |
| Utah: | 0.2% (497) |
| Saratoga Springs: | 2.7% (62) |
| Utah: | 2.9% (8,017) |
| Saratoga Springs: | 2.2% (49) |
| Utah: | 0.1% (307) |
| Saratoga Springs: | 1.7% (38) |
| Utah: | 3.0% (8,294) |
| Saratoga Springs: | 1.6% (36) |
| Utah: | 0.1% (141) |
| Saratoga Springs: | 1.6% (36) |
| Utah: | 2.6% (7,211) |
Place of birth for U.S.-born residents:
- This state: 26,832
- Other state: 12,751
- Northeast: 559
- Midwest: 1,451
- South: 1,624
- West: 9,114
86.4% of Saratoga Springs residents lived in the same house 1 years ago.
Out of people who lived in different houses, 31.3% lived in this county.
Out of people who lived in different counties, 64.3% lived in Utah.
| Saratoga Springs: | 86.4% |
| State average: | 85.7% |
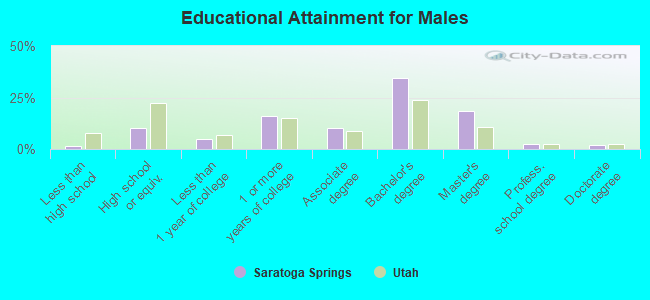
Education attainment for males 25 years and older:
- No schooling: 71
- Nursery to 4th grade: 0
- 5th and 6th grade: 0
- 7th and 8th grade: 0
- 9th grade: 7
- 10th grade: 0
- 11th grade: 0
- 12th grade, no diploma: 77
- High school graduate (or equivalency): 1,069
- Less than 1 year of college: 482
- Some college more than 1 year, no degree: 1,691
- Associate degree: 1,062
- Bachelor's degree: 3,590
- Master's degree: 1,911
- Professional school degree: 269
- Doctorate degree: 202
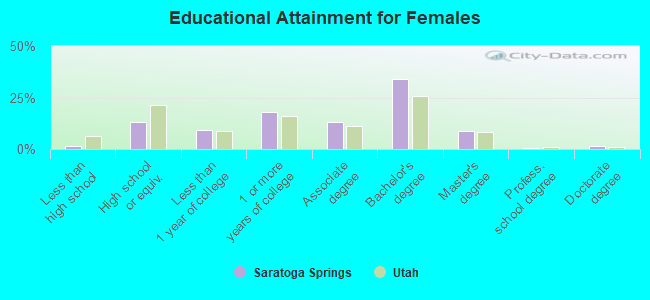
Education attainment for females 25 years and older:
- No schooling: 45
- Nursery to 4th grade: 0
- 5th and 6th grade: 8
- 7th and 8th grade: 0
- 9th grade: 0
- 10th grade: 20
- 11th grade: 0
- 12th grade, no diploma: 92
- High school graduate (or equivalency): 1,340
- Less than 1 year of college: 919
- Some college more than 1 year, no degree: 1,835
- Associate degree: 1,331
- Bachelor's degree: 3,409
- Master's degree: 878
- Professional school degree: 63
- Doctorate degree: 148
Housing units in structures:
- One, detached: 8,607
- One, attached: 1,630
- Two: 3
- 3 or 4: 124
- 5 to 9: 164
- 10 to 19: 465
- 20 to 49: 37
- 50 or more: 65
Housing units lacking complete kitchen facilities in 2022: 0.3%
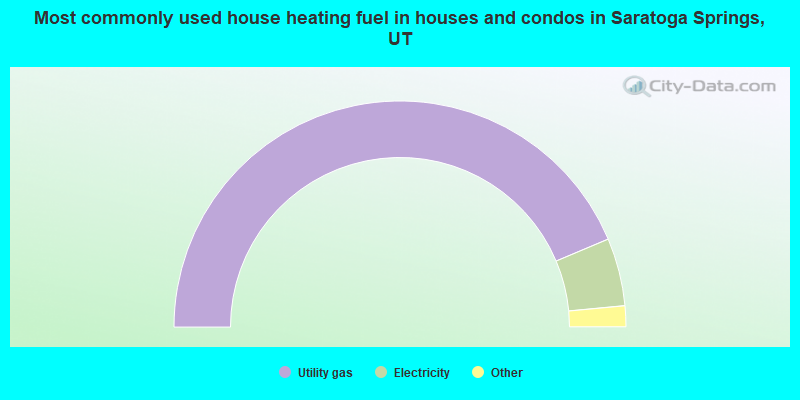
- 87.3%Utility gas
- 9.7%Electricity
- 2.2%Solar energy
- 0.8%Bottled, tank, or LP gas
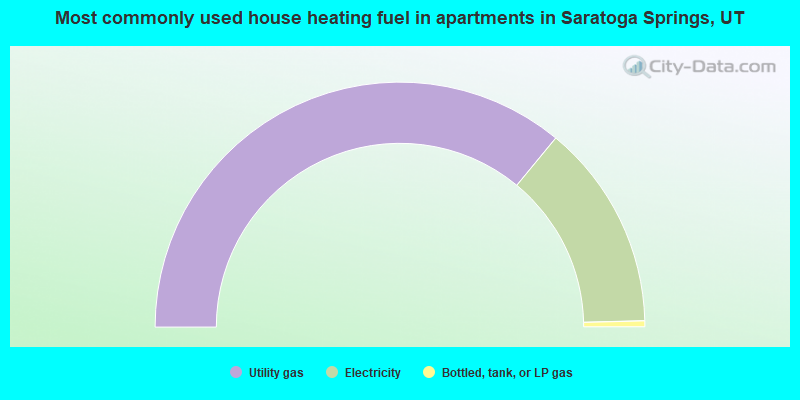
- 71.9%Utility gas
- 27.2%Electricity
- 0.8%Bottled, tank, or LP gas
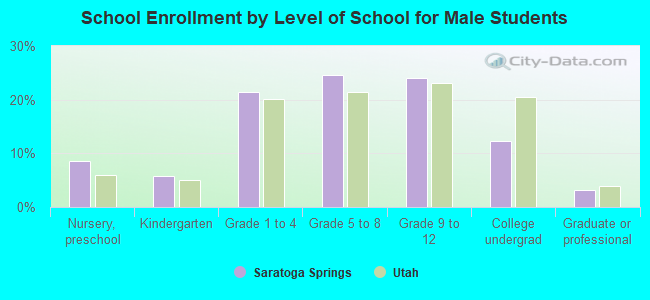
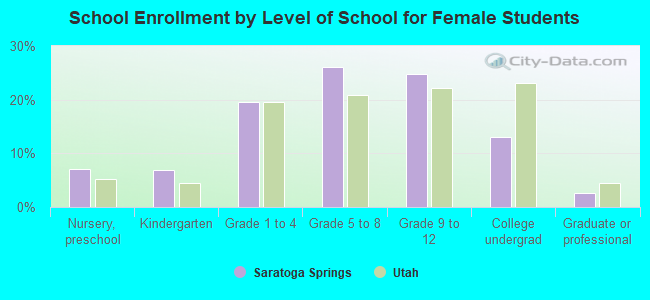
Private vs. public school enrollment:
| Here: | 7.4% |
| Utah: | 7.2% |
| Here: | 4.1% |
| Utah: | 5.3% |
| Here: | 21.4% |
| Utah: | 26.7% |