Santa Ynez Valley, CA (California) Houses and Residents
| Santa Ynez Valley: | $1,015,115 |
| California: | $715,900 |
Total population: 21,898 (Urban population: 14,689 (all inside urban clusters), Rural population: 7,170 (609 farm, 6,561 nonfarm))
Houses: 8,875 (8,255 occupied: 5,752 owner occupied, 2,503 renter occupied)
| % of renters here: | 30% |
| State: | 44% |
Housing density: 22 houses/condos per square mile
Median price asked for vacant for-sale houses and condos in 2022 in this county: $300,986.
Median contract rent in 2022: $1,883 (lower quartile is $1,285, upper quartile is over $2,000)
Median rent asked for vacant for-rent units in 2022: $1,917
Median gross rent in Santa Ynez Valley, CA in 2022: over $2,000
Housing units in Santa Ynez Valley with a mortgage: 3,148 (375 second mortgage, 431 home equity loan, 12 both second mortgage and home equity loan)
Houses without a mortgage: 1,057


Household type by relationship:
Households: 406,113- In family households: 328,096 (63,927 male householders, 27,673 female householders)
68,834 spouses, 113,869 children (107,701 natural, 2,244 adopted, 3,924 stepchildren), 9,655 grandchildren, 6,308 brothers or sisters, 4,394 parents, foster children, 11,429 other relatives, 17,914 non-relatives
- In nonfamily households: 78,017 (22,866 male householders (14,680 living alone)), 27,638 female householders (20,578 living alone)), 27,513 nonrelatives
- In group quarters: 17,782 (5,917 institutionalized population)
68,080 married couples with children.
18,812 single-parent households (4,951 men, 13,861 women).
79.3% of residents of Santa Ynez Valley speak English at home.
16.5% of residents speak Spanish at home (49% speak English very well, 23% speak English well, 17% speak English not well, 12% don't speak English at all).
3.2% of residents speak other Indo-European language at home (87% speak English very well, 8% speak English well, 5% speak English not well).
0.8% of residents speak Asian or Pacific Island language at home (37% speak English very well, 41% speak English well, 22% speak English not well).
0.2% of residents speak other language at home (35% speak English very well, 65% speak English well).
Foreign born population: 3,455 (14.2%)
(46.9% of them are naturalized citizens)
| Here: | 7.2 |
| State: | 6.0 |
| Here: | 5.2 |
| State: | 3.9 |

- Bedrooms in owner-occupied houses and condos in Santa Ynez Valley, California
- 66no bedroom
- 3621 bedroom
- 1,2412 bedrooms
- 2,7493 bedrooms
- 1,1484 bedrooms
- 1865+ bedrooms

- Bedrooms in renter-occupied apartments in Santa Ynez Valley, California
- 177no bedroom
- 7171 bedroom
- 8592 bedrooms
- 6043 bedrooms
- 1164 bedrooms
- 305+ bedrooms

- Cars and other vehicles available in Santa Ynez Valley in owner-occupied houses/condos
- 182no vehicle
- 1,2841 vehicle
- 2,6642 vehicles
- 1,0783 vehicles
- 3624 vehicles
- 1825+ vehicles

- Cars and other vehicles available in Santa Ynez Valley in renter-occupied apartments
- 167no vehicle
- 1,0161 vehicle
- 7512 vehicles
- 4103 vehicles
- 1304 vehicles
- 295+ vehicles

- Rooms in owner-occupied houses in Santa Ynez Valley, California
- 351 room
- 942 rooms
- 3253 rooms
- 5764 rooms
- 1,0535 rooms
- 1,4506 rooms
- 1,2577 rooms
- 5198 rooms
- 4439+ rooms

- Rooms in renter-occupied apartments in Santa Ynez Valley, California
- 1601 room
- 3282 rooms
- 4583 rooms
- 5354 rooms
- 4695 rooms
- 3186 rooms
- 1337 rooms
- 598 rooms
- 439+ rooms


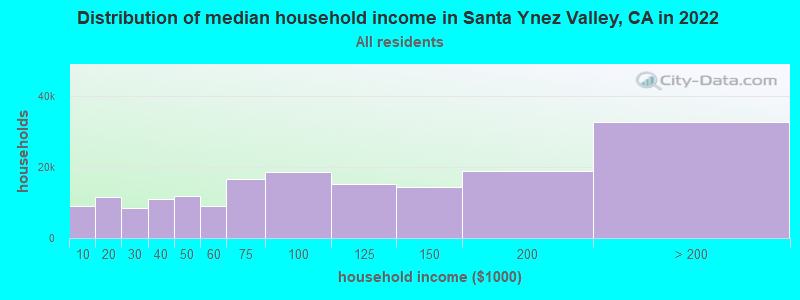
Santa Ynez Valley, CA household income distribution

- 8,894Less than $10,000
- 11,586$10,000 to $19,999
- 8,440$20,000 to $29,999
- 11,026$30,000 to $39,999
- 11,946$40,000 to $49,999
- 9,114$50,000 to $59,999
- 16,658$60,000 to $74,999
- 18,491$75,000 to $99,999
- 15,316$100,000 to $124,999
- 14,249$125,000 to $149,999
- 18,981$150,000 to $199,999
- 32,648$200,000 or more
Percentage of workers working in this county: 94.0%
Number of people working at home: 1,613 (13.4% of all workers)
Travel time to work (commute)
- Less than 5 minutes: 938
- 5 to 9 minutes: 1,640
- 10 to 14 minutes: 1,507
- 15 to 19 minutes: 1,109
- 20 to 24 minutes: 673
- 25 to 29 minutes: 206
- 30 to 34 minutes: 788
- 35 to 39 minutes: 547
- 40 to 44 minutes: 639
- 45 to 59 minutes: 1,055
- 60 to 89 minutes: 248
- 90 or more minutes: 234
Means of transportation to work:
- Drove a car alone: 7,344 (70.1%)
- Carpooled: 1,357 (13.0%)
- Bus or trolley bus: 86 (0.8%)
- Taxi: 1 (0.0%)
- Motorcycle: 45 (0.4%)
- Bicycle: 65 (0.6%)
- Walked: 654 (6.2%)
- Other means: 32 (0.3%)
- Worked at home: 890 (8.5%)


- Year of entry for the foreign-born population in Santa Ynez Valley, California
- 5151995 to March 2000
- 4251990 to 1994
- 4611985 to 1989
- 3651980 to 1984
- 3231975 to 1979
- 1871970 to 1974
- 2181965 to 1969
- 639Before 1965
Most common places of birth for foreign-born residents (%):
| Santa Ynez Valley: | 59.0% (1,849) |
| California: | 44.3% (3,928,701) |
| Santa Ynez Valley: | 6.6% (207) |
| California: | 1.6% (141,181) |
| Santa Ynez Valley: | 6.2% (193) |
| California: | 1.5% (133,090) |
| Santa Ynez Valley: | 5.7% (178) |
| California: | 0.2% (18,478) |
| Santa Ynez Valley: | 4.2% (132) |
| California: | 1.1% (98,160) |
| Santa Ynez Valley: | 2.2% (68) |
| California: | 1.7% (151,775) |
Place of birth for U.S.-born residents:
- This state: 12,232
- Other state: 6,323
- Northeast: 1,425
- Midwest: 2,457
- South: 1,228
- West: 1,213
54% of Santa Ynez Valley residents lived in the same house 5 years ago.
Out of people who lived in different houses, 65% lived in this county.
Out of people who lived in different counties, 61% lived in California.
Education attainment for males 25 years and older:
- No schooling: 123
- Nursery to 4th grade: 112
- 5th and 6th grade: 233
- 7th and 8th grade: 113
- 9th grade: 107
- 10th grade: 87
- 11th grade: 88
- 12th grade, no diploma: 227
- High school graduate (or equivalency): 1,259
- Less than 1 year of college: 505
- Some college more than 1 year, no degree: 1,377
- Associate degree: 480
- Bachelor's degree: 1,377
- Master's degree: 617
- Professional school degree: 324
- Doctorate degree: 138

Education attainment for females 25 years and older:
- No schooling: 51
- Nursery to 4th grade: 53
- 5th and 6th grade: 205
- 7th and 8th grade: 70
- 9th grade: 86
- 10th grade: 170
- 11th grade: 85
- 12th grade, no diploma: 205
- High school graduate (or equivalency): 1,673
- Less than 1 year of college: 671
- Some college more than 1 year, no degree: 1,704
- Associate degree: 610
- Bachelor's degree: 1,582
- Master's degree: 514
- Professional school degree: 122
- Doctorate degree: 50


Housing units in structures:
- One, detached: 6,566
- One, attached: 352
- Two: 196
- 3 or 4: 156
- 5 to 9: 217
- 10 to 19: 166
- 20 to 49: 188
- 50 or more: 14
- Mobile homes: 958
- Boats, RVs, vans, etc.: 62
Median worth of mobile homes: $145,531
Housing units lacking complete kitchen facilities: 1.0%

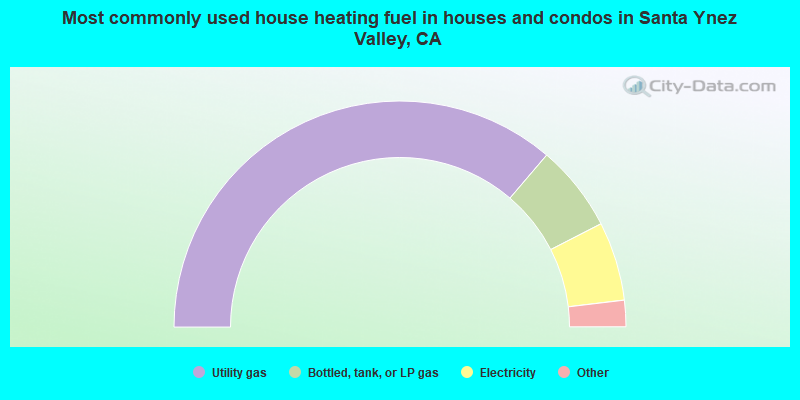
- 72.5%Utility gas
- 12.4%Bottled, tank, or LP gas
- 11.3%Electricity
- 2.5%Wood
- 0.9%Other fuel
- 0.3%No fuel used
- 0.1%Fuel oil, kerosene, etc.
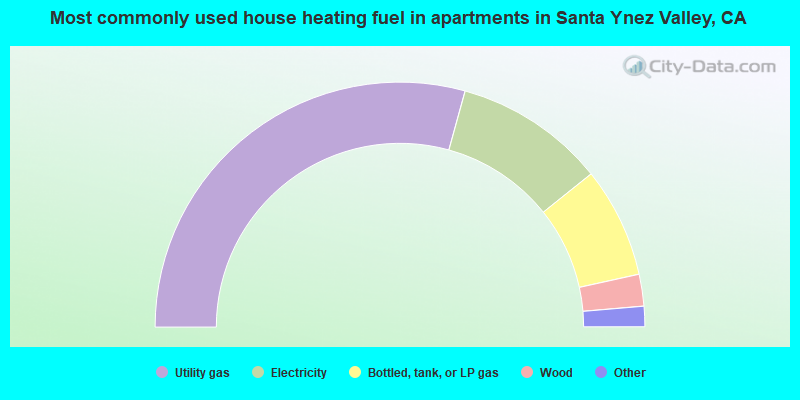
- 58.6%Utility gas
- 19.9%Electricity
- 14.6%Bottled, tank, or LP gas
- 4.2%Wood
- 1.4%No fuel used
- 1.2%Other fuel
- 0.2%Solar energy
Private vs. public school enrollment:
| Here: | 11.2% |
| California: | 9.9% |
| Here: | 7.0% |
| California: | 7.8% |
| Here: | 9.9% |
| California: | 15.4% |


