Housing density: 1,817 houses/condos per square mile
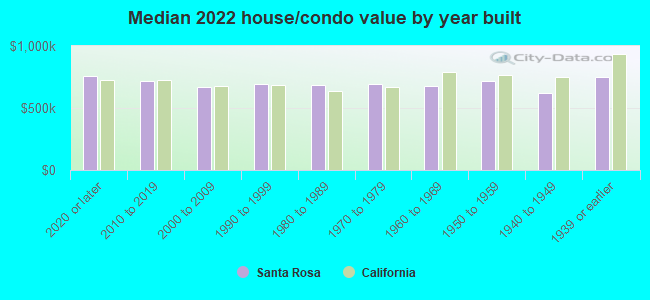
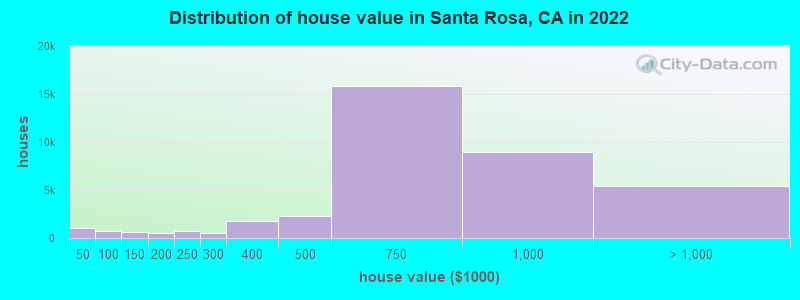
Median price asked for vacant for-sale houses and condos in 2022: $690,556.
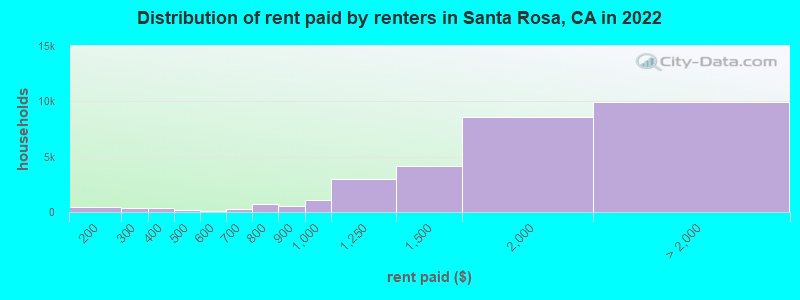
Median contract rent in 2022: $1,701 (lower quartile is $1,262, upper quartile is over $2,000)
Median rent asked for vacant for-rent units in 2022: $3,355
Median gross rent in Santa Rosa, CA in 2022: $1,886
Housing units in Santa Rosa with a mortgage: 25,600 (2,534 second mortgage, 289 home equity loan, 1,983 both second mortgage and home equity loan) Houses without a mortgage: 173
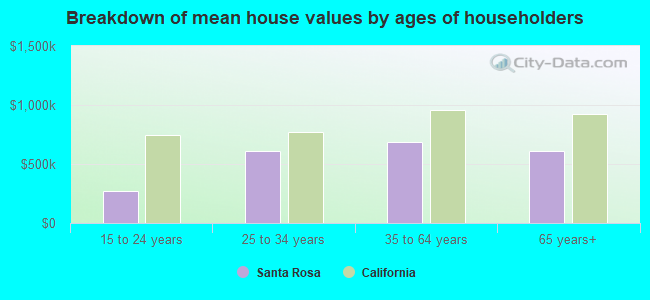
Median household income for houses/condos with a mortgage: $139,159
Median household income for apartments without a mortgage: $69,396
21,834 married couples with children.
10,952 single-parent households (4,500 men, 6,452 women).
65.9% of residents of Santa Rosa speak English at home.
26.8% of residents speak Spanish at home (55% speak English very well, 21% speak English well, 17% speak English not well, 8% don't speak English at all).
3.3% of residents speak other Indo-European language at home (64% speak English very well, 26% speak English well, 10% speak English not well, 1% don't speak English at all).
3.3% of residents speak Asian or Pacific Island language at home (50% speak English very well, 29% speak English well, 14% speak English not well, 7% don't speak English at all).
0.9% of residents speak other language at home (62% speak English very well, 26% speak English well, 6% speak English not well, 6% don't speak English at all).
Foreign born population: 35,926 (20.3%)
(43.2% of them are naturalized citizens)
Percentage of workers working in this county: 92.7% Number of people working at home: 9,736 (10.7% of all workers)
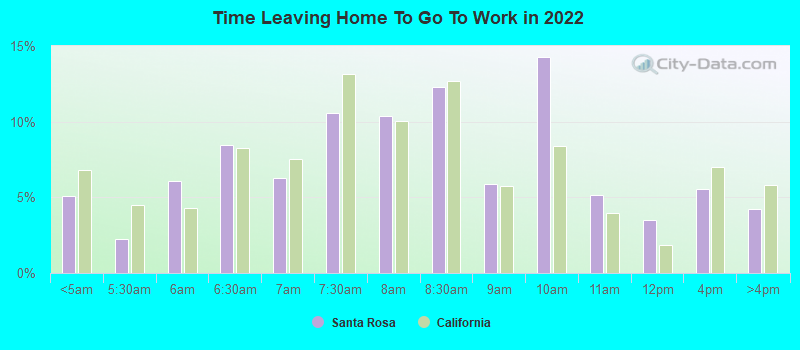
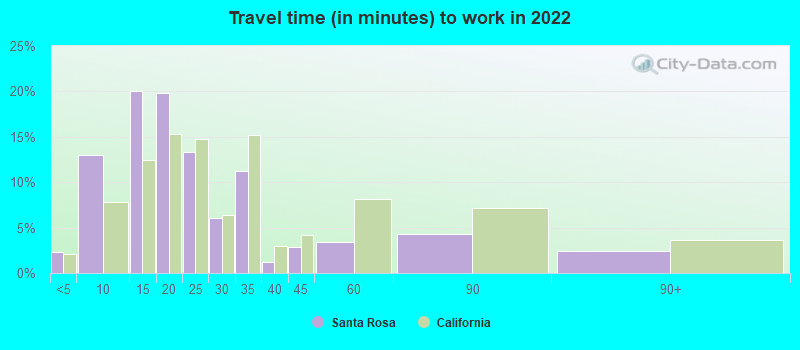
Travel time to work (commute)
Less than 5 minutes: 1,332
5 to 9 minutes: 8,945
10 to 14 minutes: 17,821
15 to 19 minutes: 17,290
20 to 24 minutes: 8,467
25 to 29 minutes: 5,264
30 to 34 minutes: 10,250
35 to 39 minutes: 1,790
40 to 44 minutes: 1,637
45 to 59 minutes: 4,057
60 to 89 minutes: 3,009
90 or more minutes: 1,342
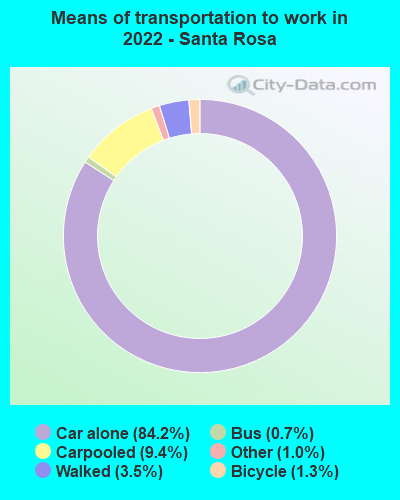
Means of transportation to work:
Drove a car alone: 65,823 (74.9%)
Carpooled: 7,316 (8.3%)
Bus: 549 (0.6%)
Taxi: 776 (0.9%)
Bicycle: 979 (1.1%)
Walked: 2,759 (3.1%)
Worked at home: 9,736 (11.1%)
Unemployment by race in 2022
Unemployment rate for White non-Hispanic residents
3.5%Males
3.9%Females
Unemployment rate for Black residents
6.6%Males
12.8%Females
Unemployment rate for American Indian and Alaska Native residents
1.6%Males
2.1%Females
Unemployment rate for Asian residents
0.8%Females
Unemployment rate for other race residents
2.6%Males
4.0%Females
Unemployment rate for two or more race residents
9.5%Males
3.2%Females
Unemployment rate for Hispanic or Latino residents
3.6%Males
2.9%Females
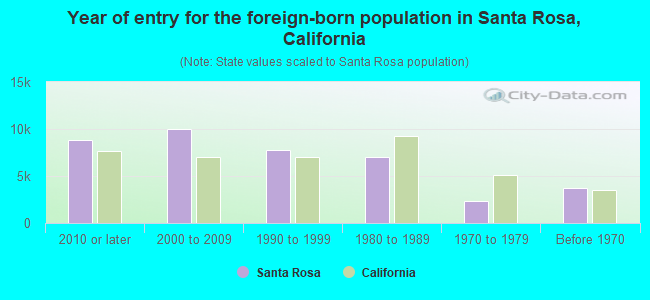
Year of entry for the foreign-born population in Santa Rosa, California
8,7792010 or later
10,0262000 to 2009
7,7401990 to 1999
7,0701980 to 1989
2,2961970 to 1979
3,765Before 1970
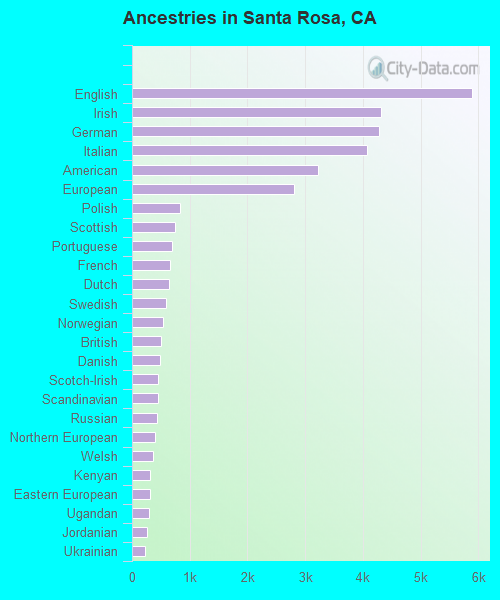
First ancestries reported:
English: 5,891 (6.5%)
Irish: 4,322 (4.8%)
German: 4,278 (4.7%)
Italian: 4,080 (4.5%)
American: 3,225 (3.6%)
European: 2,800 (3.1%)
Polish: 831 (0.9%)
Scottish: 739 (0.8%)
Portuguese: 686 (0.8%)
French: 666 (0.7%)
Dutch: 637 (0.7%)
Swedish: 582 (0.6%)
Norwegian: 544 (0.6%)
British: 502 (0.6%)
Danish: 482 (0.5%)
Scotch-Irish: 452 (0.5%)
Scandinavian: 450 (0.5%)
Russian: 436 (0.5%)
Northern European: 405 (0.4%)
Welsh: 366 (0.4%)
Kenyan: 313 (0.3%)
Eastern European: 307 (0.3%)
Ugandan: 301 (0.3%)
Jordanian: 259 (0.3%)
Ukrainian: 219 (0.2%)
Finnish: 203 (0.2%)
Iranian: 197 (0.2%)
Ethiopian: 181 (0.2%)
French Canadian: 180 (0.2%)
Hungarian: 176 (0.2%)
Canadian: 167 (0.2%)
Armenian: 161 (0.2%)
Greek: 136 (0.2%)
Romanian: 124 (0.1%)
Austrian: 123 (0.1%)
African: 121 (0.1%)
Basque: 113 (0.1%)
Swiss: 113 (0.1%)
Lithuanian: 106 (0.1%)
Palestinian: 105 (0.1%)
Brazilian: 69 (0.08%)
Yugoslavian: 65 (0.07%)
Czech: 64 (0.07%)
Lebanese: 54 (0.06%)
Celtic: 45 (0.05%)
Cajun: 41 (0.05%)
Bulgarian: 41 (0.05%)
Nigerian: 33 (0.04%)
Sierra Leonean: 30 (0.03%)
Belgian: 30 (0.03%)
Croatian: 30 (0.03%)
Slavic: 30 (0.03%)
Haitian: 27 (0.03%)
Israeli: 21 (0.02%)
Estonian: 18 (0.02%)
Liberian: 16 (0.02%)
Australian: 14 (0.02%)
Trinidadian and Tobagonian: 11 (0.01%)
Guyanese: 7 (0.01%)
Latvian: 6 (0.01%)
Icelander: 5 (0.01%)
South African: 5 (0.01%)
Czechoslovakian: 5 (0.01%)
Most common places of birth for foreign-born residents (%):
Mexico
Santa Rosa:
56.0% (20,754)
California:
37.2% (3,881,193)
Philippines
Santa Rosa:
4.5% (1,682)
California:
7.8% (818,297)
Vietnam
Santa Rosa:
3.2% (1,173)
California:
4.9% (512,335)
El Salvador
Santa Rosa:
3.0% (1,126)
California:
4.2% (440,287)
India
Santa Rosa:
2.8% (1,034)
California:
5.2% (539,184)
China, excluding Hong Kong and Taiwan
Santa Rosa:
2.0% (756)
California:
6.6% (684,672)
Canada
Santa Rosa:
1.6% (603)
California:
1.2% (127,477)
Germany
Santa Rosa:
1.6% (591)
California:
0.7% (73,304)
Place of birth for U.S.-born residents:
This state: 108,958
Other state: 31,138
Northeast: 5,853
Midwest: 9,570
South: 7,203
West: 8,512
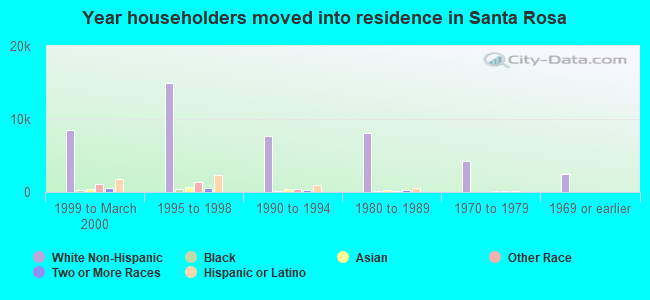
88.4% of Santa Rosa residents lived in the same house 1 years ago. Out of people who lived in different houses, 39.7% lived in this county. Out of people who lived in different counties, 67.8% lived in California.
Santa Rosa:
88.4%
State average:
88.9%
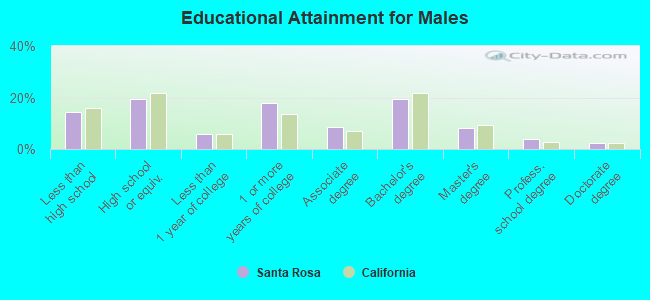
Education attainment for males 25 years and older:
No schooling: 1,601
Nursery to 4th grade: 901
5th and 6th grade: 1,691
7th and 8th grade: 495
9th grade: 466
10th grade: 899
11th grade: 318
12th grade, no diploma: 2,508
High school graduate (or equivalency): 11,927
Less than 1 year of college: 3,611
Some college more than 1 year, no degree: 10,890
Associate degree: 5,165
Bachelor's degree: 11,922
Master's degree: 5,023
Professional school degree: 2,413
Doctorate degree: 1,445
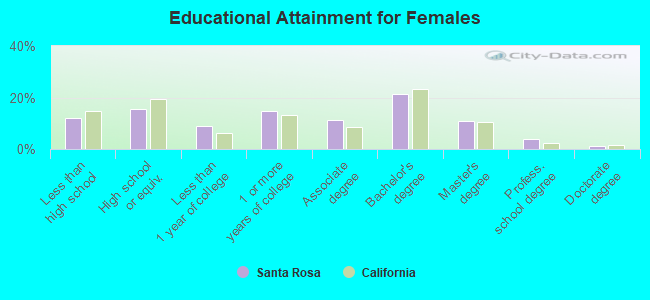
Education attainment for females 25 years and older:
No schooling: 1,429
Nursery to 4th grade: 685
5th and 6th grade: 1,464
7th and 8th grade: 615
9th grade: 678
10th grade: 667
11th grade: 232
12th grade, no diploma: 2,236
High school graduate (or equivalency): 10,264
Less than 1 year of college: 6,021
Some college more than 1 year, no degree: 9,870
Associate degree: 7,549
Bachelor's degree: 14,113
Master's degree: 7,215
Professional school degree: 2,485
Doctorate degree: 744
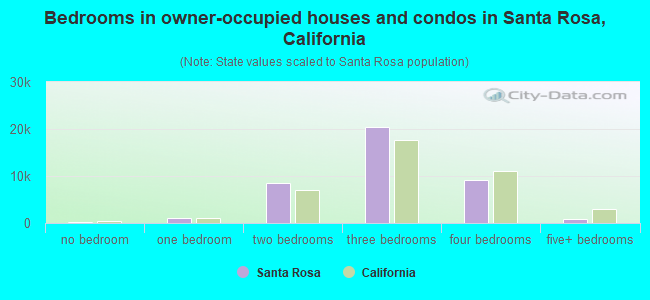
Housing units in structures:
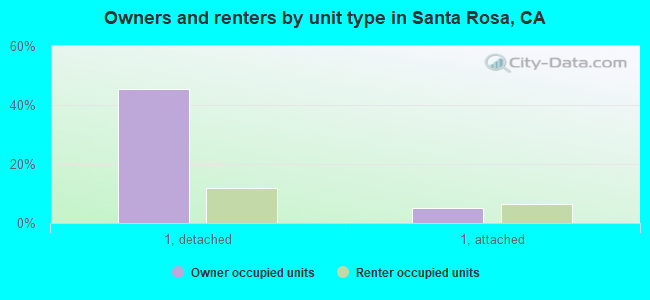
One, detached: 41,579
One, attached: 8,392
Two: 2,840
3 or 4: 4,162
5 to 9: 3,137
10 to 19: 3,968
20 to 49: 1,534
50 or more: 3,522
Mobile homes: 3,636
Boats, RVs, vans, etc.: 149
Median worth of mobile homes: $173,100
Housing units lacking complete plumbing facilities in 2022: 0.4%
Housing units lacking complete kitchen facilities in 2022: 2.9%
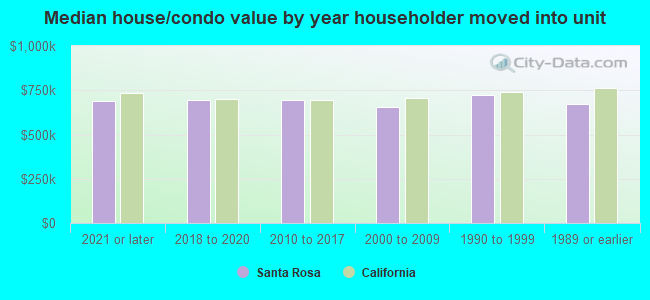
House/condo owner moved in on average 11 years ago