Santa Maria, CA (California) Houses and Residents
Estimated median house or condo value in 2022: $547,200 (it was $140,000 in 2000 )
Santa Maria:
$547,200California:
$715,900
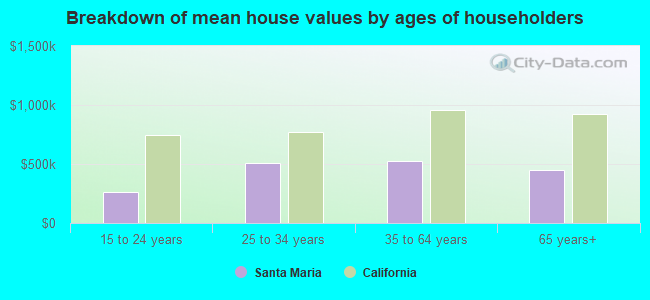
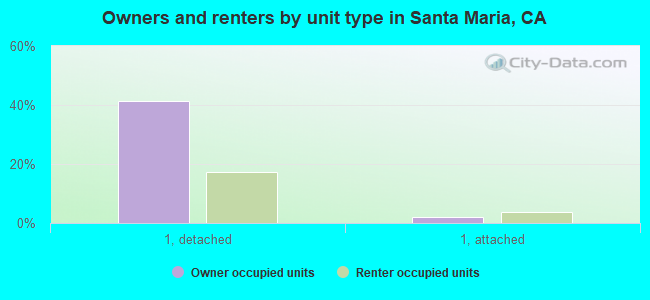
Lower value quartile - upper value quartile: $413,100 - $674,400Mean price in 2022: Detached houses: $549,403 Here:
$549,403State:
$988,808
Townhouses or other attached units: $383,013 Here:
$383,013State:
$838,546
In 2-unit structures: $118,345 Here:
$118,345State:
$1,138,100
In 3-to-4-unit structures: $470,035 Here:
$470,035State:
$824,253
In 5-or-more-unit structures: $247,387 Here:
$247,387State:
$730,996
Mobile homes: $104,436 Here:
$104,436State:
$184,506
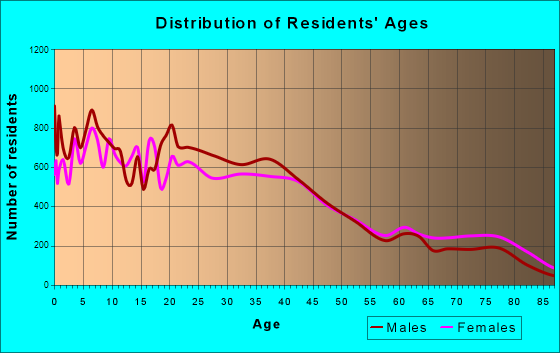
Total population: 103,410 (Urban population: 76,937, Rural population: 176 (all nonfarm) )
Houses: 29,910 (28,907 occupied: 14,336 owner occupied, 14,571 renter occupied )
% of renters here:
50%State:
44%
Housing density: 1,548 houses/condos per square mile
Median price asked for vacant for-sale houses and condos in 2022: $429,127.
Median contract rent in 2022: $1,632 (lower quartile is $1,311, upper quartile is over $2,000)
Median rent asked for vacant for-rent units in 2022: $1,916
Median gross rent in Santa Maria, CA in 2022: $1,799
Housing units in Santa Maria with a mortgage: 9,206 (831 second mortgage, 249 home equity loan, 463 both second mortgage and home equity loan )Houses without a mortgage: 218
Median household income for houses/condos with a mortgage: $106,326
Median household income for apartments without a mortgage: $78,854
Median monthly housing costs: $1,655
Data:
Median house or condo value ($)
Median house or condo value ($ change since 2000)
Median house or condo value ($) - White
Median house or condo value ($) - Black or African American
Median house or condo value ($) - Asian
Median house or condo value ($) - Hispanic or Latino
Median house or condo value ($) - American Indian and Alaska Native
Median house or condo value ($) - Multirace
Median house or condo value ($) - Other Race
Median price asked for mobile homes ($)
Household density (households per square mile)
Mean house or condo value by units in structure - 1, detached ($)
Mean house or condo value by units in structure - 1, attached ($)
Mean house or condo value by units in structure - 2 ($)
Mean house or condo value by units in structure by units in structure - 3 or 4 ($)
Mean house or condo value by units in structure - 5 or more ($)
Mean house or condo value by units in structure - Boat, RV, van, etc. ($)
Mean house or condo value by units in structure - Mobile home ($)
Median contract rent ($)
Median contract rent - Lower quartile ($)
Median contract rent - Upper quartile ($)
Median gross rent ($)
Urban houses (%)
Rural houses (%)
Houses occupied (%)
Houses occupied (% change since 2000)
Houses owner occupied (%)
Houses owner occupied (% change since 2000)
Houses renter occupied (%)
Houses renter occupied (% change since 2000)
Vacant housing units - For rent (%)
Vacant housing units - For rent (% change since 2000)
Vacant housing units - For sale only (%)
Vacant housing units - For sale only (% change since 2000)
Vacant housing units - Rented or sold, not occupied (%)
Vacant housing units - Rented or sold, not occupied (% change since 2000)
Vacant housing units - For seasonal, recreational, or occasional use (%)
Vacant housing units - For seasonal, recreational, or occasional use (% change since 2000)
Vacant housing units - For migrant workers (%)
Vacant housing units - For migrant workers (% change since 2000)
Vacant housing units - Other vacant (%)
Vacant housing units - Other vacant (% change since 2000)
Median monthly housing costs ($)
Median household income for houses/condos with a mortgage ($)
Median household income for houses/condos without a mortgage ($)
Median household income ($)
Median household income ($) - White
Median household income ($) - Black or African American
Median household income ($) - Asian
Median household income ($) - Hispanic or Latino
Median household income ($) - American Indian and Alaska Native
Median household income ($) - Multirace
Median household income ($) - Other Race
Mortgage status - with mortgage (%)
Mortgage status - with second mortgage (%)
Mortgage status - with home equity loan (%)
Mortgage status - with both second mortgage and home equity loan (%)
Mortgage status - without a mortgage (%)
Median year house/condo built
Median year apartment built
Household type by relationship - Male householder living alone (%)
Household type by relationship - Male householder not living alone (%)
Household type by relationship - Female householder living alone (%)
Household type by relationship - Female householder not living alone (%)
Household type by relationship - Opposite-Sex spouse (%)
Household type by relationship - Same-Sex spouse (%)
Household type by relationship - Opposite-Sex unmarried partner (%)
Household type by relationship - Same-Sex unmarried partner (%)
Household type by relationship - In group quarters (%)
Size of family households - 2-person household (%)
Size of family households - 3-person household (%)
Size of family households - 4-person household (%)
Size of family households - 5-person household (%)
Size of family households - 6-person household (%)
Size of family households - 7-or-more-person household (%)
Size of nonfamily households - 1-person household (%)
Size of nonfamily households - 2-person household (%)
Size of nonfamily households - 3-person household (%)
Size of nonfamily households - 4-person household (%)
Size of nonfamily households - 5-person household (%)
Size of nonfamily households - 6-person household (%)
Size of nonfamily households - 7-or-moreperson household (%)
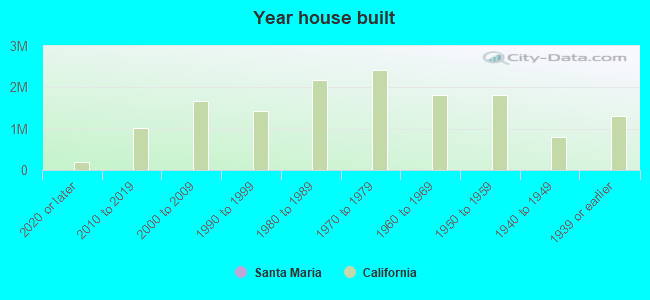
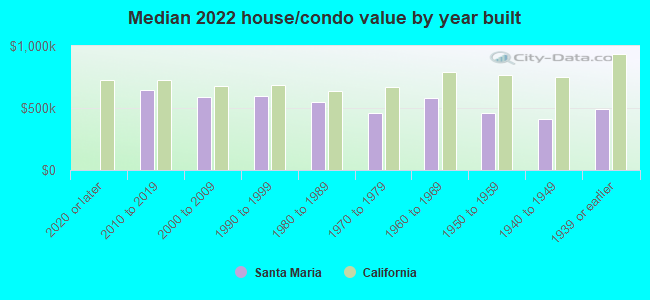
Year house built - Built 2010 or later (%)
Year house built - Built 2000 to 2009 (%)
Year house built - Built 1990 to 1999 (%)
Year house built - Built 1980 to 1989 (%)
Year house built - Built 1970 to 1979 (%)
Year house built - Built 1960 to 1969 (%)
Year house built - Built 1950 to 1959 (%)
Year house built - Built 1940 to 1949 (%)
Year house built - Built 1939 or earlier (%)
Median number of rooms in houses and condos
Median number of rooms in apartments
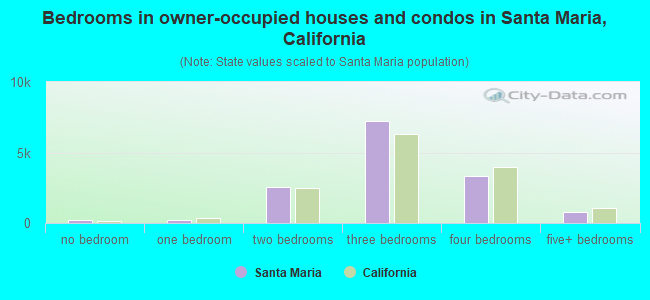
Median number of bedrooms in owner occupied houses
Mean number of bedrooms in owner occupied houses
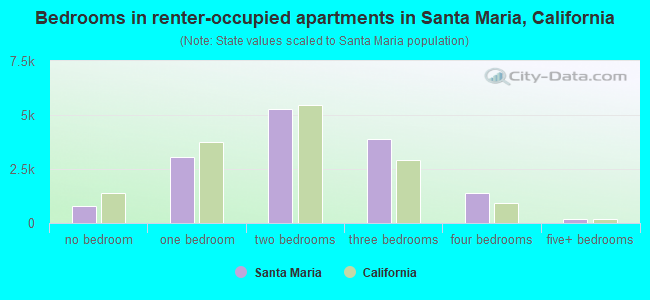
Median number of bedrooms in renter occupied houses
Mean number of bedrooms in renter occupied houses
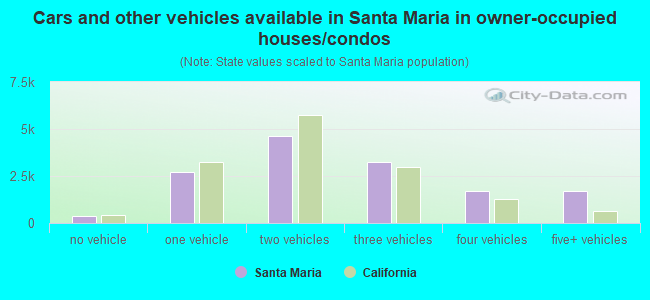
Median number of vehichles in owner occupied houses
Mean number of vehichles in owner occupied houses
Median number of vehichles in renter occupied houses
Mean number of vehichles in renter occupied houses
Rooms in owner-occupied houses - 1 room (%)
Rooms in owner-occupied houses - 2 rooms (%)
Rooms in owner-occupied houses - 3 rooms (%)
Rooms in owner-occupied houses - 4 rooms (%)
Rooms in owner-occupied houses - 5 rooms (%)
Rooms in owner-occupied houses - 6 rooms (%)
Rooms in owner-occupied houses - 7 rooms (%)
Rooms in owner-occupied houses - 8 rooms (%)
Rooms in owner-occupied houses - 9+ rooms (%)
Rooms in renter-occupied houses - 1 room (%)
Rooms in renter-occupied houses - 2 rooms (%)
Rooms in renter-occupied houses - 3 rooms (%)
Rooms in renter-occupied houses - 4 rooms (%)
Rooms in renter-occupied houses - 5 rooms (%)
Rooms in renter-occupied houses - 6 rooms (%)
Rooms in renter-occupied houses - 7 rooms (%)
Rooms in renter-occupied houses - 8 rooms (%)
Rooms in renter-occupied houses - 9+ rooms (%)
Bedrooms in owner-occupied houses - no bedrooms (%)
Bedrooms in owner-occupied houses - 1 bedroom (%)
Bedrooms in owner-occupied houses - 2 bedrooms (%)
Bedrooms in owner-occupied houses - 3 bedrooms (%)
Bedrooms in owner-occupied houses - 4 bedrooms (%)
Bedrooms in owner-occupied houses - 5+ bedrooms (%)
Bedrooms in renter-occupied houses - no bedrooms (%)
Bedrooms in renter-occupied houses - 1 bedroom (%)
Bedrooms in renter-occupied houses - 2 bedrooms (%)
Bedrooms in renter-occupied houses - 3 bedrooms (%)
Bedrooms in renter-occupied houses - 4 bedrooms (%)
Bedrooms in renter-occupied houses - 5+ bedrooms (%)
Vehicles available in owner-occupied houses - no vehicle available (%)
Vehicles available in owner-occupied houses - 1 vehicle available(%)
Vehicles available in owner-occupied houses - 2 Vehicles available (%)
Vehicles available in owner-occupied houses - 3 Vehicles available (%)
Vehicles available in owner-occupied houses - 4 Vehicles available (%)
Vehicles available in owner-occupied houses - 5+ Vehicles available (%)
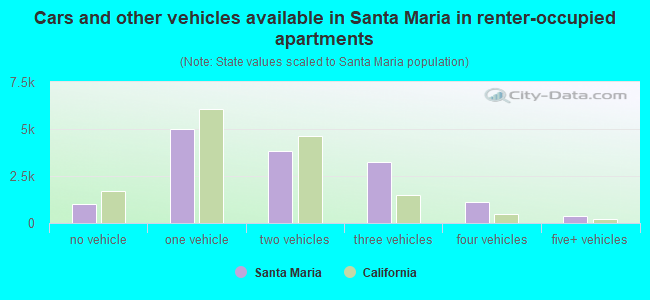
Vehicles available in renter-occupied houses - no vehicle available (%)
Vehicles available in renter-occupied houses - 1 vehicle available (%)
Vehicles available in renter-occupied houses - 2 Vehicles available (%)
Vehicles available in renter-occupied houses - 3 Vehicles available (%)
Vehicles available in renter-occupied houses - 4 Vehicles available (%)
Vehicles available in renter-occupied houses - 5+ Vehicles available (%)
Housing units in structures - 1, detached (%)
Housing units in structures - 1, attached (%)
Housing units in structures - 2 (%)
Housing units in structures - 3 or 4 (%)
Housing units in structures - 5 to 9 (%)
Housing units in structures - 10 to 19 (%)
Housing units in structures - 20 to 49 (%)
Housing units in structures - 50 or more (%)
Housing units in structures - Mobile home (%)
Housing units in structures - Boat, RV, van, etc. (%)
Housing units in structures - Owners - 1, detached (%)
Housing units in structures - Owners - 1, attached (%)
Housing units in structures - Owners - 2 (%)
Housing units in structures - Owners - 3 or 4 (%)
Housing units in structures - Owners - 5 to 9 (%)
Housing units in structures - Owners - 10 to 19 (%)
Housing units in structures - Owners - 20 to 49 (%)
Housing units in structures - Owners - 50 or more (%)
Housing units in structures - Owners - Mobile home (%)
Housing units in structures - Owners - Boat, RV, van, etc. (%)
Housing units in structures - Renters - 1, detached (%)
Housing units in structures - Renters - 1, attached (%)
Housing units in structures - Renters - 2 (%)
Housing units in structures - Renters - 3 or 4 (%)
Housing units in structures - Renters - 5 to 9 (%)
Housing units in structures - Renters - 10 to 19 (%)
Housing units in structures - Renters - 20 to 49 (%)
Housing units in structures - Renters - 50 or more (%)
Housing units in structures - Renters - Mobile home (%)
Housing units in structures - Renters - Boat, RV, van, etc. (%)
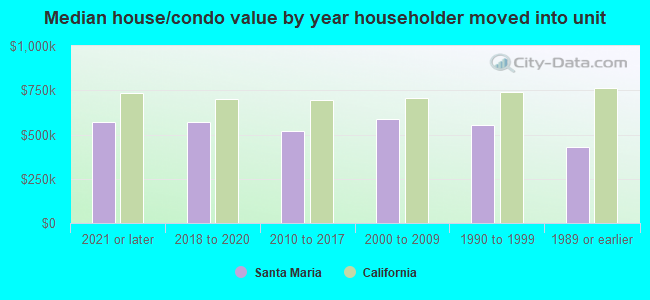
House/condo owner moved in on average (years ago)
Renter moved in on average (years ago)
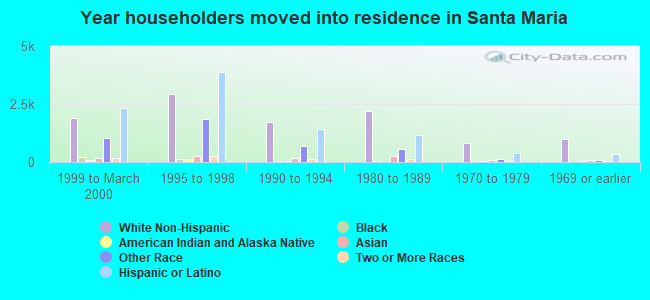
Year householder moved into unit - Moved in 1999 to March 2000 (%)
Year householder moved into unit - Moved in 1999 to March 2000 (%) - White
Year householder moved into unit - Moved in 1999 to March 2000 (%) - Black or African American
Year householder moved into unit - Moved in 1999 to March 2000 (%) - Asian
Year householder moved into unit - Moved in 1999 to March 2000 (%) - Hispanic or Latino
Year householder moved into unit - Moved in 1999 to March 2000 (%) - American Indian and Alaska Native
Year householder moved into unit - Moved in 1999 to March 2000 (%) - Multirace
Year householder moved into unit - Moved in 1999 to March 2000 (%) - Other Race
Year householder moved into unit - Moved in 1995 to 1998 (%)
Year householder moved into unit - Moved in 1995 to 1998 (%) - White
Year householder moved into unit - Moved in 1995 to 1998 (%) - Black or African American
Year householder moved into unit - Moved in 1995 to 1998 (%) - Asian
Year householder moved into unit - Moved in 1995 to 1998 (%) - Hispanic or Latino
Year householder moved into unit - Moved in 1995 to 1998 (%) - American Indian and Alaska Native
Year householder moved into unit - Moved in 1995 to 1998 (%) - Multirace
Year householder moved into unit - Moved in 1995 to 1998 (%) - Other Race
Year householder moved into unit - Moved in 1990 to 1994 (%)
Year householder moved into unit - Moved in 1990 to 1994 (%) - White
Year householder moved into unit - Moved in 1990 to 1994 (%) - Black or African American
Year householder moved into unit - Moved in 1990 to 1994 (%) - Asian
Year householder moved into unit - Moved in 1990 to 1994 (%) - Hispanic or Latino
Year householder moved into unit - Moved in 1990 to 1994 (%) - American Indian and Alaska Native
Year householder moved into unit - Moved in 1990 to 1994 (%) - Multirace
Year householder moved into unit - Moved in 1990 to 1994 (%) - Other Race
Year householder moved into unit - Moved in 1980 to 1989 (%)
Year householder moved into unit - Moved in 1980 to 1989 (%) - White
Year householder moved into unit - Moved in 1980 to 1989 (%) - Black or African American
Year householder moved into unit - Moved in 1980 to 1989 (%) - Asian
Year householder moved into unit - Moved in 1980 to 1989 (%) - Hispanic or Latino
Year householder moved into unit - Moved in 1980 to 1989 (%) - American Indian and Alaska Native
Year householder moved into unit - Moved in 1980 to 1989 (%) - Multirace
Year householder moved into unit - Moved in 1980 to 1989 (%) - Other Race
Year householder moved into unit - Moved in 1970 to 1979 (%)
Year householder moved into unit - Moved in 1970 to 1979 (%) - White
Year householder moved into unit - Moved in 1970 to 1979 (%) - Black or African American
Year householder moved into unit - Moved in 1970 to 1979 (%) - Asian
Year householder moved into unit - Moved in 1970 to 1979 (%) - Hispanic or Latino
Year householder moved into unit - Moved in 1970 to 1979 (%) - American Indian and Alaska Native
Year householder moved into unit - Moved in 1970 to 1979 (%) - Multirace
Year householder moved into unit - Moved in 1970 to 1979 (%) - Other Race
Year householder moved into unit - Moved in 1969 or earlier (%)
Year householder moved into unit - Moved in 1969 or earlier (%) - White
Year householder moved into unit - Moved in 1969 or earlier (%) - Black or African American
Year householder moved into unit - Moved in 1969 or earlier (%) - Asian
Year householder moved into unit - Moved in 1969 or earlier (%) - Hispanic or Latino
Year householder moved into unit - Moved in 1969 or earlier (%) - American Indian and Alaska Native
Year householder moved into unit - Moved in 1969 or earlier (%) - Multirace
Year householder moved into unit - Moved in 1969 or earlier (%) - Other Race
Housing units lacking complete plumbing facilities (%)
Housing units lacking complete kitchen facilities (%)
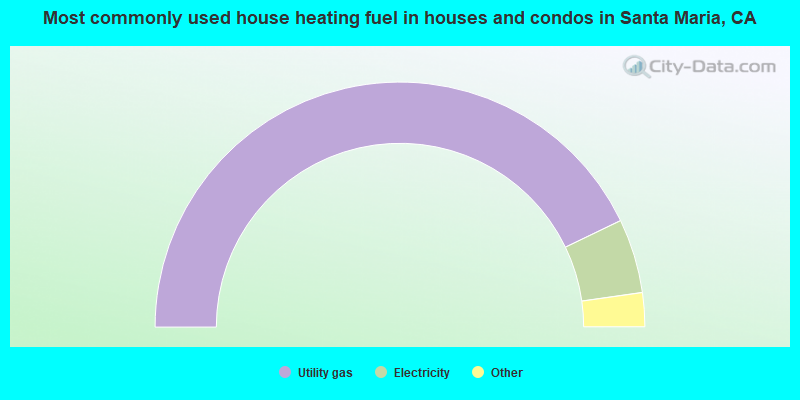
House heating fuel used in houses and condos - Utility gas (%)
House heating fuel used in houses and condos - Bottled, tank, or LP gas (%)
House heating fuel used in houses and condos - Electricity (%)
House heating fuel used in houses and condos - Fuel oil, kerosene, etc. (%)
House heating fuel used in houses and condos - Coal or coke (%)
House heating fuel used in houses and condos - Wood (%)
House heating fuel used in houses and condos - Solar energy (%)
House heating fuel used in houses and condos - Other fuel (%)
House heating fuel used in houses and condos - No fuel used (%)
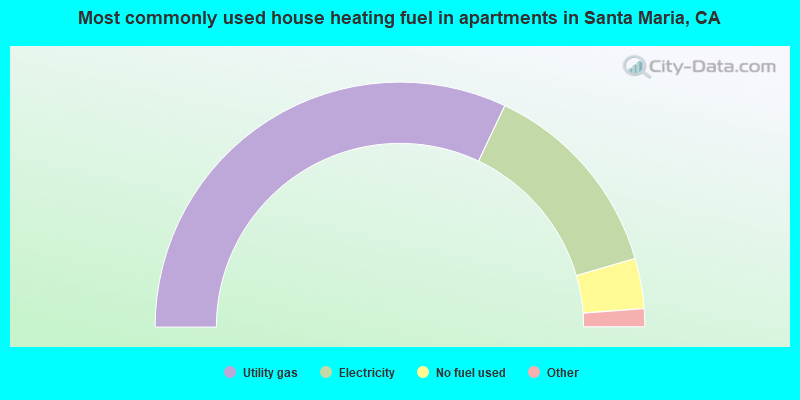
House heating fuel used in apartments - Utility gas (%)
House heating fuel used in apartments - Bottled, tank, or LP gas (%)
House heating fuel used in apartments - Electricity (%)
House heating fuel used in apartments - Fuel oil, kerosene, etc. (%)
House heating fuel used in apartments - Coal or coke (%)
House heating fuel used in apartments - Wood (%)
House heating fuel used in apartments - Solar energy (%)
House heating fuel used in apartments - Other fuel (%)
House heating fuel used in apartments - No fuel used (%)
CA Cities(Pop 65,000+) by Median Household Income, 2019 (8 replies)Why Santa Maria houses are substantially less expensive to purchase? (32 replies)Santa Barbara, Santa Maria or San Luis Obispo? (204 replies)CA Cities, Counties and Metro Areas by Number of Affluent Households, 2005-2009 (22 replies)San Joaquin Valley Gentrification thread(Fresno, Merced, Stockton, Bakersfield) (342 replies)Moving to Orange County max budget of 550k, want a house in Laguna Niguel Dana Point, Laguna Beach or San Clemente (132 replies)
Median year house/condo built: 1985Median year apartment built: 1983Household type by relationship:
Households: 110,124
Male householders: 15,055 (1,550 living alone ), Female householders: 13,852 (3,072 living alone )13,606 spouses (13,553 opposite-sex spouses ), 3,732 unmarried partners , (3,732 opposite-sex unmarried partners ), 39,532 children (36,527 natural , 1,545 adopted , 1,460 stepchildren ), 6,110 grandchildren , 3,262 brothers or sisters , 2,302 parents , 0 foster children , 6,278 other relatives , 5,073 non-relatives In group quarters: 1,322
Size of family households: 5,733 2-persons , 3,102 3-persons , 4,926 4-persons , 3,352 5-persons , 2,071 6-persons , 3,114 7-or-more-persons .
Size of nonfamily households: 4,622 1-person , 1,526 2-persons , 360 3-persons , 101 4-persons .
13,603 married couples with children. single-parent households (4,825 men , 7,265 women ).
33.8% of residents of Santa Maria speak English at home. of residents speak Spanish at home (50% speak English very well , 17% speak English well , 13% speak English not well , 21% don't speak English at all ).of residents speak other Indo-European language at home (83% speak English very well , 10% speak English well , 8% speak English not well ).of residents speak Asian or Pacific Island language at home (56% speak English very well , 29% speak English well , 12% speak English not well , 3% don't speak English at all ).of residents speak other language at home (27% speak English very well , 13% speak English well , 7% speak English not well , 54% don't speak English at all ).
Foreign born population: 35,184 (31.9%)of them are naturalized citizens )
Median number of rooms in houses and condos:
Median number of rooms in apartments
Owner-occupied Renter-occupied
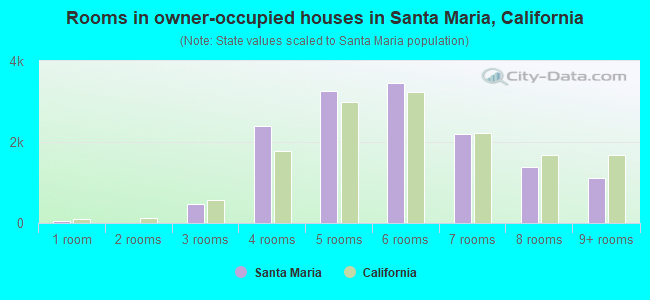
Rooms in owner-occupied houses in Santa Maria, California
53 1 room 0 2 rooms 469 3 rooms 2,389 4 rooms 3,247 5 rooms 3,469 6 rooms 2,208 7 rooms 1,391 8 rooms 1,110 9+ rooms
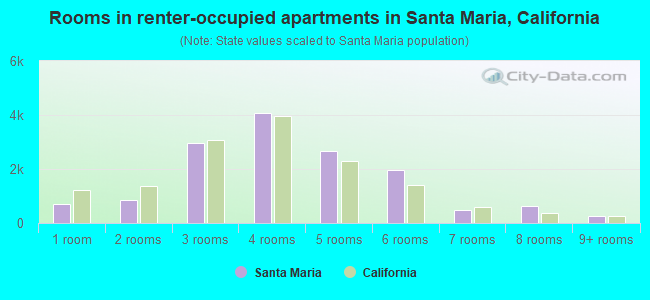
Rooms in renter-occupied apartments in Santa Maria, California
692 1 room 835 2 rooms 2,960 3 rooms 4,076 4 rooms 2,665 5 rooms 1,978 6 rooms 470 7 rooms 620 8 rooms 275 9+ rooms
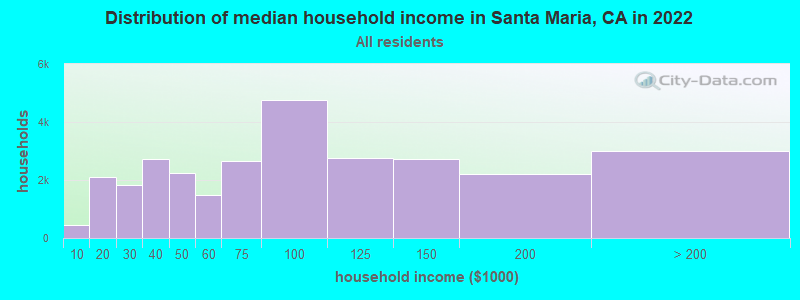
Santa Maria, CA household income distribution 463 Less than $10,0002,104 $10,000 to $19,9991,833 $20,000 to $29,9992,726 $30,000 to $39,9992,247 $40,000 to $49,9991,476 $50,000 to $59,9992,660 $60,000 to $74,9994,743 $75,000 to $99,9992,748 $100,000 to $124,9992,717 $125,000 to $149,9992,190 $150,000 to $199,9993,000 $200,000 or more
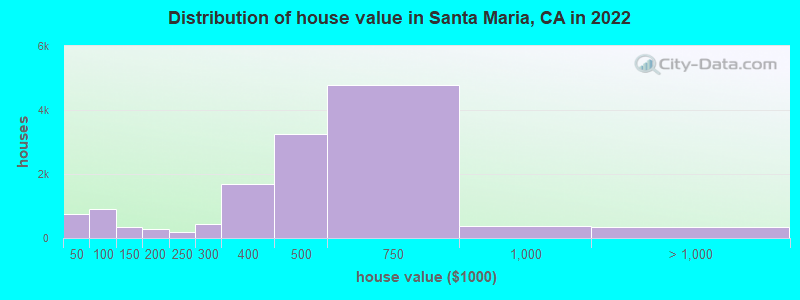
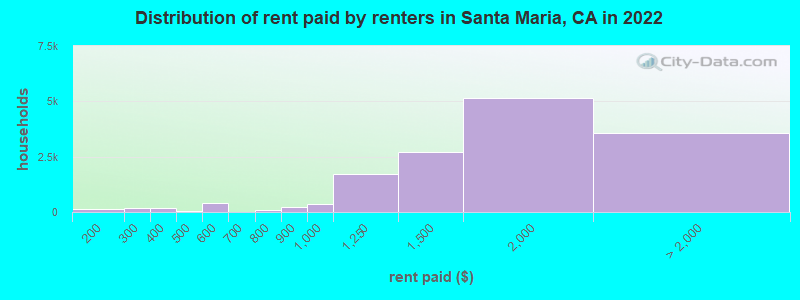
Home value of owner - occupied houses in 2022 in Santa Maria, CA 214 Less than $10,00034 $10,000 to $14,99984 $15,000 to $19,99935 $20,000 to $24,99958 $25,000 to $29,99949 $35,000 to $39,999283 $40,000 to $49,99983 $50,000 to $59,99972 $60,000 to $69,999194 $70,000 to $79,999145 $80,000 to $89,999133 $90,000 to $99,999196 $100,000 to $124,999139 $125,000 to $149,999219 $150,000 to $174,99949 $175,000 to $199,999199 $200,000 to $249,999430 $250,000 to $299,9991,690 $300,000 to $399,9993,264 $400,000 to $499,9994,793 $500,000 to $749,999369 $750,000 to $999,999181 $1,000,000 to $1,499,99917 $1,500,000 to $1,999,999140 $2,000,000 or moreRent paid by renters in 2022 in Santa Maria, CA 45 Less than $10056 $100 to $14960 $150 to $199101 $200 to $24976 $250 to $29983 $300 to $349101 $350 to $39935 $400 to $44921 $450 to $499333 $500 to $54995 $550 to $59910 $650 to $69945 $700 to $74951 $750 to $799231 $800 to $899348 $900 to $9991,731 $1,000 to $1,2492,722 $1,250 to $1,4995,163 $1,500 to $1,9991,737 $2,000 to $2,4991,242 $2,500 to $2,99984 $3,000 to $3,499226 $3,500 or more258 No cash rent
Percentage of workers working in this county: 81.5%Number of people working at home: 3,089 (6.4% of all workers )
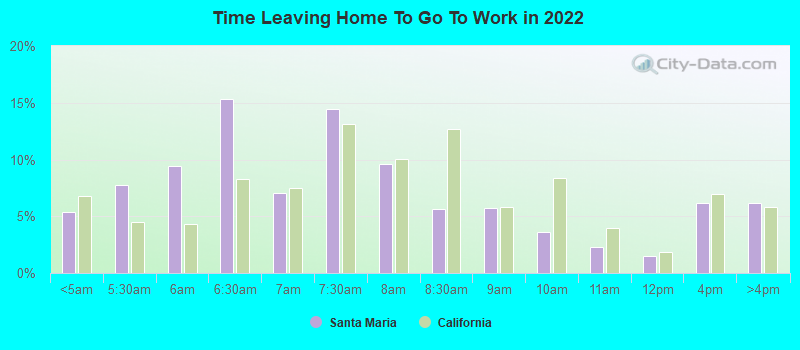
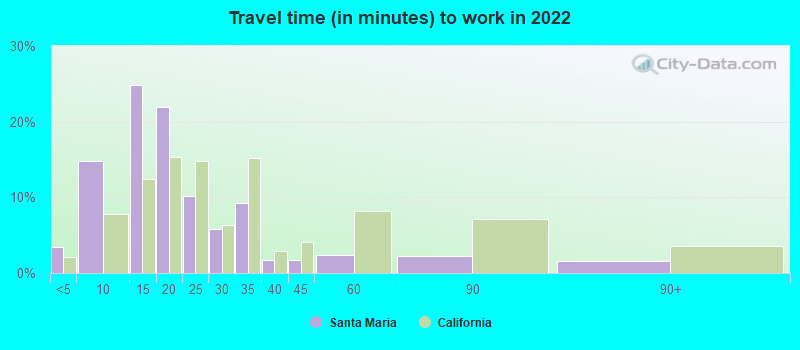
Travel time to work (commute)
Less than 5 minutes: 1,0455 to 9 minutes: 7,17510 to 14 minutes: 8,32415 to 19 minutes: 7,55120 to 24 minutes: 4,35925 to 29 minutes: 4,29130 to 34 minutes: 6,64935 to 39 minutes: 76840 to 44 minutes: 1,45645 to 59 minutes: 1,28360 to 89 minutes: 2,09190 or more minutes: 69
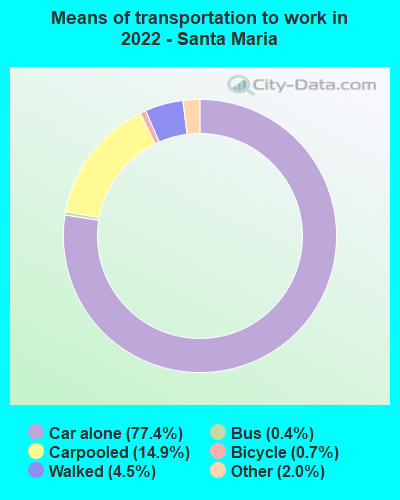
Means of transportation to work:
Drove a car alone: 34,735 (72.4%)Carpooled: 6,667 (13.9%)Bus : 180 (0.4%)Taxi: 919 (1.9%)Bicycle: 328 (0.7%)Walked: 2,030 (4.2%)Worked at home: 3,089 (6.4%)
Unemployment by race in 2022
Unemployment rate for White non-Hispanic residents 4.6% Males3.8% FemalesUnemployment rate for Black residents 6.8% MalesUnemployment rate for American Indian and Alaska Native residents 7.4% Males13.4% FemalesUnemployment rate for Asian residents 2.3% Males0.6% FemalesUnemployment rate for other race residents 5.9% Males5.1% FemalesUnemployment rate for two or more race residents 4.6% Males5.4% FemalesUnemployment rate for Hispanic or Latino residents 5.5% Males5.8% Females
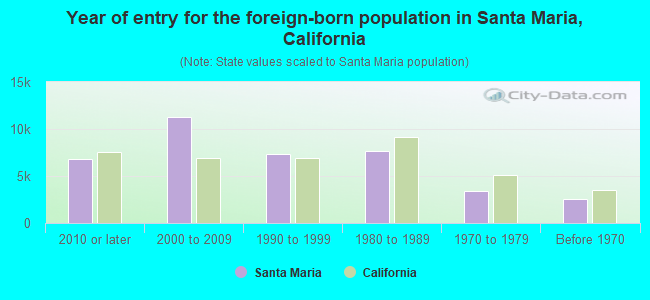
Year of entry for the foreign-born population in Santa Maria, California
6,823 2010 or later 11,293 2000 to 2009 7,369 1990 to 1999 7,693 1980 to 1989 3,383 1970 to 1979 2,527 Before 1970
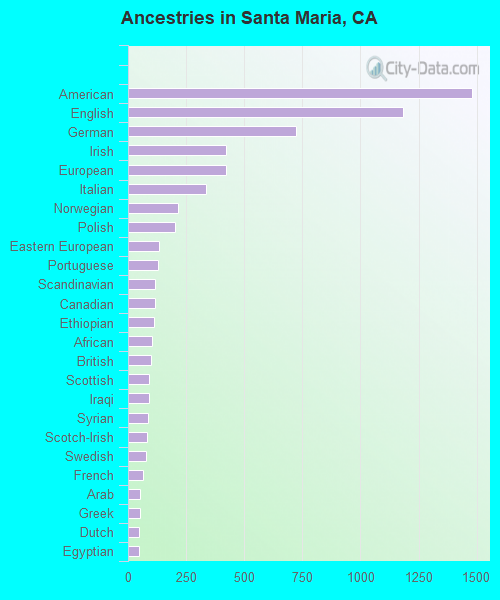
First ancestries reported:
American: 1,479 (1.9%)
English: 1,183 (1.5%)
German: 721 (0.9%)
Irish: 423 (0.5%)
European: 422 (0.5%)
Italian: 334 (0.4%)
Norwegian: 216 (0.3%)
Polish: 204 (0.3%)
Eastern European: 134 (0.2%)
Portuguese: 131 (0.2%)
Scandinavian: 116 (0.1%)
Canadian: 115 (0.1%)
Ethiopian: 111 (0.1%)
African: 103 (0.1%)
British: 100 (0.1%)
Scottish: 92 (0.1%)
Iraqi: 91 (0.1%)
Syrian: 84 (0.1%)
Scotch-Irish: 82 (0.1%)
Swedish: 79 (0.1%)
French: 63 (0.08%)
Arab: 53 (0.07%)
Greek: 53 (0.07%)
Dutch: 48 (0.06%)
Egyptian: 47 (0.06%)
Danish: 41 (0.05%)
Romanian: 38 (0.05%)
Swiss: 32 (0.04%)
Austrian: 31 (0.04%)
Serbian: 22 (0.03%)
French Canadian: 16 (0.02%)
Afghan: 15 (0.02%)
Basque: 13 (0.02%)
Welsh: 13 (0.02%)
Jordanian: 10 (0.01%)
Czech: 8 (0.01%)
Finnish: 7 (0.01%)
Russian: 7 (0.01%)
Czechoslovakian: 5 (0.01%)
Latvian: 4 (0.01%) Most common places of birth for foreign-born residents (%): Mexico Santa Maria:
81.0% (29,345)California:
37.2% (3,881,193)
Philippines Santa Maria:
7.2% (2,617)California:
7.8% (818,297)
El Salvador Santa Maria:
1.6% (595)California:
4.2% (440,287)
Place of birth for U.S.-born residents:
This state: 65,844Other state: 7,861Northeast: 988Midwest: 2,301South: 2,117West: 2,455 89.6% of Santa Maria residents lived in the same house 1 years ago.
Out of people who lived in different houses, 44.6% lived in this county.
Out of people who lived in different counties, 77.8% lived in California.
Santa Maria:
89.6%State average:
88.9%
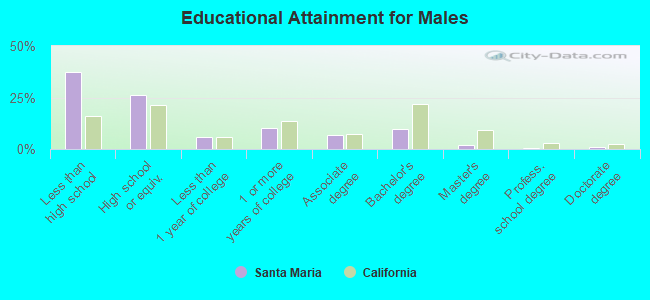
Education attainment for males 25 years and older:
No schooling: 1,884Nursery to 4th grade: 1,0465th and 6th grade: 3,7997th and 8th grade: 1,2999th grade: 97710th grade: 56411th grade: 41912th grade, no diploma: 1,391High school graduate (or equivalency): 7,878Less than 1 year of college: 1,831Some college more than 1 year, no degree: 3,132Associate degree: 2,109Bachelor's degree: 2,995Master's degree: 566Professional school degree: 160Doctorate degree: 247
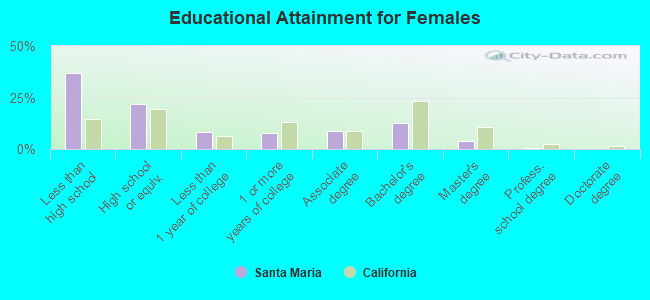
Education attainment for females 25 years and older:
No schooling: 2,491Nursery to 4th grade: 2,0105th and 6th grade: 3,4097th and 8th grade: 1,0109th grade: 1,19510th grade: 50611th grade: 51712th grade, no diploma: 818High school graduate (or equivalency): 7,114Less than 1 year of college: 2,619Some college more than 1 year, no degree: 2,545Associate degree: 2,775Bachelor's degree: 4,073Master's degree: 1,241Professional school degree: 155Doctorate degree: 0
Housing units in structures:
One, detached: 18,393One, attached: 1,348Two: 8203 or 4: 1,9625 to 9: 2,78710 to 19: 1,44920 to 49: 1,19650 or more: 929Mobile homes: 1,026Median worth of mobile homes: $94,794
Housing units lacking complete plumbing facilities in 2022: 0.4%Housing units lacking complete kitchen facilities in 2022: 1.1%House/condo owner moved in on average 15 years ago
Renter moved in on average 5 years ago
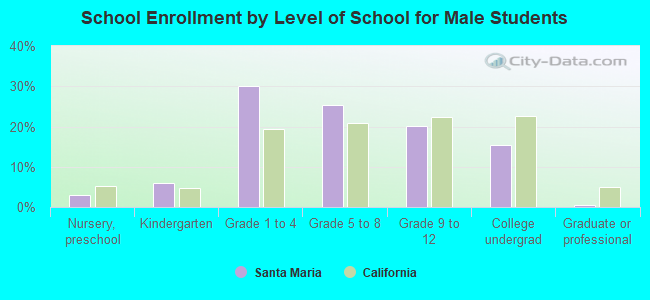
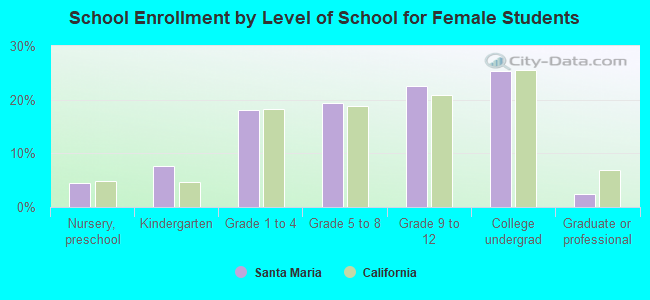
Private vs. public school enrollment:
Students in private schools in grades 1 to 8 (elementary and middle school): 366 Here:
2.4%California:
10.5%
Students in private schools in grades 9 to 12 (high school): 0 Students in private undergraduate colleges: 260 Here:
3.8%California:
15.9%