Housing density: 1,907 houses/condos per square mile
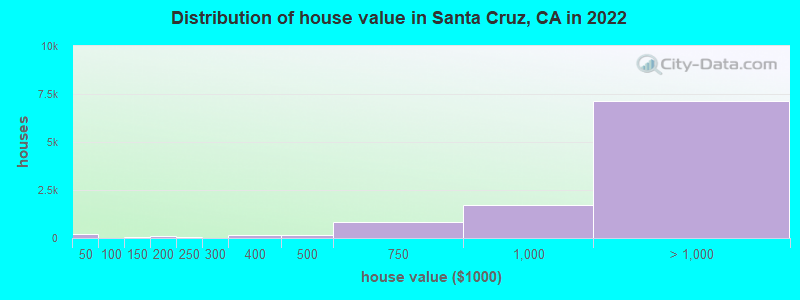
Median price asked for vacant for-sale houses and condos in 2022: $1,436,763.
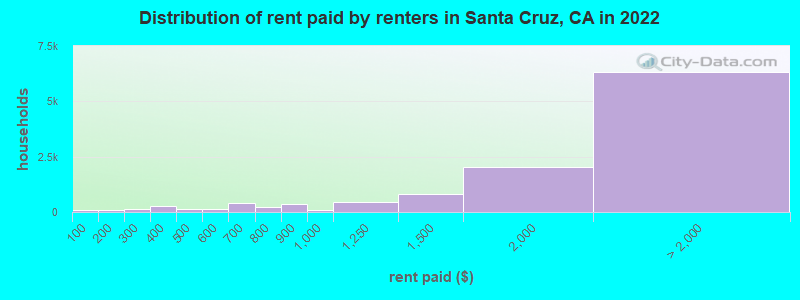
Median contract rent in 2022: over $2,000 (lower quartile is $1,406, upper quartile is over $2,000)
Median rent asked for vacant for-rent units in 2022: $4,718
Median gross rent in Santa Cruz, CA in 2022: over $2,000
Housing units in Santa Cruz with a mortgage: 6,121 (865 second mortgage, 44 home equity loan, 731 both second mortgage and home equity loan) Houses without a mortgage: 103
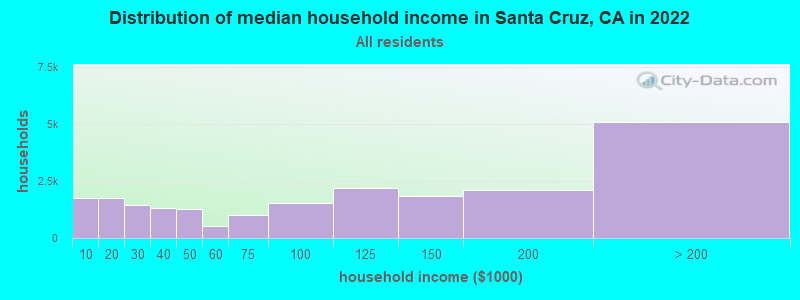
Median household income for houses/condos with a mortgage: $190,794
Median household income for apartments without a mortgage: $102,392
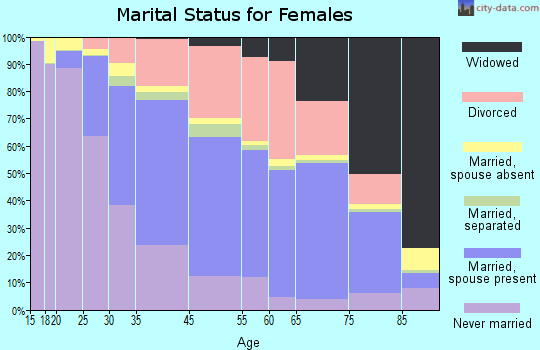
4,706 married couples with children.
1,782 single-parent households (772 men, 1,010 women).
73.5% of residents of Santa Cruz speak English at home.
13.9% of residents speak Spanish at home (77% speak English very well, 15% speak English well, 6% speak English not well, 1% don't speak English at all).
4.8% of residents speak other Indo-European language at home (91% speak English very well, 8% speak English well, 1% speak English not well).
6.0% of residents speak Asian or Pacific Island language at home (72% speak English very well, 20% speak English well, 6% speak English not well, 1% don't speak English at all).
1.2% of residents speak other language at home (100% speak English very well).
Foreign born population: 7,863 (13.0%)
(46.9% of them are naturalized citizens)
Percentage of workers working in this county: 89.4% Number of people working at home: 6,595 (22.2% of all workers)
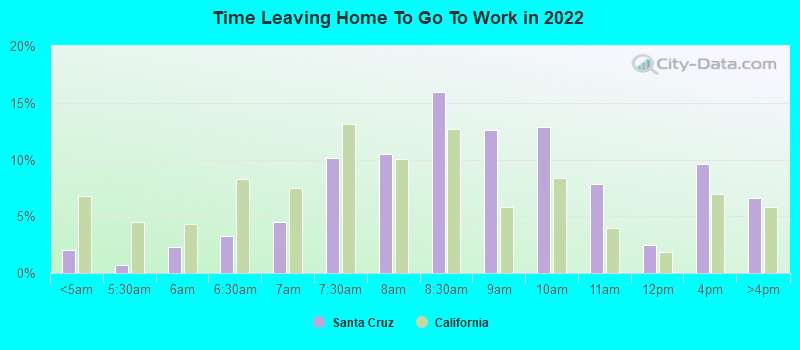
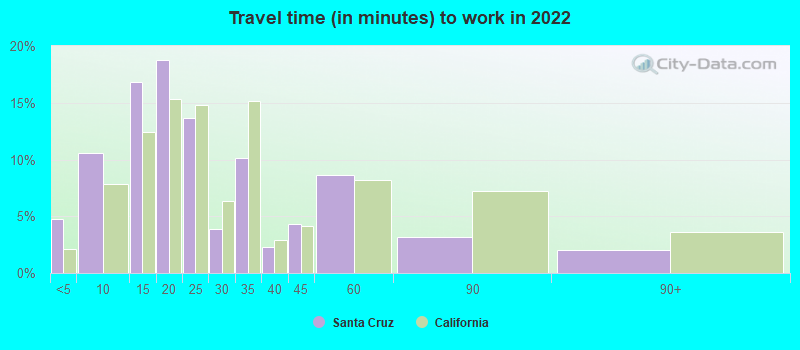
Travel time to work (commute)
Less than 5 minutes: 1,477
5 to 9 minutes: 3,518
10 to 14 minutes: 5,561
15 to 19 minutes: 4,512
20 to 24 minutes: 2,240
25 to 29 minutes: 342
30 to 34 minutes: 1,304
35 to 39 minutes: 220
40 to 44 minutes: 484
45 to 59 minutes: 2,336
60 to 89 minutes: 1,094
90 or more minutes: 430
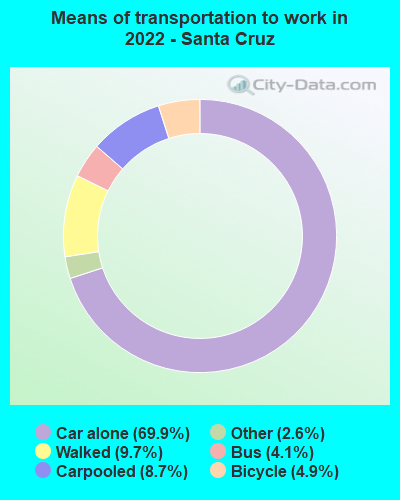
Means of transportation to work:
Drove a car alone: 22,405 (56.1%)
Carpooled: 3,106 (7.8%)
Bus: 1,876 (4.7%)
Subway or elevated rail: 16 (0.0%)
Long-distance train or commuter rail: 16 (0.0%)
Light rail, streetcar or trolley: 11 (0.0%)
Taxi: 919 (2.3%)
Bicycle: 1,774 (4.4%)
Walked: 3,055 (7.7%)
Worked at home: 6,595 (16.5%)
Unemployment by race in 2022
Unemployment rate for White non-Hispanic residents
5.1%Males
5.2%Females
Unemployment rate for Black residents
1.5%Males
1.4%Females
Unemployment rate for American Indian and Alaska Native residents
28.4%Males
6.6%Females
Unemployment rate for Asian residents
4.8%Males
4.0%Females
Unemployment rate for other race residents
4.3%Males
9.1%Females
Unemployment rate for two or more race residents
1.6%Males
7.4%Females
Unemployment rate for Hispanic or Latino residents
4.7%Males
8.2%Females
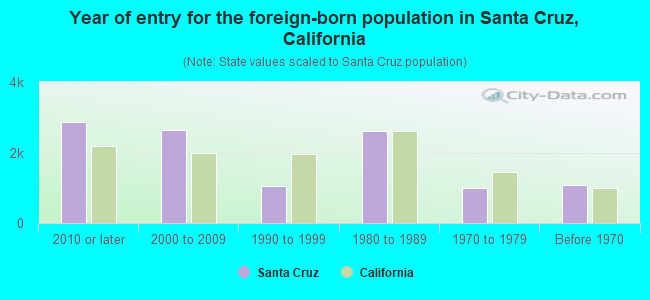
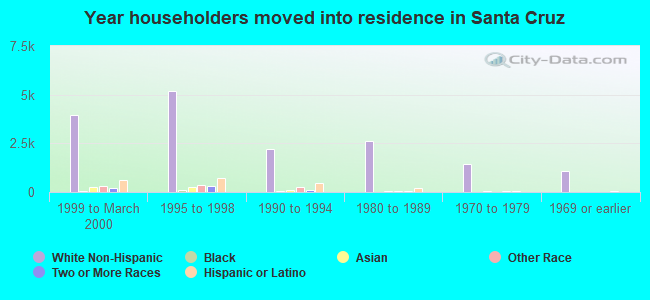
Year of entry for the foreign-born population in Santa Cruz, California
2,8732010 or later
2,6362000 to 2009
1,0441990 to 1999
2,6001980 to 1989
9821970 to 1979
1,068Before 1970
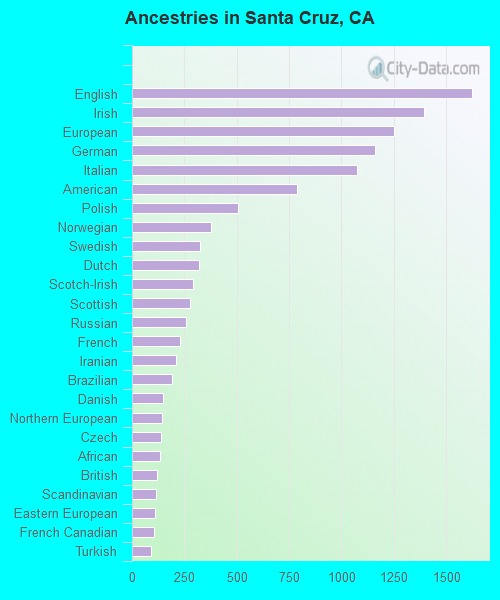
First ancestries reported:
English: 1,624 (6.1%)
Irish: 1,395 (5.2%)
European: 1,251 (4.7%)
German: 1,163 (4.4%)
Italian: 1,075 (4.0%)
American: 787 (3.0%)
Polish: 507 (1.9%)
Norwegian: 376 (1.4%)
Swedish: 323 (1.2%)
Dutch: 318 (1.2%)
Scotch-Irish: 291 (1.1%)
Scottish: 278 (1.0%)
Russian: 256 (1.0%)
French: 228 (0.9%)
Iranian: 210 (0.8%)
Brazilian: 192 (0.7%)
Danish: 150 (0.6%)
Northern European: 142 (0.5%)
Czech: 140 (0.5%)
African: 135 (0.5%)
British: 119 (0.4%)
Scandinavian: 116 (0.4%)
Eastern European: 108 (0.4%)
French Canadian: 107 (0.4%)
Turkish: 92 (0.3%)
Greek: 91 (0.3%)
Croatian: 84 (0.3%)
Armenian: 82 (0.3%)
Afghan: 76 (0.3%)
Hungarian: 73 (0.3%)
Belgian: 72 (0.3%)
Portuguese: 70 (0.3%)
Icelander: 69 (0.3%)
Egyptian: 54 (0.2%)
Austrian: 53 (0.2%)
Macedonian: 51 (0.2%)
Serbian: 47 (0.2%)
Lebanese: 41 (0.2%)
Finnish: 38 (0.1%)
Canadian: 36 (0.1%)
West Indian: 35 (0.1%)
Ethiopian: 30 (0.1%)
Welsh: 29 (0.1%)
Australian: 26 (0.10%)
Nigerian: 21 (0.08%)
Swiss: 21 (0.08%)
Palestinian: 18 (0.07%)
Israeli: 18 (0.07%)
Sierra Leonean: 16 (0.06%)
Moroccan: 15 (0.06%)
Assyrian: 15 (0.06%)
South African: 14 (0.05%)
Ukrainian: 12 (0.05%)
Syrian: 11 (0.04%)
Slovene: 10 (0.04%)
Basque: 10 (0.04%)
Yugoslavian: 8 (0.03%)
Latvian: 7 (0.03%)
Romanian: 3 (0.01%)
Most common places of birth for foreign-born residents (%):
Mexico
Santa Cruz:
22.7% (1,736)
California:
37.2% (3,881,193)
China, excluding Hong Kong and Taiwan
Santa Cruz:
12.7% (976)
California:
6.6% (684,672)
India
Santa Cruz:
9.0% (688)
California:
5.2% (539,184)
Germany
Santa Cruz:
4.3% (329)
California:
0.7% (73,304)
Canada
Santa Cruz:
4.2% (324)
California:
1.2% (127,477)
Philippines
Santa Cruz:
3.4% (257)
California:
7.8% (818,297)
Korea
Santa Cruz:
2.6% (201)
California:
3.0% (315,248)
Japan
Santa Cruz:
2.4% (186)
California:
1.0% (103,575)
England
Santa Cruz:
2.4% (183)
California:
0.6% (57,953)
El Salvador
Santa Cruz:
2.2% (168)
California:
4.2% (440,287)
United Kingdom, excluding England and Scotland
Santa Cruz:
2.0% (155)
California:
0.6% (60,582)
Brazil
Santa Cruz:
2.0% (154)
California:
0.5% (53,222)
France
Santa Cruz:
1.7% (128)
California:
0.4% (40,224)
Iran
Santa Cruz:
1.7% (128)
California:
2.0% (206,004)
Peru
Santa Cruz:
1.6% (125)
California:
0.7% (74,025)
Taiwan
Santa Cruz:
1.5% (117)
California:
1.7% (176,274)
Place of birth for U.S.-born residents:
This state: 38,566
Other state: 12,643
Northeast: 3,710
Midwest: 3,293
South: 2,629
West: 3,027
69.2% of Santa Cruz residents lived in the same house 1 years ago. Out of people who lived in different houses, 26.3% lived in this county. Out of people who lived in different counties, 86.6% lived in California.
Santa Cruz:
69.2%
State average:
88.9%
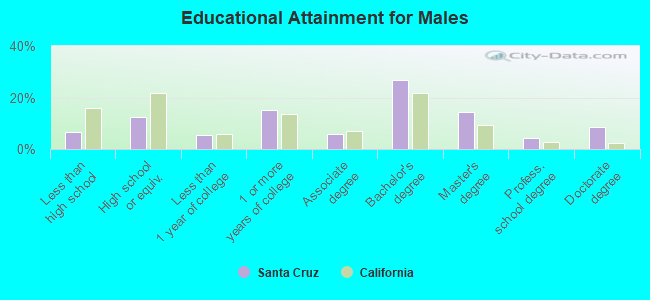
Education attainment for males 25 years and older:
No schooling: 189
Nursery to 4th grade: 21
5th and 6th grade: 202
7th and 8th grade: 64
9th grade: 66
10th grade: 23
11th grade: 319
12th grade, no diploma: 233
High school graduate (or equivalency): 2,135
Less than 1 year of college: 961
Some college more than 1 year, no degree: 2,615
Associate degree: 1,019
Bachelor's degree: 4,607
Master's degree: 2,437
Professional school degree: 725
Doctorate degree: 1,483
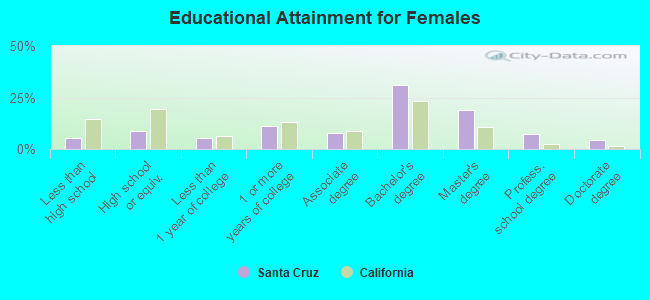
Education attainment for females 25 years and older:
No schooling: 174
Nursery to 4th grade: 11
5th and 6th grade: 154
7th and 8th grade: 33
9th grade: 157
10th grade: 97
11th grade: 87
12th grade, no diploma: 168
High school graduate (or equivalency): 1,501
Less than 1 year of college: 936
Some college more than 1 year, no degree: 1,888
Associate degree: 1,378
Bachelor's degree: 5,390
Master's degree: 3,295
Professional school degree: 1,224
Doctorate degree: 746
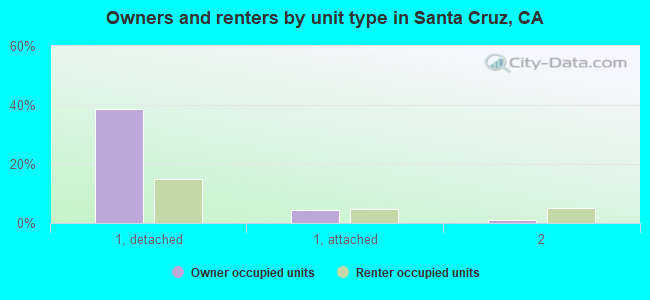
Housing units in structures:
One, detached: 13,286
One, attached: 2,223
Two: 1,132
3 or 4: 1,662
5 to 9: 1,771
10 to 19: 774
20 to 49: 690
50 or more: 1,834
Mobile homes: 477
Boats, RVs, vans, etc.: 49
Median worth of mobile homes: $206,098
Housing units lacking complete plumbing facilities in 2022: 0.8%
Housing units lacking complete kitchen facilities in 2022: 1.9%
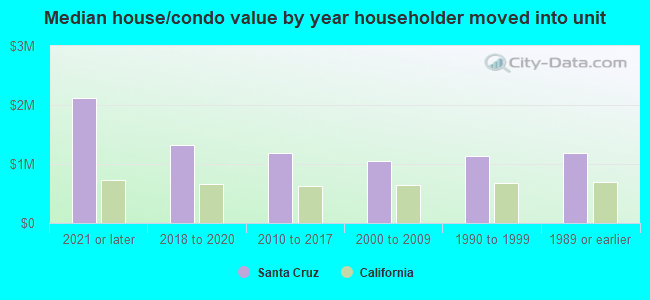
House/condo owner moved in on average 14 years ago